Estimated zip code population in 2022: 878 Zip code population in 2010: 663 Zip code population in 2000: 474
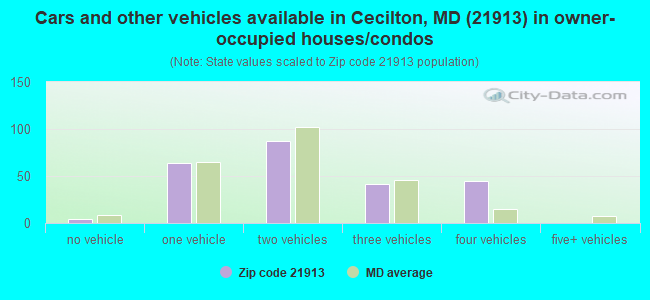
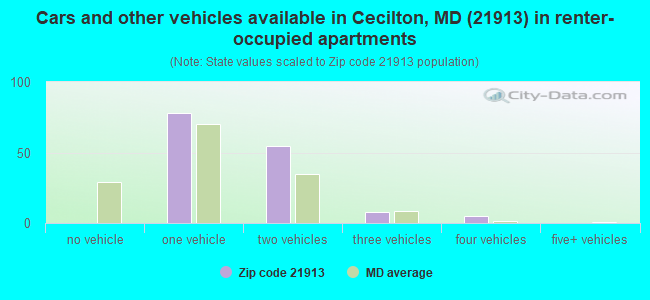
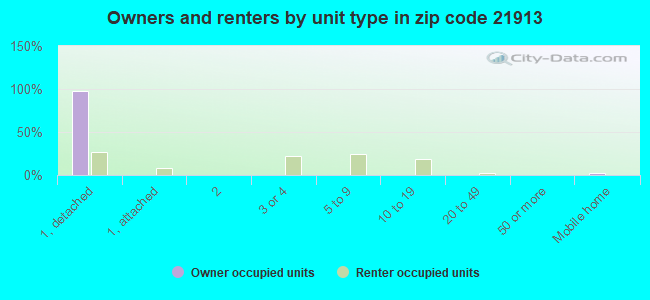
Houses and condos: 415 Renter-occupied apartments: 146
% of renters here:
37%
State:
32%
March 2022 cost of living index in zip code 21913: 98.9 (near average, U.S. average is 100)
Land area: 0.5 sq. mi. Water area: 0.0 sq. mi.
Population density: 1,951 people per square mile
(low).
OSM Map
General Map
Google Map
MSN Map
OSM Map
General Map
Google Map
MSN Map
OSM Map
General Map
Google Map
MSN Map
OSM Map
General Map
Google Map
MSN Map
Please wait while loading the map...
Real estate property taxes paid for housing units in 2022:
This zip code:
1.1% ($2,488)
Maryland:
0.9% ($3,777)
Median real estate property taxes paid for housing units with mortgages in 2022: $2,539 (1.0%) Median real estate property taxes paid for housing units with no mortgage in 2022: $2,390 (1.3%)
Business Search- 14 Million verified businesses
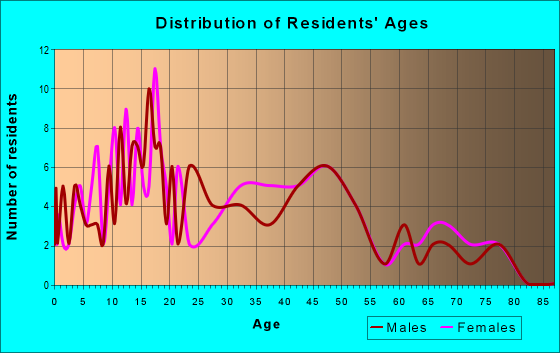
Males: 395
(45.0%)
Females: 483
(55.0%)
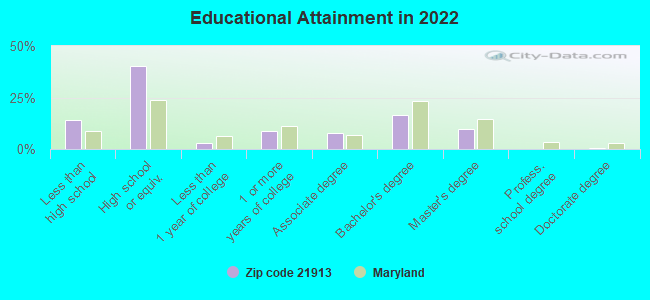
For population 25 years and over in 21913:
High school or higher: 83.5%
Bachelor's degree or higher: 25.7%
Graduate or professional degree: 9.7%
Unemployed: 8.7%
Mean travel time to work (commute): 31.1 minutes
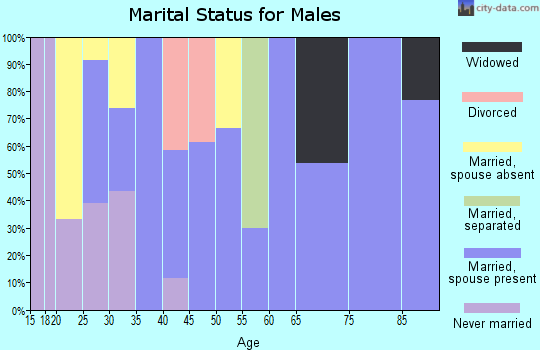
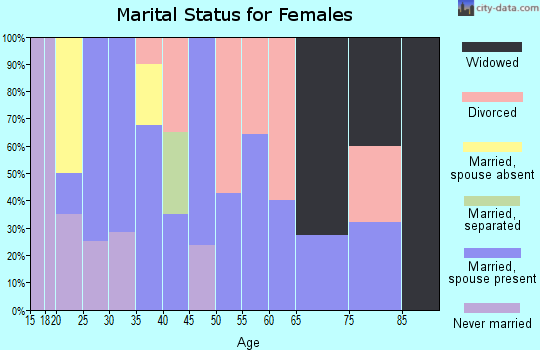
For population 15 years and over in 21913:
Never married: 31.3%
Now married: 42.2%
Separated: 2.8%
Widowed: 12.9%
Divorced: 10.8%
Zip code 21913 compared to state average:
Median household income significantly below state average.
Median house value below state average.
Unemployed percentage above state average.
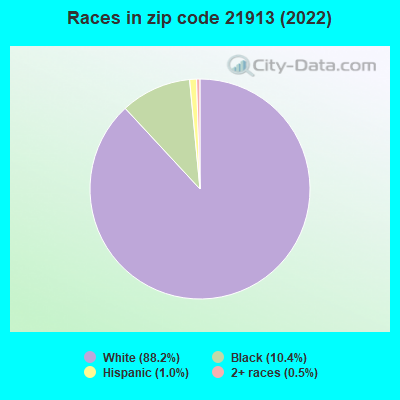
Black race population percentage below state average.
Hispanic race population percentage significantly below state average.
Median age below state average.
Foreign-born population percentage significantly below state average.
Percentage of population with a bachelor's degree or higher below state average.
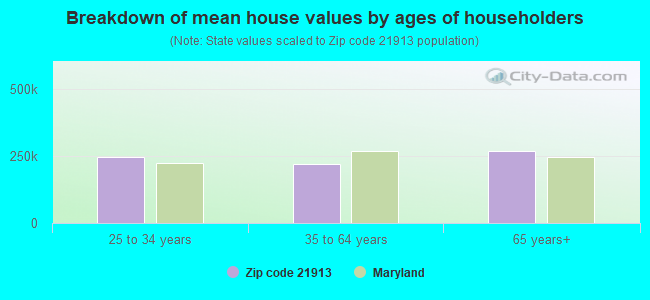
Estimated median house/condo value in 2022: $233,838
21913:
$233,838
Maryland:
$398,100
Median resident age:
This zip code:
32.7 years
Maryland median age:
39.7 years
Average household size:
This zip code:
2.2 people
Maryland:
2.5 people
Averages for the 2004 tax year for zip code 21913, filed in 2005:
Average Adjusted Gross Income (AGI) in 2004: $43,733 (Individual Income Tax Returns)
Here:
$43,733
State:
$60,339
Salary/wage: $36,892 (reported on 82.2% of returns)
Here:
$36,892
State:
$52,211
(% of AGI for various income ranges: 80.4% for AGIs below $10k, 67.3% for AGIs $10k-25k, 81.4% for AGIs $25k-50k, 74.8% for AGIs $50k-75k, 83.9% for AGIs $75k-100k, 45.7% for AGIs over 100k)
Taxable interest for individuals: $1,095 (reported on 45.3% of returns)
This zip code:
$1,095
Maryland:
$1,701
(% of AGI for various income ranges: 2.1% for AGIs below $10k, 3.0% for AGIs $10k-25k, 0.8% for AGIs $25k-50k, 0.8% for AGIs $50k-75k, 0.8% for AGIs $75k-100k, 1.1% for AGIs over 100k)
Taxable dividends: $5,145 (reported on 20.5% of returns)
Here:
$5,145
State:
$4,235
(% of AGI for various income ranges: 7.8% for AGIs below $10k, 0.7% for AGIs $25k-50k, 2.1% for AGIs $50k-75k, 0.7% for AGIs $75k-100k, 5.7% for AGIs over 100k)
Net capital gain/loss: +$5,071 (reported on 11.3% of returns)
Here:
+$5,071
State:
+$15,888
Profit/loss from business: +$3,540 (reported on 13.5% of returns)
Here:
+$3,540
State:
+$12,221
(% of AGI for various income ranges: 11.1% for AGIs below $10k, 8.1% for AGIs $10k-25k, 2.4% for AGIs $25k-50k, -3.1% for AGIs $50k-75k)
Total itemized deductions: $18,128 (23% of AGI, reported on 35.8% of returns)
Here:
$18,128
State:
$22,960
Here:
23.3% of AGI
State:
23.3% of AGI
(% of AGI for various income ranges: 10.1% for AGIs $10k-25k, 12.5% for AGIs $25k-50k, 15.0% for AGIs $50k-75k, 18.7% for AGIs $75k-100k, 17.0% for AGIs over 100k)
Charity contributions deductions: $1,902 (2% of AGI, reported on 30.2% of returns)
Here:
$1,902
State:
$4,031
Here:
2.4% of AGI
State:
3.9% of AGI
(% of AGI for various income ranges: 1.6% for AGIs $10k-25k, 1.2% for AGIs $25k-50k, 1.8% for AGIs $50k-75k, 1.8% for AGIs $75k-100k, 0.8% for AGIs over 100k)
Total tax: $5,925 (reported on 75.7% of returns)
21913:
$5,925
State:
$10,167
(% of AGI for various income ranges: 2.4% for AGIs below $10k, 4.9% for AGIs $10k-25k, 6.6% for AGIs $25k-50k, 8.9% for AGIs $50k-75k, 10.4% for AGIs $75k-100k, 16.7% for AGIs over 100k)
Earned income credit: $1,426 (reported on 16.4% of returns)
Here:
$1,426
State:
$1,700
Percentage of individuals using paid preparers for their 2004 taxes: 62.3%
Here:
62%
State:
55%
(% for various income ranges: 56.9% for AGIs below $10k, 57.6% for AGIs $10k-25k, 61.2% for AGIs $25k-50k, 66.7% for AGIs $50k-75k, 75.0% for AGIs $75k-100k, 73.9% for AGIs over 100k)
Household received Food Stamps/SNAP in the past 12 months: 92 Household did not receive Food Stamps/SNAP in the past 12 months: 304
Women who had a birth in the past 12 months: 2 (0 now married, 2 unmarried) Women who did not have a birth in the past 12 months: 236 (89 now married, 147 unmarried)
Housing units in zip code 21913 with a mortgage: 158 (5 second mortgage) Houses without a mortgage: 6
Median monthly owner costs for units with a mortgage: $1,966 Median monthly owner costs for units without a mortgage: $707
Residents with income below the poverty level in 2022:
This zip code:
19.7%
Whole state:
9.6%
Residents with income below 50% of the poverty level in 2022:
This zip code:
6.0%
Whole state:
4.7%
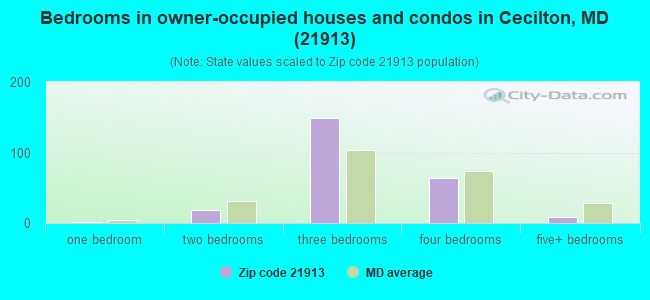
Median number of rooms in houses and condos:
Here:
6.8
State:
7.3
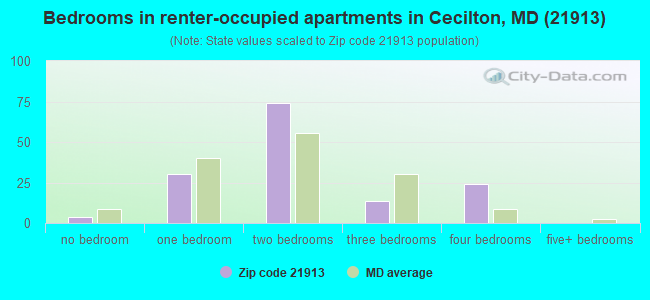
Median number of rooms in apartments:
Here:
4.0
State:
4.2
Notable locations in this zip code not listed on our city pages
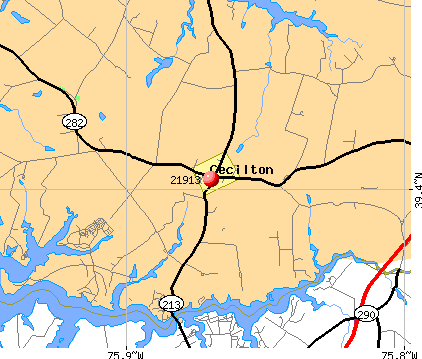
Notable locations in zip code 21913: Cecilton Volunteer Fire Company (A), Cecilton Branch Cecil County Public Library (B), Cecilton Town Hall (C). Display/hide their locations on the map
Churches in zip code 21913 include: Cecilton United Methodist Church (A), Union Bethel African Methodist Episcopal Church (B). Display/hide their locations on the map
Size of family households: 118 2-persons, 49 3-persons, 31 4-persons, 24 5-persons, 3 6-persons
Size of nonfamily households: 108 1-person, 56 2-persons
95 married couples with children.
48 single-parent households (13 men, 35 women).
97.8% of residents of 21913 zip code speak English at home.
0.6% of residents speak Spanish at home (40% very well, 60% not well).
Foreign born population: 0 (0.0%)
:
0.0%
Whole state:
16.7%
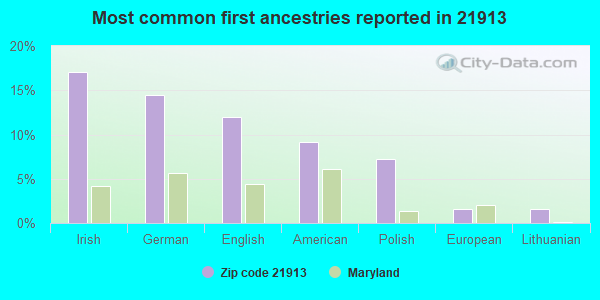
17%Irish
15%German
12%English
9%American
7%Polish
2%European
2%Lithuanian
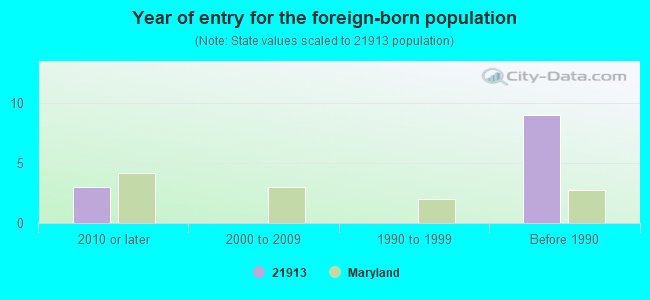
Year of entry for the foreign-born population
32010 or later
02000 to 2009
01990 to 1999
9Before 1990
Facilities with environmental interests located in this zip code:
CECILTON ELEMENTARY SCHOOL (251 MAIN STREET, WEST in CECILTON, MD)
AIR MINOR (AIRS/AFS) STATE MASTER (Maryland Air Emissions Database) - AIR MINOR (National Center for Education Statistics) - STATE ID-070104 Business SIC classification: ELEMENTARY AND SECONDARY SCHOOLS Organizations: BOARD OF EDUCATION OF CECIL COUNTY (SCHOOL DISTRICT)
CECILTON WASTEWATER TREATMENT PLANT (256 NORTH BOHEMIA AVENUE in CECILTON, MD)
STATE MASTER (Maryland Permits tracking) - NPDES NON-MAJOR National Pollutant Discharge Elimination System NON-MAJOR (Tracking pollutant discharge elimination systems) - permit Business SIC classification: SEWERAGE SYSTEMS Alternative names: CECILTON, TOWN OF, CECILTON WWTP
Housing units lacking complete plumbing facilities: 2.7% Housing units lacking complete kitchen facilities: 4.1%
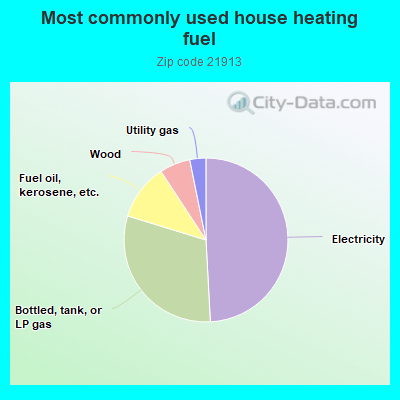
49.5%Electricity
30.8%Bottled, tank, or LP gas
11.1%Fuel oil, kerosene, etc.
6.1%Wood
3.2%Utility gas
Population in 1990: 611.
Place of birth for U.S.-born residents:
This state: 362
Northeast: 166
Midwest: 50
South: 261
West: 7
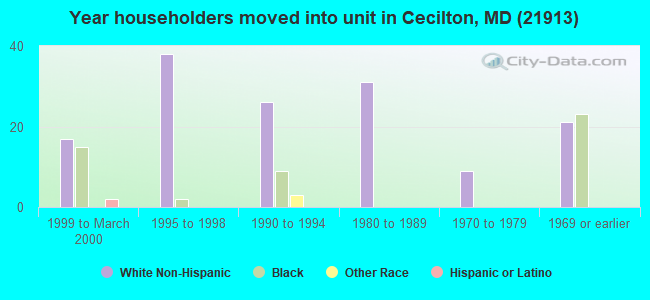
61% of the 21913 zip code residents lived in the same house 5 years ago. Out of people who lived in different houses, 67% lived in this county. Out of people who lived in different counties, 50% lived in Maryland.
98% of the 21913 zip code residents lived in the same house 1 year ago. Out of people who lived in different houses, 67% moved from this county. Out of people who lived in different houses, 40% moved from different county within same state. Out of people who lived in different houses, 7% moved from different state.
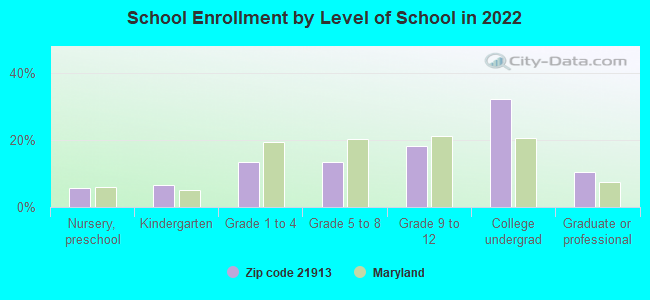
Private vs. public school enrollment:
Students in private schools in grades 1 to 8 (elementary and middle school):
Here:
0.0%
Maryland:
15.2%
Students in private schools in grades 9 to 12 (high school):
Here:
0.0%
Maryland:
14.4%
Students in private undergraduate colleges: 18
Here:
32.7%
Maryland:
20.2%
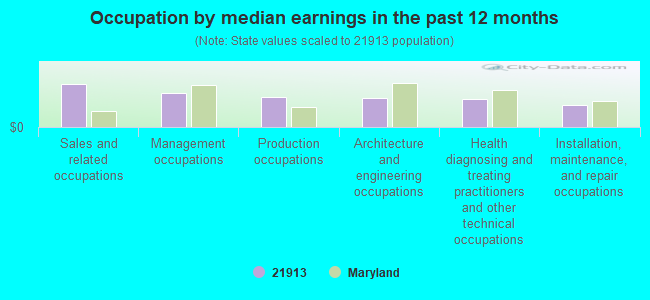
Occupation by median earnings in the past 12 months ($)
128,458Sales and related occupations
101,239Management occupations
90,168Production occupations
88,093Architecture and engineering occupations
83,218Health diagnosing and treating practitioners and other technical occupations
64,843Installation, maintenance, and repair occupations
Top industries in this zip code by the number of employees in 2005:
Other Services (except Public Administration): Other Similar Organizations (except Business, Professional, Labor, and Political Organizations) (20-49: 1)
Construction: Land Subdivision (5-9: 1)
Construction: Water and Sewer Line and Related Structures Construction (5-9: 1)
Finance and Insurance: Commercial Banking (5-9: 1)
Construction: Other Heavy and Civil Engineering Construction (5-9: 1)
Other Services (except Public Administration): Religious Organizations (1-4: 2)
Home Mortgage Disclosure Act Aggregated Statistics For Year 2009 (Based on 2 partial tracts)
C) Refinancings
Number
Average Value
LOANS ORIGINATED
2
$216,830
APPLICATIONS APPROVED, NOT ACCEPTED
0
$0
APPLICATIONS DENIED
1
$157,160
APPLICATIONS WITHDRAWN
1
$162,560
FILES CLOSED FOR INCOMPLETENESS
0
$0
Aggregated Statistics For Year 2008 (Based on 2 partial tracts)
C) Refinancings
Number
Average Value
LOANS ORIGINATED
1
$278,070
APPLICATIONS APPROVED, NOT ACCEPTED
0
$0
APPLICATIONS DENIED
1
$135,350
APPLICATIONS WITHDRAWN
0
$0
FILES CLOSED FOR INCOMPLETENESS
0
$0
Aggregated Statistics For Year 2007 (Based on 2 partial tracts)
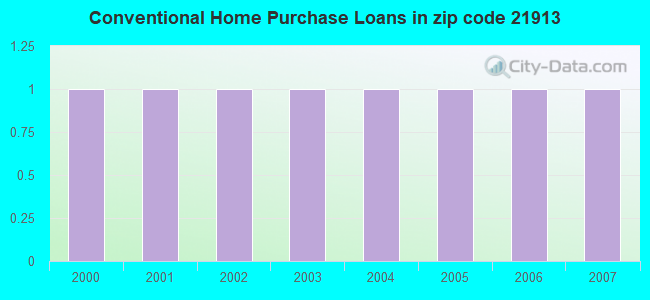
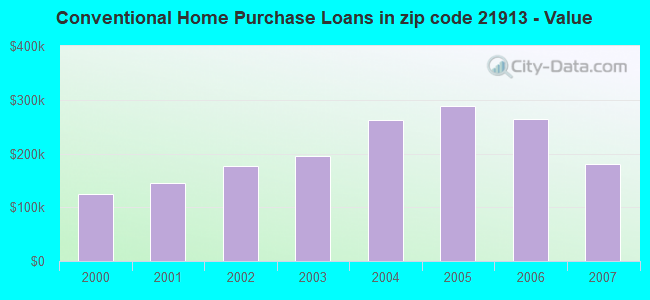
B) Conventional Home Purchase Loans
C) Refinancings
F) Non-occupant Loans on < 5 Family Dwellings (A B C & D)
Number
Average Value
Number
Average Value
Number
Average Value
LOANS ORIGINATED
1
$179,700
2
$179,865
1
$109,140
APPLICATIONS APPROVED, NOT ACCEPTED
0
$0
0
$0
0
$0
APPLICATIONS DENIED
0
$0
1
$220,010
0
$0
APPLICATIONS WITHDRAWN
0
$0
1
$116,030
0
$0
FILES CLOSED FOR INCOMPLETENESS
0
$0
0
$0
0
$0
Aggregated Statistics For Year 2006 (Based on 2 partial tracts)
B) Conventional Home Purchase Loans
C) Refinancings
D) Home Improvement Loans
Number
Average Value
Number
Average Value
Number
Average Value
LOANS ORIGINATED
1
$263,660
2
$197,775
1
$54,890
APPLICATIONS APPROVED, NOT ACCEPTED
0
$0
0
$0
0
$0
APPLICATIONS DENIED
0
$0
1
$180,610
0
$0
APPLICATIONS WITHDRAWN
0
$0
1
$173,470
0
$0
FILES CLOSED FOR INCOMPLETENESS
0
$0
0
$0
0
$0
Aggregated Statistics For Year 2005 (Based on 2 partial tracts)
B) Conventional Home Purchase Loans
C) Refinancings
D) Home Improvement Loans
F) Non-occupant Loans on < 5 Family Dwellings (A B C & D)
Number
Average Value
Number
Average Value
Number
Average Value
Number
Average Value
LOANS ORIGINATED
1
$288,180
2
$192,605
1
$25,300
1
$110,340
APPLICATIONS APPROVED, NOT ACCEPTED
0
$0
0
$0
0
$0
0
$0
APPLICATIONS DENIED
0
$0
1
$107,490
0
$0
0
$0
APPLICATIONS WITHDRAWN
0
$0
1
$163,430
0
$0
0
$0
FILES CLOSED FOR INCOMPLETENESS
0
$0
0
$0
0
$0
0
$0
Aggregated Statistics For Year 2004 (Based on 2 partial tracts)
B) Conventional Home Purchase Loans
C) Refinancings
D) Home Improvement Loans
F) Non-occupant Loans on < 5 Family Dwellings (A B C & D)
Number
Average Value
Number
Average Value
Number
Average Value
Number
Average Value
LOANS ORIGINATED
1
$262,070
2
$221,350
1
$26,670
1
$126,720
APPLICATIONS APPROVED, NOT ACCEPTED
0
$0
0
$0
0
$0
0
$0
APPLICATIONS DENIED
0
$0
1
$131,890
0
$0
0
$0
APPLICATIONS WITHDRAWN
0
$0
1
$97,520
0
$0
0
$0
FILES CLOSED FOR INCOMPLETENESS
0
$0
0
$0
0
$0
0
$0
Aggregated Statistics For Year 2003 (Based on 2 partial tracts)
B) Conventional Home Purchase Loans
C) Refinancings
F) Non-occupant Loans on < 5 Family Dwellings (A B C & D)
Number
Average Value
Number
Average Value
Number
Average Value
LOANS ORIGINATED
1
$195,350
4
$179,902
1
$100,980
APPLICATIONS APPROVED, NOT ACCEPTED
0
$0
1
$76,420
0
$0
APPLICATIONS DENIED
0
$0
1
$248,180
0
$0
APPLICATIONS WITHDRAWN
0
$0
1
$156,100
0
$0
FILES CLOSED FOR INCOMPLETENESS
0
$0
0
$0
0
$0
Aggregated Statistics For Year 2002 (Based on 2 partial tracts)
B) Conventional Home Purchase Loans
C) Refinancings
F) Non-occupant Loans on < 5 Family Dwellings (A B C & D)
Number
Average Value
Number
Average Value
Number
Average Value
LOANS ORIGINATED
1
$176,630
2
$193,040
1
$84,960
APPLICATIONS APPROVED, NOT ACCEPTED
0
$0
0
$0
0
$0
APPLICATIONS DENIED
0
$0
1
$116,360
0
$0
APPLICATIONS WITHDRAWN
0
$0
1
$76,440
0
$0
FILES CLOSED FOR INCOMPLETENESS
0
$0
0
$0
0
$0
Aggregated Statistics For Year 2001 (Based on 2 partial tracts)
B) Conventional Home Purchase Loans
C) Refinancings
Number
Average Value
Number
Average Value
LOANS ORIGINATED
1
$145,470
2
$124,525
APPLICATIONS APPROVED, NOT ACCEPTED
0
$0
0
$0
APPLICATIONS DENIED
0
$0
1
$69,540
APPLICATIONS WITHDRAWN
0
$0
0
$0
FILES CLOSED FOR INCOMPLETENESS
0
$0
0
$0
Aggregated Statistics For Year 2000 (Based on 2 partial tracts)
B) Conventional Home Purchase Loans
C) Refinancings
Number
Average Value
Number
Average Value
LOANS ORIGINATED
1
$124,490
1
$79,110
APPLICATIONS APPROVED, NOT ACCEPTED
0
$0
0
$0
APPLICATIONS DENIED
0
$0
0
$0
APPLICATIONS WITHDRAWN
0
$0
0
$0
FILES CLOSED FOR INCOMPLETENESS
0
$0
0
$0
Aggregated Statistics For Year 1999 (Based on 1 partial tract)
Detailed HMDA statistics for the following Tracts:0301.00
2002 - 2018 National Fire Incident Reporting System (NFIRS) incidents
Based on the data from the years 2002 - 2018 the average number of fire incidents per year is 12. The highest number of fire incidents - 19 took place in 2010, and the least - 2 in 2015. The data has a declining trend.
When looking into fire subcategories, the most reports belonged to: Structure Fires (55.0%), and Outside Fires (27.5%).
Fire incident types reported to NFIRS in Zip Code 21913
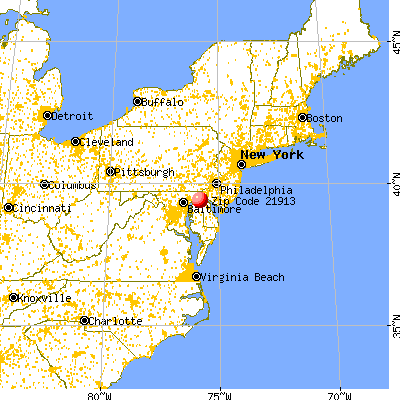


 Nearest zip codes: 21930, 21912, 21919, 21635, 21915, 21650.
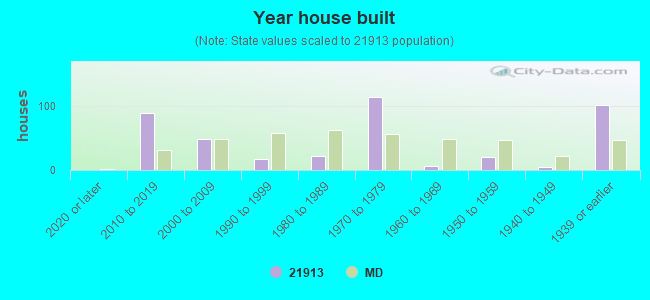


 Based on the data from the years 2002 - 2018 the average number of fire incidents per year is 12. The highest number of fire incidents - 19 took place in 2010, and the least - 2 in 2015. The data has a declining trend.
 When looking into fire subcategories, the most reports belonged to: Structure Fires (55.0%), and Outside Fires (27.5%).