Estimated zip code population in 2022: 105
Zip code population in 2010: 114
Zip code population in 2000: 128
March 2022 cost of living index in zip code 21653: 90.5
(less than average, U.S. average is 100)
Land area: 0.2
sq. mi.
Water area: 0.0
sq. mi.
| Population density: 604 people per square mile | | (low). |
![Age and Sex of Residents in zip code 21653]()
- OSM Map
- General Map
- Google Map
- MSN Map
- OSM Map
- General Map
- Google Map
- MSN Map
- OSM Map
- General Map
- Google Map
- MSN Map
- OSM Map
- General Map
- Google Map
- MSN Map
Please wait while loading the map...
Real estate property taxes paid for housing units in 2022:
| This zip code: | 0.7% ($2,883) |
| Maryland: | 0.9% ($3,777) |
$3,316
Business Search - 14 Million verified businesses
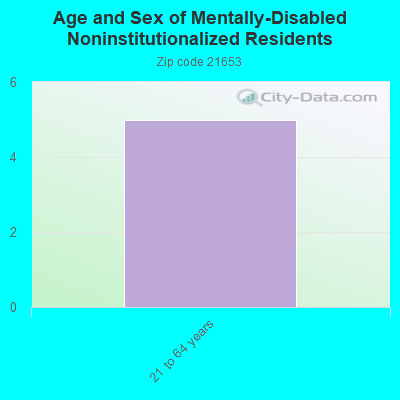
| Males: 56 |  (53.3%) (53.3%) |
| Females: 49 |  (46.7%) (46.7%) |
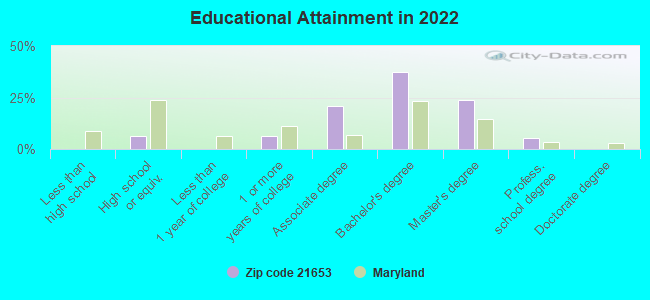
For population 25 years and over in 21653:
- High school or higher: 101.9%
- Bachelor's degree or higher: 68.2%
- Graduate or professional degree: 30.0%
- Mean travel time to work (commute): 24.5 minutes
For population 15 years and over in 21653:
- Never married: 17.3%
- Now married: 49.8%
- Separated: 0.0%
- Widowed: 20.4%
- Divorced: 12.5%
Zip code 21653 compared to state average:
- Median household income significantly below state average.
- Unemployed percentage significantly below state average.
- Black race population percentage significantly below state average.
- Hispanic race population percentage significantly below state average.
- Median age significantly above state average.
- Foreign-born population percentage significantly below state average.
- Renting percentage significantly below state average.
- Length of stay since moving in significantly below state average.
- Percentage of population with a bachelor's degree or higher above state average.
Data:
100%
rural population.
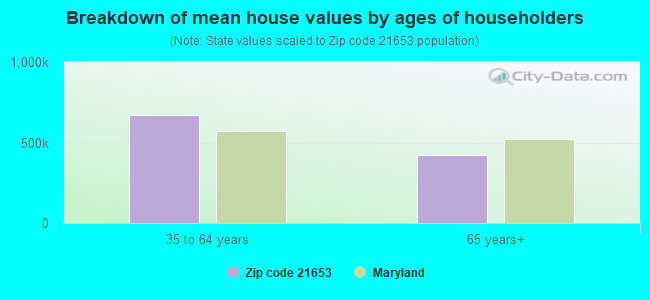
Estimated median house/condo value in 2022: $418,502
| 21653: | $418,502 |
| Maryland: | $398,100 |
Median resident age:| This zip code: | 59.3 years |
| Maryland median age: | 39.7 years |
Average household size:| This zip code: | 1.7 people |
| Maryland: | 2.5 people |
Averages for the 2004 tax year for zip code 21653, filed in 2005:
Average Adjusted Gross Income (AGI) in 2004: $47,846 (Individual Income Tax Returns)
| Here: | $47,846 |
| State: | $60,339 |
Salary/wage: $38,174 (reported on 70.8% of returns)
| Here: | $38,174 |
| State: | $52,211 |
Taxable interest for individuals: $469 (reported on 49.2% of returns)
| This zip code: | $469 |
| Maryland: | $1,701 |
Taxable dividends: $857 (reported on 21.5% of returns)
Profit/loss from business: +$2,615 (reported on 20.0% of returns)
| Here: | +$2,615 |
| State: | +$12,221 |
Total itemized deductions: $18,120 (23% of AGI, reported on 38.5% of returns)
| Here: | $18,120 |
| State: | $22,960 |
| Here: | 22.9% of AGI |
| State: | 23.3% of AGI |
Charity contributions deductions: $2,526 (3% of AGI, reported on 29.2% of returns)
| Here: | 2.8% of AGI |
| State: | 3.9% of AGI |
Total tax: $6,582 (reported on 84.6% of returns)
| 21653: | $6,582 |
| State: | $10,167 |
Percentage of individuals using paid preparers for their 2004 taxes: 72.3%
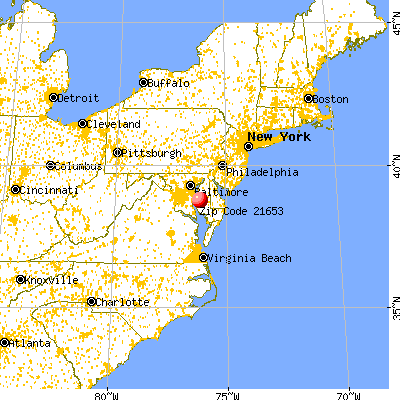
![21653 map]() Nearest zip codes: 21662
Nearest zip codes: 21662,
21663,
21654,
21612,
21652,
21601.
Percentage of family households:| This zip code: | 6.4% |
| Maryland: | 45.9% |
Percentage of households with unmarried partners:| This zip code: | 21.6% |
| Maryland: | 46.5% |
No gay or lesbian households reported
Household received Food Stamps/SNAP in the past 12 months: 0
Household did not receive Food Stamps/SNAP in the past 12 months: 60
Women who did not have a birth in the past 12 months: 6 (0 now married, 6 unmarried)
Housing units in zip code 21653 with a mortgage: 50
Residents with income below the poverty level in 2022:
| This zip code: | 13.3% |
| Whole state: | 9.6% |
Median number of rooms in houses and condos:

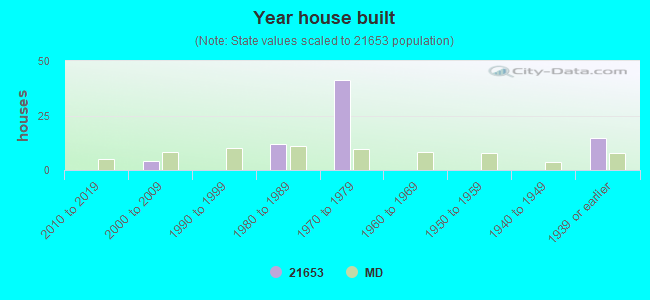
- Year house built (houses)
- 02020 or later
- 02010 to 2019
- 42000 to 2009
- 01990 to 1999
- 121980 to 1989
- 411970 to 1979
- 01960 to 1969
- 01950 to 1959
- 01940 to 1949
- 151939 or earlier
![Zip code 21653 satellite photo by USGS]()
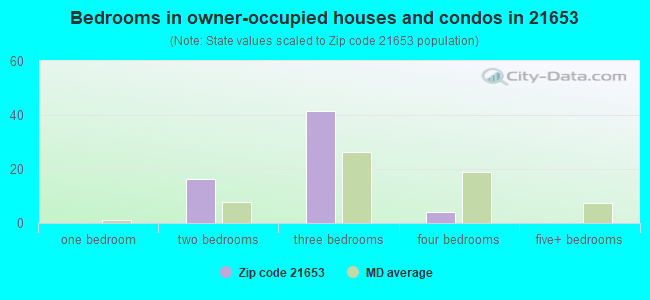
- Bedrooms in owner-occupied houses and condos in 21653
- 0no bedroom
- 01 bedroom
- 162 bedrooms
- 423 bedrooms
- 44 bedrooms
- 05+ bedrooms
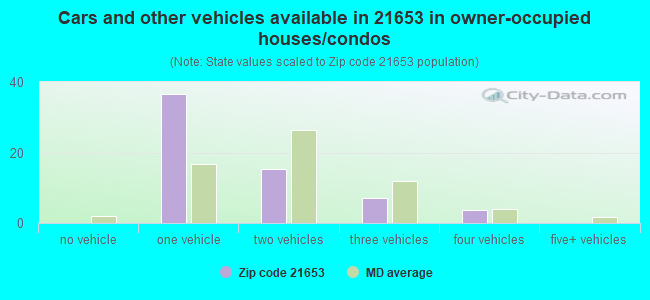
- Cars and other vehicles available in 21653 in owner-occupied houses/condos
- 0no vehicle
- 371 vehicle
- 152 vehicles
- 73 vehicles
- 44 vehicles
- 05+ vehicles
Zip code 21653 household income distribution in 2022
![Zip code 21653 household income distribution in 2022]()
- 15Less than $10,000
- 4$45,000 to $49,999
- 16$75,000 to $99,999
- 4$100,000 to $124,999
- 14$150,000 to $199,999
- 7$200,000 or more
Estimate of home value of owner-occupied houses/condos in 2022 in zip code 21653
![Estimate of home value of owner-occupied houses/condos in 2022 in zip code 21653]()
- 13$250,000 to $299,999
- 15$300,000 to $399,999
- 13$400,000 to $499,999
- 8$500,000 to $749,999
- 11$750,000 to $999,999
Estimated median house (or condo) value in 2022 for:
- White Non-Hispanic householders: $418,501
Estimated median house or condo value in 2022: $418,502
| 21653: | $418,502 |
| Maryland: | $398,100 |
$315,887 - $606,214
Mean price in 2022:
Detached houses: $493,912| Here: | $493,912 |
| State: | $526,819 |
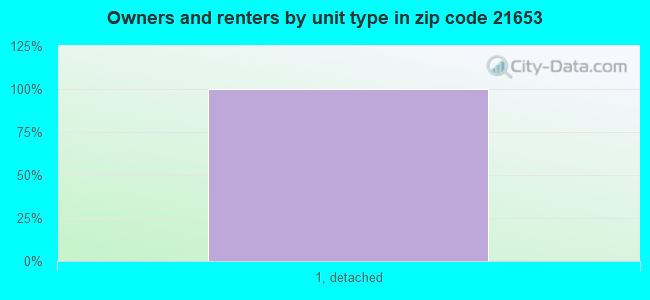
Housing units in structures:
Means of transportation to work in zip code 21653
![Means of transportation to work in zip code 21653]()
- 83.2%43Drove a car alone
- 11.6%6Carpooled
Travel time to work (commute) in zip code 21653
![Travel time to work (commute) in zip code 21653]()
- 1010 to 14 minutes
- 1915 to 19 minutes
- 630 to 34 minutes
- 645 to 59 minutes
- 560 to 89 minutes
Percentage of zip code residents living and working in this county: 78.4%
Household type by relationship:
Households: 105
- Male householders: 47 (25 living alone), Female householders: 14 (11 living alone)
26 spouses (26 opposite-sex spouses), 0 unmarried partners, (0 opposite-sex unmarried partners), 13 children (13 natural, 0 adopted, 0 stepchildren), 0 grandchildren, 0 brothers or sisters, 6 parents, 0 foster children, 0 other relatives, 0 non-relatives
Size of family households: 15 2-persons, 7 3-persons, 4 4-persons
Size of nonfamily households: 35 1-person
94.3% of residents of 21653 zip code speak English at home.
5.7% of residents speak other Indo-European language at home (100% very well).
Foreign born population: 0 (0.0%)

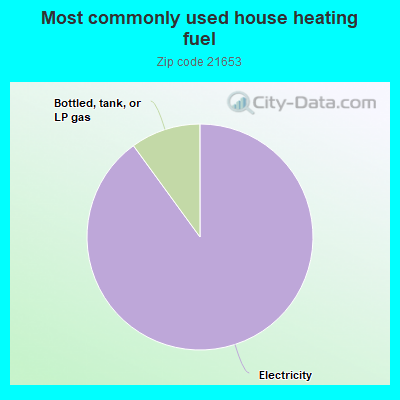
- 90.7%Electricity
- 10.1%Bottled, tank, or LP gas
Place of birth for U.S.-born residents:
- This state: 40
- Northeast: 6
- Midwest: 16
- South: 24
- West: 15
100% of the 21653 zip code residents lived in the same house 5 years ago.
101% of the 21653 zip code residents lived in the same house 1 year ago.
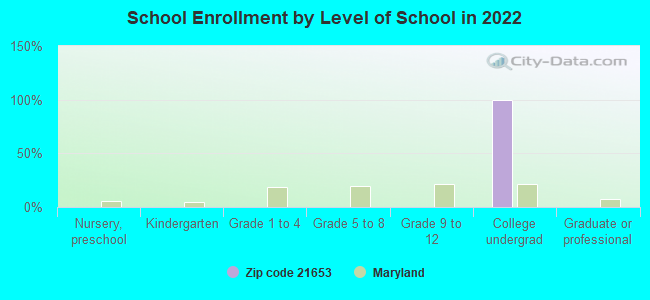
Students in private undergraduate colleges:
Top industries in this zip code by the number of employees in 2005:
- Construction: Flooring Contractors (1-4 employees: 1 establishment)
- Administrative and Support and Waste Management and Remediation Services: Carpet and Upholstery Cleaning Services (1-4: 1)
| Most common first names in zip code 21653 among deceased individuals |
| Name | Count | Lived (average) |
|---|
| Charles | 3 | 82.4 years |
| Henry | 3 | 69.0 years |
| Mary | 3 | 82.7 years |
| William | 3 | 75.7 years |
| Emma | 2 | 71.5 years |
| Harvey | 2 | 66.0 years |
| George | 2 | 72.0 years |
| Richard | 2 | 76.5 years |
| Robert | 2 | 76.5 years |
| Most common last names in zip code 21653 among deceased individuals |
| Last name | Count | Lived (average) |
|---|
| Kilmon | 5 | 77.4 years |
| Schall | 4 | 65.0 years |
| Smith | 4 | 76.8 years |
| Fino | 2 | 63.0 years |
| Bailey | 2 | 81.5 years |
| Fisher | 2 | 79.5 years |
| Holland | 2 | 79.5 years |
| Hall | 2 | 86.0 years |
| Bissell | 2 | 79.0 years |
| Lloyd | 2 | 86.0 years |
 100% rural population.


 Nearest zip codes: 21662, 21663, 21654, 21612, 21652, 21601.