Estimated zip code population in 2022: 1,515 Zip code population in 2010: 1,936 Zip code population in 2000: 1,922
Houses and condos: 1,040 Renter-occupied apartments: 180
% of renters here:
26%
State:
32%
March 2022 cost of living index in zip code 21555: 91.5 (less than average, U.S. average is 100)
Land area: 106.0 sq. mi. Water area: 2.3 sq. mi.
Population density: 14 people per square mile
(very low).
OSM Map
General Map
Google Map
MSN Map
OSM Map
General Map
Google Map
MSN Map
OSM Map
General Map
Google Map
MSN Map
OSM Map
General Map
Google Map
MSN Map
Please wait while loading the map...
Real estate property taxes paid for housing units in 2022:
This zip code:
0.9% ($1,607)
Maryland:
0.9% ($3,777)
Median real estate property taxes paid for housing units with mortgages in 2022: $1,702 (0.9%) Median real estate property taxes paid for housing units with no mortgage in 2022: $1,244 (1.0%)
Business Search- 14 Million verified businesses
Males: 767
(50.6%)
Females: 748
(49.4%)
For population 25 years and over in 21555:
High school or higher: 87.0%
Bachelor's degree or higher: 11.0%
Graduate or professional degree: 4.4%
Unemployed: 9.9%
Mean travel time to work (commute): 45.5 minutes
For population 15 years and over in 21555:
Never married: 12.9%
Now married: 72.7%
Separated: 3.7%
Widowed: 4.0%
Divorced: 6.7%
Zip code 21555 compared to state average:
Median household income below state average.
Median house value below state average.
Unemployed percentage above state average.
Black race population percentage significantly below state average.
Hispanic race population percentage significantly below state average.
Median age significantly above state average.
Foreign-born population percentage significantly below state average.
Length of stay since moving in significantly above state average.
Number of college students significantly below state average.
Percentage of population with a bachelor's degree or higher significantly below state average.
Averages for the 2020 tax year for zip code 21555, filed in 2021:
Average Adjusted Gross Income (AGI) in 2020: $49,630 (Individual Income Tax Returns)
Here:
$49,630
State:
$86,905
Salary/wage: $46,485 (reported on 78.6% of returns)
Here:
$46,485
State:
$73,953
(% of AGI for various income ranges: 1030.6% for AGIs below $25k, 3168.1% for AGIs $25k-50k, 6173.3% for AGIs $50k-75k, 8700.0% for AGIs $75k-100k, 15940.0% for AGIs $100k-200k)
Taxable interest for individuals: $244 (reported on 35.7% of returns)
This zip code:
$244
Maryland:
$1,528
(% of AGI for various income ranges: 8.8% for AGIs below $25k, 11.9% for AGIs $25k-50k, 13.3% for AGIs $50k-75k, 10.0% for AGIs $75k-100k, 18.0% for AGIs $100k-200k)
Ordinary dividends: $957 (reported on 10.0% of returns)
Here:
$957
State:
$8,028
(% of AGI for various income ranges: 31.2% for AGIs $25k-50k, 28.3% for AGIs $75k-100k)
Net capital gain/loss in AGI: +$750 (reported on 8.6% of returns)
Here:
+$750
State:
+$25,238
(% of AGI for various income ranges: 76.7% for AGIs $75k-100k)
Profit/loss from business: +$4,529 (reported on 10.0% of returns)
Here:
+$4,529
State:
+$11,398
(% of AGI for various income ranges: 135.3% for AGIs below $25k, 96.7% for AGIs $50k-75k)
Taxable individual retirement arrangement distribution: $9,940 (reported on 7.1% of returns)
21555:
$9,940
Maryland:
$20,944
(% of AGI for various income ranges: 145.0% for AGIs $25k-50k, 441.7% for AGIs $75k-100k)
Total itemized deductions: $24,450 (reported on 5.7% of returns)
Here:
$24,450
State:
$30,672
(% of AGI for various income ranges: 1630.0% for AGIs $75k-100k)
Charity contributions: $5,075 (reported on 5.7% of returns)
Here:
$5,075
State:
$9,065
(% of AGI for various income ranges: 338.3% for AGIs $75k-100k)
Taxes paid: $7,025 (reported on 5.7% of returns)
21555:
$7,025
State:
$8,475
(% of AGI for various income ranges: 468.3% for AGIs $75k-100k)
Earned income credit: $2,108 (reported on 18.6% of returns)
Here:
$2,108
State:
$2,151
(% of AGI for various income ranges: 91.8% for AGIs below $25k, 73.8% for AGIs $25k-50k)
Percentage of individuals using paid preparers for their 2020 taxes: 95.7%
Here:
96%
State:
90%
(% for various income ranges: 95.7% for AGIs below $25k, 94.7% for AGIs $25k-50k, 91.7% for AGIs $50k-75k, 100.0% for AGIs $75k-100k, 100.0% for AGIs $100k-200k)
Averages for the 2012 tax year for zip code 21555, filed in 2013:
Average Adjusted Gross Income (AGI) in 2012: $39,092 (Individual Income Tax Returns)
Here:
$39,092
State:
$72,703
Salary/wage: $36,200 (reported on 83.8% of returns)
Here:
$36,200
State:
$62,228
(% of AGI for various income ranges: 67.4% for AGIs below $25k, 79.7% for AGIs $25k-50k, 79.4% for AGIs $50k-75k, 78.4% for AGIs $75k-100k, 78.8% for AGIs $100k-200k)
Taxable interest for individuals: $381 (reported on 35.1% of returns)
This zip code:
$381
Maryland:
$1,413
(% of AGI for various income ranges: 1.2% for AGIs below $25k, 0.2% for AGIs $25k-50k, 0.1% for AGIs $50k-75k, 0.4% for AGIs $75k-100k)
Ordinary dividends: $814 (reported on 9.5% of returns)
Here:
$814
State:
$6,933
Profit/loss from business: +$4,512 (reported on 10.8% of returns)
Here:
+$4,512
State:
+$12,606
(% of AGI for various income ranges: 4.7% for AGIs below $25k, 2.5% for AGIs $25k-50k)
Taxable individual retirement arrangement distribution: $8,660 (reported on 6.8% of returns)
21555:
$8,660
Maryland:
$17,065
Total itemized deductions: $16,485 (24% of AGI, reported on 27.0% of returns)
Here:
$16,485
State:
$27,886
Here:
24.5% of AGI
State:
22.8% of AGI
(% of AGI for various income ranges: 11.0% for AGIs $25k-50k, 13.4% for AGIs $50k-75k, 14.1% for AGIs $75k-100k, 14.9% for AGIs $100k-200k)
Charity contributions: $2,081 (reported on 21.6% of returns)
Here:
$2,081
State:
$4,452
(% of AGI for various income ranges: 0.7% for AGIs $25k-50k, 1.7% for AGIs $50k-75k, 1.3% for AGIs $75k-100k, 1.8% for AGIs $100k-200k)
Taxes paid: $6,260 (reported on 27.0% of returns)
21555:
$6,260
State:
$11,690
(% of AGI for various income ranges: 3.0% for AGIs $25k-50k, 4.4% for AGIs $50k-75k, 5.9% for AGIs $75k-100k, 7.9% for AGIs $100k-200k)
Earned income credit: $1,953 (reported on 20.3% of returns)
Here:
$1,953
State:
$2,199
(% of AGI for various income ranges: 4.9% for AGIs below $25k, 1.5% for AGIs $25k-50k)
Percentage of individuals using paid preparers for their 2012 taxes: 56.8%
Here:
57%
State:
52%
(% for various income ranges: 48.4% for AGIs below $25k, 60.0% for AGIs $25k-50k, 58.3% for AGIs $50k-75k, 71.4% for AGIs $75k-100k, 75.0% for AGIs $100k-200k)
Averages for the 2004 tax year for zip code 21555, filed in 2005:
Average Adjusted Gross Income (AGI) in 2004: $34,507 (Individual Income Tax Returns)
Here:
$34,507
State:
$60,339
Salary/wage: $32,247 (reported on 85.6% of returns)
Here:
$32,247
State:
$52,211
(% of AGI for various income ranges: 97.6% for AGIs below $10k, 75.5% for AGIs $10k-25k, 84.6% for AGIs $25k-50k, 83.2% for AGIs $50k-75k, 83.3% for AGIs $75k-100k, 57.6% for AGIs over 100k)
Taxable interest for individuals: $401 (reported on 45.6% of returns)
This zip code:
$401
Maryland:
$1,701
(% of AGI for various income ranges: 1.6% for AGIs below $10k, 1.0% for AGIs $10k-25k, 0.4% for AGIs $25k-50k, 0.6% for AGIs $50k-75k, 0.2% for AGIs $75k-100k, 0.5% for AGIs over 100k)
Taxable dividends: $1,088 (reported on 11.0% of returns)
Here:
$1,088
State:
$4,235
(% of AGI for various income ranges: 0.2% for AGIs $10k-25k, 0.0% for AGIs $25k-50k, 0.3% for AGIs $50k-75k, 2.1% for AGIs over 100k)
Net capital gain/loss: +$7,594 (reported on 8.8% of returns)
Here:
+$7,594
State:
+$15,888
(% of AGI for various income ranges: 0.2% for AGIs $10k-25k, 0.3% for AGIs $25k-50k, 0.2% for AGIs $50k-75k, 16.4% for AGIs over 100k)
Profit/loss from business: +$4,888 (reported on 11.0% of returns)
Here:
+$4,888
State:
+$12,221
IRA payment deduction: $1,688 (reported on 2.2% of returns)
21555:
$1,688
Maryland:
$2,968
Total itemized deductions: $14,926 (24% of AGI, reported on 24.0% of returns)
Here:
$14,926
State:
$22,960
Here:
23.6% of AGI
State:
23.3% of AGI
(% of AGI for various income ranges: 4.4% for AGIs $10k-25k, 8.4% for AGIs $25k-50k, 13.5% for AGIs $50k-75k, 15.8% for AGIs $75k-100k, 12.3% for AGIs over 100k)
Charity contributions deductions: $2,014 (3% of AGI, reported on 19.9% of returns)
Here:
$2,014
State:
$4,031
Here:
3.0% of AGI
State:
3.9% of AGI
(% of AGI for various income ranges: 0.3% for AGIs $10k-25k, 0.8% for AGIs $25k-50k, 1.6% for AGIs $50k-75k, 2.4% for AGIs $75k-100k, 1.0% for AGIs over 100k)
Total tax: $3,728 (reported on 73.2% of returns)
21555:
$3,728
State:
$10,167
(% of AGI for various income ranges: 1.6% for AGIs below $10k, 3.7% for AGIs $10k-25k, 6.3% for AGIs $25k-50k, 8.4% for AGIs $50k-75k, 10.0% for AGIs $75k-100k, 15.9% for AGIs over 100k)
Earned income credit: $1,583 (reported on 16.5% of returns)
Here:
$1,583
State:
$1,700
Percentage of individuals using paid preparers for their 2004 taxes: 62.6%
Here:
63%
State:
55%
(% for various income ranges: 54.2% for AGIs below $10k, 58.5% for AGIs $10k-25k, 68.2% for AGIs $25k-50k, 65.4% for AGIs $50k-75k, 76.2% for AGIs $75k-100k, 55.6% for AGIs over 100k)
Household received Food Stamps/SNAP in the past 12 months: 170 Household did not receive Food Stamps/SNAP in the past 12 months: 543
Women who did not have a birth in the past 12 months: 212 (153 now married, 59 unmarried)
Housing units in zip code 21555 with a mortgage: 387 (33 second mortgage, 22 both second mortgage and home equity loan) Median monthly owner costs for units with a mortgage: $1,009 Median monthly owner costs for units without a mortgage: $354
Residents with income below the poverty level in 2022:
This zip code:
17.4%
Whole state:
9.6%
Residents with income below 50% of the poverty level in 2022:
This zip code:
9.6%
Whole state:
4.7%
Median number of rooms in houses and condos:
Here:
6.7
State:
7.3
Median number of rooms in apartments:
Here:
5.4
State:
4.2
Notable locations in this zip code not listed on our city pages
Notable locations in zip code 21555: Town Creek Aqueduct Campground (A), Pursalne Run Campground (B), Oldtown-Battie Mixon Picnic Area (C), Pigmans Ferry Campground (D), Oldtown Volunteer Fire Department Incorporated (E). Display/hide their locations on the map
Churches in zip code 21555 include: Oldtown Baptist Church (A), Mount Olive Church (B), Old Mount Tabor Church (C), Olivers Grove Church (D), Paradise Church (E), Sulphur Springs United Methodist Church (F). Display/hide their locations on the map
Cemeteries: Roby Cemetery (1), Sulphur Springs Cemetery (2), Veterans of Foreign Wars Burial Park (3), Oldtown United Methodist Cemetery (4), Oldtown Catholic Cemetery (5), Wesleyan Memorial Park (6), Fifty-Four Cemetery (7). Display/hide their locations on the map
Streams, rivers, and creeks: Big Run (A), Brice Hollow Run (B), South Branch Potomac River (C), North Branch Potomac River (D), Mill Run (E), Collier Run (F), Maple Run (G), Peters Run (H), Sawpit Run (I). Display/hide their locations on the map
In group quarters: 3 (-1 institutionalized population)
Size of family households: 364 2-persons, 97 3-persons, 86 4-persons, 12 7-or-more-persons
Size of nonfamily households: 127 1-person, 7 2-persons, 11 3-persons
296 married couples with children.
29 single-parent households (5 men, 24 women).
98.9% of residents of 21555 zip code speak English at home.
Foreign born population: 1 (0.1%) (0.0% of them are naturalized citizens)
:
0.1%
Whole state:
16.7%
51%German
24%American
10%English
5%Irish
3%Scottish
2%British
2%Italian
Facilities with environmental interests located in this zip code:
OLDTOWN HIGH SCHOOL (4 MAIN STREET in OLDTOWN, MD)
AIR MINOR (AIRS/AFS) STATE MASTER (Maryland Air Emissions Database) - AIR MINOR Business SIC classification: ELEMENTARY AND SECONDARY SCHOOLS
OLDTOWN WWTP (19301 OPESSA STREET SOUTHEAST in OLDTOWN, MD)
STATE MASTER (Maryland Permits tracking) - NPDES NON-MAJOR National Pollutant Discharge Elimination System NON-MAJOR (Tracking pollutant discharge elimination systems) - permit Business SIC classification: SEWERAGE SYSTEMS Alternative names: ALLEGANY CO. SANT. COMMISSION
OLDTOWN MAINTENANCE YARD (GREENSPRINGS RD & RT 51 in OLDTOWN, MD) . Federal Facility. DEPARTMENT OF INTERIOR
Small Quantity Generators, between 100 kg and 1000 kg of hazardous waste/month (Resource Conservation and Recovery Act (tracking hazardous waste)) - notification Organizations: U S DEPT OF INTERIOR C+O CANAL (CONTACT/OWNER)
Housing units lacking complete plumbing facilities: 7.0% Housing units lacking complete kitchen facilities: 4.5%
53.7%Electricity
21.9%Fuel oil, kerosene, etc.
20.4%Wood
1.6%Bottled, tank, or LP gas
1.5%Utility gas
1.2%Other fuel
Population in 1990: 2,079.
Place of birth for U.S.-born residents:
This state: 1,031
Northeast: 171
Midwest: 87
South: 186
West: 24
72% of the 21555 zip code residents lived in the same house 5 years ago. Out of people who lived in different houses, 59% lived in this county. Out of people who lived in different counties, 50% lived in Maryland.
96% of the 21555 zip code residents lived in the same house 1 year ago. Out of people who lived in different houses, 43% moved from this county. Out of people who lived in different houses, 47% moved from different county within same state. Out of people who lived in different houses, 18% moved from different state.
Private vs. public school enrollment:
Students in private schools in grades 1 to 8 (elementary and middle school): 62
Here:
28.9%
Maryland:
15.2%
Students in private schools in grades 9 to 12 (high school): 14
Here:
40.3%
Maryland:
14.4%
Occupation by median earnings in the past 12 months ($)
65,927Material moving occupations
56,175Management occupations
39,118Transportation occupations
34,699Production occupations
32,871Installation, maintenance, and repair occupations
27,557Office and administrative support occupations
Top industries in this zip code by the number of employees in 2005:
Health Care and Social Assistance: Other Residential Care Facilities (20-49 employees: 1 establishment)
Other Services (except Public Administration): Civic and Social Organizations (5-9: 1)
Construction: Painting and Wall Covering Contractors (1-4: 1)
Administrative and Support and Waste Management and Remediation Services: Landscaping Services (1-4: 1)
Accommodation and Food Services: Full-Service Restaurants (1-4: 1)
Information: Cable and Other Program Distribution (1-4: 1)
Other Services (except Public Administration): Religious Organizations (1-4: 1)
People in group quarters in 2010:
3 people in group homes intended for adults
People in group quarters in 2000:
80 people in training schools for juvenile delinquents
Fatal accident statistics in 2012:
Fatal accident count: 2
Vehicles involved in fatal accidents: 3
Fatal accidents caused by drunken drivers: 1
Fatalities: 2
Persons involved in fatal accidents: 3
Pedestrians involved in fatal accidents: 0
Home Mortgage Disclosure Act Aggregated Statistics For Year 2009 (Based on 4 partial tracts)
A) FHA, FSA/RHS & VA Home Purchase Loans
B) Conventional Home Purchase Loans
C) Refinancings
D) Home Improvement Loans
F) Non-occupant Loans on < 5 Family Dwellings (A B C & D)
G) Loans On Manufactured Home Dwelling (A B C & D)
Number
Average Value
Number
Average Value
Number
Average Value
Number
Average Value
Number
Average Value
Number
Average Value
LOANS ORIGINATED
11
$139,767
14
$186,354
99
$146,328
19
$47,878
7
$142,567
7
$121,343
APPLICATIONS APPROVED, NOT ACCEPTED
1
$247,500
0
$0
10
$151,792
0
$0
1
$414,690
0
$0
APPLICATIONS DENIED
1
$216,890
2
$96,555
39
$142,417
4
$41,215
3
$107,597
2
$99,475
APPLICATIONS WITHDRAWN
1
$131,790
1
$126,300
30
$144,945
3
$37,817
4
$168,580
2
$133,725
FILES CLOSED FOR INCOMPLETENESS
0
$0
0
$0
3
$131,690
1
$97,930
0
$0
1
$96,100
Aggregated Statistics For Year 2008 (Based on 4 partial tracts)
A) FHA, FSA/RHS & VA Home Purchase Loans
B) Conventional Home Purchase Loans
C) Refinancings
D) Home Improvement Loans
F) Non-occupant Loans on < 5 Family Dwellings (A B C & D)
G) Loans On Manufactured Home Dwelling (A B C & D)
Number
Average Value
Number
Average Value
Number
Average Value
Number
Average Value
Number
Average Value
Number
Average Value
LOANS ORIGINATED
8
$107,748
26
$166,710
91
$129,972
22
$54,510
5
$84,492
12
$111,426
APPLICATIONS APPROVED, NOT ACCEPTED
1
$140,370
1
$178,200
12
$157,148
0
$0
1
$77,790
1
$125,260
APPLICATIONS DENIED
1
$158,330
6
$146,620
56
$165,938
15
$57,835
6
$44,830
5
$112,386
APPLICATIONS WITHDRAWN
1
$177,550
5
$201,416
25
$172,309
4
$253,685
1
$133,550
0
$0
FILES CLOSED FOR INCOMPLETENESS
1
$139,110
1
$380,000
8
$183,011
0
$0
2
$229,715
1
$146,430
Aggregated Statistics For Year 2007 (Based on 4 partial tracts)
A) FHA, FSA/RHS & VA Home Purchase Loans
B) Conventional Home Purchase Loans
C) Refinancings
D) Home Improvement Loans
F) Non-occupant Loans on < 5 Family Dwellings (A B C & D)
G) Loans On Manufactured Home Dwelling (A B C & D)
Number
Average Value
Number
Average Value
Number
Average Value
Number
Average Value
Number
Average Value
Number
Average Value
LOANS ORIGINATED
3
$143,550
35
$153,917
102
$117,894
29
$55,457
7
$153,833
12
$80,424
APPLICATIONS APPROVED, NOT ACCEPTED
0
$0
6
$190,038
20
$124,752
3
$59,863
3
$115,040
2
$56,285
APPLICATIONS DENIED
1
$62,230
8
$102,455
104
$136,362
20
$59,177
3
$94,327
15
$97,292
APPLICATIONS WITHDRAWN
1
$202,660
4
$186,370
52
$125,066
5
$107,430
1
$72,140
3
$79,023
FILES CLOSED FOR INCOMPLETENESS
0
$0
0
$0
14
$157,593
0
$0
0
$0
0
$0
Aggregated Statistics For Year 2006 (Based on 4 partial tracts)
A) FHA, FSA/RHS & VA Home Purchase Loans
B) Conventional Home Purchase Loans
C) Refinancings
D) Home Improvement Loans
F) Non-occupant Loans on < 5 Family Dwellings (A B C & D)
G) Loans On Manufactured Home Dwelling (A B C & D)
Number
Average Value
Number
Average Value
Number
Average Value
Number
Average Value
Number
Average Value
Number
Average Value
LOANS ORIGINATED
3
$119,670
50
$125,657
106
$102,214
29
$48,326
12
$115,371
12
$79,352
APPLICATIONS APPROVED, NOT ACCEPTED
1
$120,810
8
$71,566
17
$93,449
4
$79,392
3
$67,717
1
$108,160
APPLICATIONS DENIED
0
$0
19
$83,885
96
$123,798
18
$39,897
5
$56,352
4
$77,495
APPLICATIONS WITHDRAWN
1
$123,550
8
$93,465
65
$111,022
7
$58,900
1
$95,180
1
$177,650
FILES CLOSED FOR INCOMPLETENESS
1
$154,670
2
$92,895
14
$125,969
1
$53,670
1
$50,340
0
$0
Aggregated Statistics For Year 2005 (Based on 4 partial tracts)
A) FHA, FSA/RHS & VA Home Purchase Loans
B) Conventional Home Purchase Loans
C) Refinancings
D) Home Improvement Loans
F) Non-occupant Loans on < 5 Family Dwellings (A B C & D)
G) Loans On Manufactured Home Dwelling (A B C & D)
Number
Average Value
Number
Average Value
Number
Average Value
Number
Average Value
Number
Average Value
Number
Average Value
LOANS ORIGINATED
2
$94,125
35
$113,719
92
$110,895
31
$41,157
6
$100,580
6
$80,340
APPLICATIONS APPROVED, NOT ACCEPTED
0
$0
7
$192,777
24
$92,652
3
$7,623
1
$71,300
1
$36,600
APPLICATIONS DENIED
0
$0
12
$57,752
103
$118,266
16
$33,661
2
$64,520
8
$43,885
APPLICATIONS WITHDRAWN
0
$0
11
$91,663
86
$113,272
9
$130,166
5
$95,210
4
$48,048
FILES CLOSED FOR INCOMPLETENESS
0
$0
2
$138,665
9
$146,982
1
$33,520
0
$0
0
$0
Aggregated Statistics For Year 2004 (Based on 4 partial tracts)
A) FHA, FSA/RHS & VA Home Purchase Loans
B) Conventional Home Purchase Loans
C) Refinancings
D) Home Improvement Loans
F) Non-occupant Loans on < 5 Family Dwellings (A B C & D)
G) Loans On Manufactured Home Dwelling (A B C & D)
Number
Average Value
Number
Average Value
Number
Average Value
Number
Average Value
Number
Average Value
Number
Average Value
LOANS ORIGINATED
1
$97,480
40
$102,118
111
$90,675
20
$32,149
9
$79,454
8
$73,544
APPLICATIONS APPROVED, NOT ACCEPTED
0
$0
5
$49,420
21
$95,880
2
$14,185
1
$161,080
2
$60,690
APPLICATIONS DENIED
1
$32,030
11
$65,757
94
$99,955
22
$33,355
7
$61,187
10
$69,185
APPLICATIONS WITHDRAWN
2
$81,910
3
$103,743
80
$98,582
5
$59,264
3
$81,330
1
$82,910
FILES CLOSED FOR INCOMPLETENESS
0
$0
1
$44,840
11
$111,666
1
$34,770
0
$0
0
$0
Aggregated Statistics For Year 2003 (Based on 4 partial tracts)
A) FHA, FSA/RHS & VA Home Purchase Loans
B) Conventional Home Purchase Loans
C) Refinancings
D) Home Improvement Loans
F) Non-occupant Loans on < 5 Family Dwellings (A B C & D)
Number
Average Value
Number
Average Value
Number
Average Value
Number
Average Value
Number
Average Value
LOANS ORIGINATED
5
$70,778
44
$101,163
158
$90,027
15
$16,289
11
$74,816
APPLICATIONS APPROVED, NOT ACCEPTED
0
$0
5
$64,418
46
$94,677
2
$44,190
3
$72,607
APPLICATIONS DENIED
0
$0
9
$61,739
108
$96,006
4
$28,535
2
$70,300
APPLICATIONS WITHDRAWN
0
$0
5
$110,704
77
$107,090
0
$0
2
$113,510
FILES CLOSED FOR INCOMPLETENESS
0
$0
1
$49,420
19
$105,707
1
$32,660
0
$0
Aggregated Statistics For Year 2002 (Based on 2 partial tracts)
A) FHA, FSA/RHS & VA Home Purchase Loans
B) Conventional Home Purchase Loans
C) Refinancings
D) Home Improvement Loans
F) Non-occupant Loans on < 5 Family Dwellings (A B C & D)
Number
Average Value
Number
Average Value
Number
Average Value
Number
Average Value
Number
Average Value
LOANS ORIGINATED
2
$87,400
24
$104,104
62
$90,959
14
$17,127
5
$101,770
APPLICATIONS APPROVED, NOT ACCEPTED
0
$0
2
$53,540
12
$110,205
4
$6,408
2
$84,655
APPLICATIONS DENIED
0
$0
15
$40,452
57
$83,476
10
$20,684
4
$66,352
APPLICATIONS WITHDRAWN
0
$0
2
$30,200
39
$96,260
1
$3,660
1
$37,520
FILES CLOSED FOR INCOMPLETENESS
0
$0
0
$0
3
$94,570
0
$0
0
$0
Aggregated Statistics For Year 2001 (Based on 2 partial tracts)
A) FHA, FSA/RHS & VA Home Purchase Loans
B) Conventional Home Purchase Loans
C) Refinancings
D) Home Improvement Loans
F) Non-occupant Loans on < 5 Family Dwellings (A B C & D)
Number
Average Value
Number
Average Value
Number
Average Value
Number
Average Value
Number
Average Value
LOANS ORIGINATED
3
$71,080
18
$85,317
67
$77,341
10
$18,670
5
$81,452
APPLICATIONS APPROVED, NOT ACCEPTED
0
$0
2
$42,555
14
$75,177
1
$10,070
1
$138,200
APPLICATIONS DENIED
1
$83,280
5
$30,750
41
$66,631
7
$23,273
0
$0
APPLICATIONS WITHDRAWN
0
$0
2
$59,490
38
$104,020
4
$19,220
0
$0
FILES CLOSED FOR INCOMPLETENESS
0
$0
1
$103,420
5
$77,426
0
$0
0
$0
Aggregated Statistics For Year 2000 (Based on 2 partial tracts)
A) FHA, FSA/RHS & VA Home Purchase Loans
B) Conventional Home Purchase Loans
C) Refinancings
D) Home Improvement Loans
F) Non-occupant Loans on < 5 Family Dwellings (A B C & D)
Number
Average Value
Number
Average Value
Number
Average Value
Number
Average Value
Number
Average Value
LOANS ORIGINATED
5
$69,556
36
$81,199
76
$68,748
16
$15,158
5
$66,260
APPLICATIONS APPROVED, NOT ACCEPTED
2
$106,620
8
$62,348
16
$81,052
3
$30,200
0
$0
APPLICATIONS DENIED
4
$98,842
38
$56,140
67
$79,172
12
$18,532
14
$39,026
APPLICATIONS WITHDRAWN
0
$0
5
$64,980
17
$69,394
2
$9,610
0
$0
FILES CLOSED FOR INCOMPLETENESS
0
$0
2
$105,250
10
$53,448
0
$0
1
$68,640
Aggregated Statistics For Year 1999 (Based on 2 partial tracts)
A) FHA, FSA/RHS & VA Home Purchase Loans
B) Conventional Home Purchase Loans
C) Refinancings
D) Home Improvement Loans
F) Non-occupant Loans on < 5 Family Dwellings (A B C & D)
Detailed PMIC statistics for the following Tracts:0001.00
, 0002.00
2002 - 2018 National Fire Incident Reporting System (NFIRS) incidents
According to the data from the years 2002 - 2018 the average number of fire incidents per year is 15. The highest number of fire incidents - 28 took place in 2010, and the least - 0 in 2007. The data has a decreasing trend.
When looking into fire subcategories, the most incidents belonged to: Outside Fires (51.0%), and Structure Fires (40.9%).
Fire incident types reported to NFIRS in Zip Code 21555

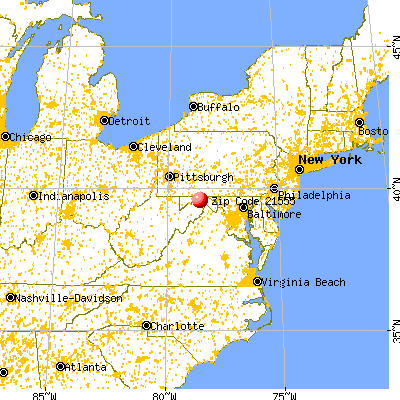


 Nearest zip codes: 25431, 21530, 26722, 25437, 25434, 25444.


 According to the data from the years 2002 - 2018 the average number of fire incidents per year is 15. The highest number of fire incidents - 28 took place in 2010, and the least - 0 in 2007. The data has a decreasing trend.
 When looking into fire subcategories, the most incidents belonged to: Outside Fires (51.0%), and Structure Fires (40.9%).