Estimated zip code population in 2022: 2,096 Zip code population in 2010: 2,819 Zip code population in 2000: 2,853
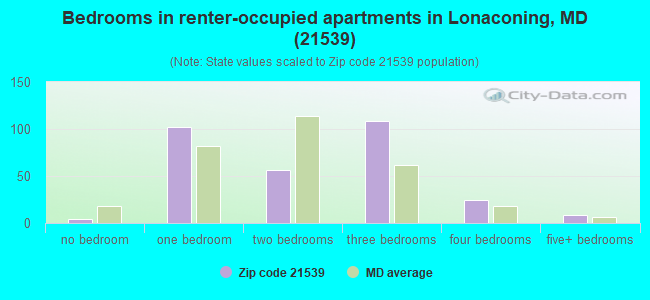
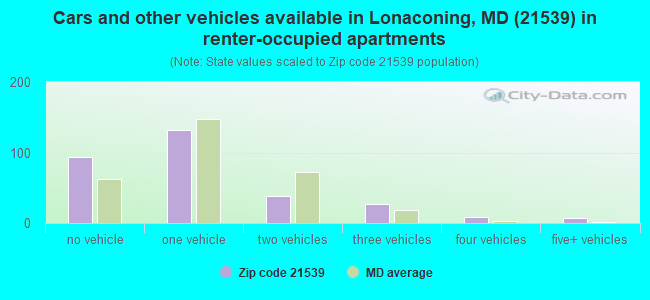
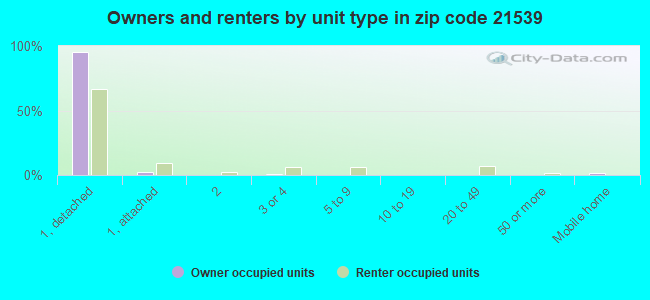
Houses and condos: 1,151 Renter-occupied apartments: 304
% of renters here:
35%
State:
32%
March 2022 cost of living index in zip code 21539: 74.6 (low, U.S. average is 100)
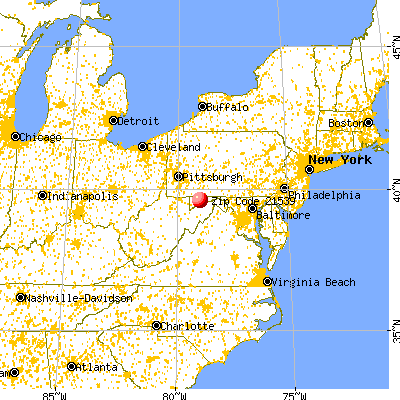
Land area: 34.7 sq. mi. Water area: 0.0 sq. mi.
Population density: 60 people per square mile
(very low).
OSM Map
General Map
Google Map
MSN Map
OSM Map
General Map
Google Map
MSN Map
OSM Map
General Map
Google Map
MSN Map
OSM Map
General Map
Google Map
MSN Map
Please wait while loading the map...
Real estate property taxes paid for housing units in 2022:
This zip code:
1.1% ($1,193)
Maryland:
0.9% ($3,777)
Median real estate property taxes paid for housing units with mortgages in 2022: $1,391 (1.1%) Median real estate property taxes paid for housing units with no mortgage in 2022: $1,088 (1.1%)
Business Search- 14 Million verified businesses
Males: 1,136
(54.2%)
Females: 959
(45.8%)
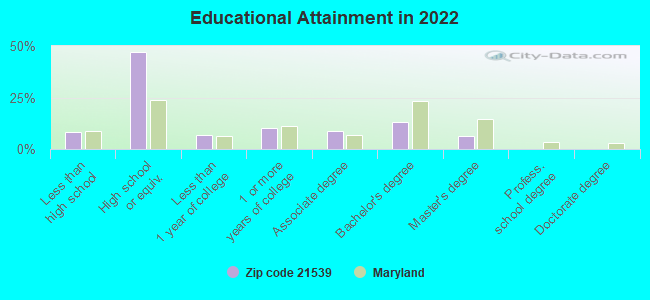
For population 25 years and over in 21539:
High school or higher: 90.9%
Bachelor's degree or higher: 19.1%
Graduate or professional degree: 6.3%
Unemployed: 5.4%
Mean travel time to work (commute): 21.1 minutes
For population 15 years and over in 21539:
Never married: 31.0%
Now married: 44.8%
Separated: 1.2%
Widowed: 14.5%
Divorced: 8.5%
Zip code 21539 compared to state average:
Median household income below state average.
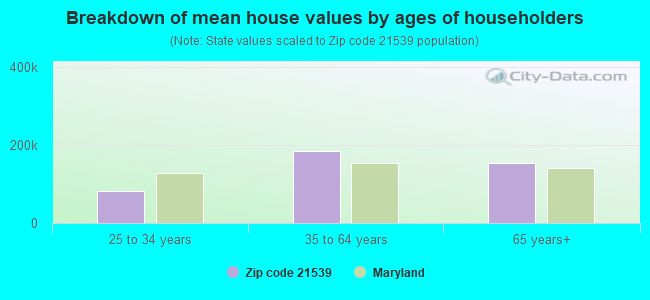
Median house value significantly below state average.
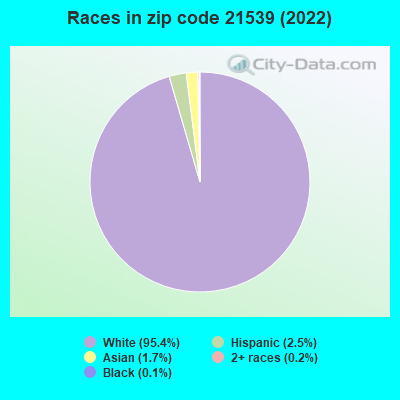
Black race population percentage significantly below state average.
Hispanic race population percentage significantly below state average.
Foreign-born population percentage significantly below state average.
Length of stay since moving in significantly above state average.
House age above state average.
Percentage of population with a bachelor's degree or higher significantly below state average.
Averages for the 2020 tax year for zip code 21539, filed in 2021:
Average Adjusted Gross Income (AGI) in 2020: $48,085 (Individual Income Tax Returns)
Here:
$48,085
State:
$86,905
Salary/wage: $42,125 (reported on 82.0% of returns)
Here:
$42,125
State:
$73,953
(% of AGI for various income ranges: 1081.0% for AGIs below $25k, 3366.3% for AGIs $25k-50k, 5824.2% for AGIs $50k-75k, 9717.1% for AGIs $75k-100k, 17444.3% for AGIs $100k-200k)
Taxable interest for individuals: $491 (reported on 28.8% of returns)
This zip code:
$491
Maryland:
$1,528
(% of AGI for various income ranges: 4.7% for AGIs below $25k, 10.0% for AGIs $25k-50k, 48.3% for AGIs $50k-75k, 25.7% for AGIs $75k-100k, 57.1% for AGIs $100k-200k)
Ordinary dividends: $3,020 (reported on 13.5% of returns)
Here:
$3,020
State:
$8,028
(% of AGI for various income ranges: 19.3% for AGIs below $25k, 18.5% for AGIs $25k-50k, 95.0% for AGIs $50k-75k, 330.0% for AGIs $100k-200k)
Net capital gain/loss in AGI: +$4,882 (reported on 9.9% of returns)
Here:
+$4,882
State:
+$25,238
(% of AGI for various income ranges: 11.0% for AGIs below $25k, 200.0% for AGIs $50k-75k, 377.1% for AGIs $100k-200k)
Profit/loss from business: +$7,925 (reported on 7.2% of returns)
Here:
+$7,925
State:
+$11,398
(% of AGI for various income ranges: 55.0% for AGIs below $25k, 85.6% for AGIs $25k-50k, 198.3% for AGIs $50k-75k)
Taxable individual retirement arrangement distribution: $17,910 (reported on 9.0% of returns)
21539:
$17,910
Maryland:
$20,944
(% of AGI for various income ranges: 83.0% for AGIs below $25k, 277.5% for AGIs $50k-75k, 1727.1% for AGIs $100k-200k)
Earned income credit: $2,238 (reported on 18.9% of returns)
Here:
$2,238
State:
$2,151
(% of AGI for various income ranges: 96.0% for AGIs below $25k, 67.4% for AGIs $25k-50k)
Percentage of individuals using paid preparers for their 2020 taxes: 95.5%
Here:
95%
State:
90%
(% for various income ranges: 95.0% for AGIs below $25k, 97.0% for AGIs $25k-50k, 93.3% for AGIs $50k-75k, 100.0% for AGIs $75k-100k, 92.3% for AGIs $100k-200k)
Averages for the 2012 tax year for zip code 21539, filed in 2013:
Average Adjusted Gross Income (AGI) in 2012: $39,737 (Individual Income Tax Returns)
Here:
$39,737
State:
$72,703
Salary/wage: $35,981 (reported on 84.3% of returns)
Here:
$35,981
State:
$62,228
(% of AGI for various income ranges: 70.0% for AGIs below $25k, 80.1% for AGIs $25k-50k, 79.6% for AGIs $50k-75k, 79.4% for AGIs $75k-100k, 69.5% for AGIs $100k-200k)
Taxable interest for individuals: $492 (reported on 33.9% of returns)
This zip code:
$492
Maryland:
$1,413
(% of AGI for various income ranges: 0.7% for AGIs below $25k, 0.6% for AGIs $25k-50k, 0.2% for AGIs $50k-75k, 0.5% for AGIs $75k-100k, 0.3% for AGIs $100k-200k)
Ordinary dividends: $1,478 (reported on 15.7% of returns)
Here:
$1,478
State:
$6,933
(% of AGI for various income ranges: 1.1% for AGIs below $25k, 0.3% for AGIs $25k-50k, 0.4% for AGIs $50k-75k, 0.9% for AGIs $75k-100k, 0.4% for AGIs $100k-200k)
Net capital gain/loss in AGI: +$200 (reported on 6.1% of returns)
Here:
+$200
State:
+$14,830
(% of AGI for various income ranges: 0.3% for AGIs below $25k)
Profit/loss from business: +$5,892 (reported on 10.4% of returns)
Here:
+$5,892
State:
+$12,606
(% of AGI for various income ranges: 5.1% for AGIs below $25k, 1.3% for AGIs $25k-50k, 2.0% for AGIs $50k-75k)
Taxable individual retirement arrangement distribution: $10,740 (reported on 8.7% of returns)
21539:
$10,740
Maryland:
$17,065
(% of AGI for various income ranges: 3.7% for AGIs below $25k, 1.6% for AGIs $50k-75k, 7.2% for AGIs $75k-100k)
Total itemized deductions: $16,360 (21% of AGI, reported on 17.4% of returns)
Here:
$16,360
State:
$27,886
Here:
21.1% of AGI
State:
22.8% of AGI
(% of AGI for various income ranges: 6.6% for AGIs $25k-50k, 6.8% for AGIs $50k-75k, 7.9% for AGIs $75k-100k, 13.0% for AGIs $100k-200k)
Charity contributions: $2,217 (reported on 10.4% of returns)
Here:
$2,217
State:
$4,452
(% of AGI for various income ranges: 0.7% for AGIs below $25k, 0.5% for AGIs $50k-75k, 0.5% for AGIs $75k-100k, 1.3% for AGIs $100k-200k)
Taxes paid: $6,580 (reported on 17.4% of returns)
21539:
$6,580
State:
$11,690
(% of AGI for various income ranges: 1.4% for AGIs $25k-50k, 2.5% for AGIs $50k-75k, 3.5% for AGIs $75k-100k, 6.6% for AGIs $100k-200k)
Earned income credit: $2,208 (reported on 20.9% of returns)
Here:
$2,208
State:
$2,199
(% of AGI for various income ranges: 5.8% for AGIs below $25k, 1.4% for AGIs $25k-50k)
Percentage of individuals using paid preparers for their 2012 taxes: 60.0%
Here:
60%
State:
52%
(% for various income ranges: 54.7% for AGIs below $25k, 63.0% for AGIs $25k-50k, 63.2% for AGIs $50k-75k, 70.0% for AGIs $75k-100k, 66.7% for AGIs $100k-200k)
Averages for the 2004 tax year for zip code 21539, filed in 2005:
Average Adjusted Gross Income (AGI) in 2004: $33,306 (Individual Income Tax Returns)
Here:
$33,306
State:
$60,339
Salary/wage: $31,718 (reported on 84.5% of returns)
Here:
$31,718
State:
$52,211
(% of AGI for various income ranges: 84.3% for AGIs below $10k, 70.7% for AGIs $10k-25k, 83.7% for AGIs $25k-50k, 86.9% for AGIs $50k-75k, 86.0% for AGIs $75k-100k, 62.9% for AGIs over 100k)
Taxable interest for individuals: $776 (reported on 44.0% of returns)
This zip code:
$776
Maryland:
$1,701
(% of AGI for various income ranges: 2.6% for AGIs below $10k, 2.0% for AGIs $10k-25k, 1.2% for AGIs $25k-50k, 0.7% for AGIs $50k-75k, 0.2% for AGIs $75k-100k, 0.7% for AGIs over 100k)
Taxable dividends: $1,145 (reported on 16.9% of returns)
Here:
$1,145
State:
$4,235
(% of AGI for various income ranges: 1.1% for AGIs below $10k, 0.9% for AGIs $10k-25k, 0.4% for AGIs $25k-50k, 0.8% for AGIs $50k-75k, 0.0% for AGIs $75k-100k, 0.8% for AGIs over 100k)
Net capital gain/loss: +$262 (reported on 9.4% of returns)
Here:
+$262
State:
+$15,888
(% of AGI for various income ranges: 1.3% for AGIs below $10k, -0.4% for AGIs $10k-25k, -0.1% for AGIs $25k-50k, 0.4% for AGIs $50k-75k, 0.2% for AGIs over 100k)
Profit/loss from business: +$6,176 (reported on 11.9% of returns)
Here:
+$6,176
State:
+$12,221
(% of AGI for various income ranges: 3.8% for AGIs below $10k, 4.3% for AGIs $10k-25k, 2.7% for AGIs $25k-50k, 1.1% for AGIs $50k-75k, 2.5% for AGIs $75k-100k)
IRA payment deduction: $2,543 (reported on 3.1% of returns)
21539:
$2,543
Maryland:
$2,968
Total itemized deductions: $15,276 (22% of AGI, reported on 17.5% of returns)
Here:
$15,276
State:
$22,960
Here:
22.4% of AGI
State:
23.3% of AGI
(% of AGI for various income ranges: 2.9% for AGIs $10k-25k, 5.9% for AGIs $25k-50k, 8.5% for AGIs $50k-75k, 13.9% for AGIs $75k-100k, 13.7% for AGIs over 100k)
Charity contributions deductions: $2,417 (3% of AGI, reported on 14.7% of returns)
Here:
$2,417
State:
$4,031
Here:
3.5% of AGI
State:
3.9% of AGI
(% of AGI for various income ranges: 0.7% for AGIs $10k-25k, 0.9% for AGIs $25k-50k, 0.9% for AGIs $50k-75k, 1.6% for AGIs $75k-100k, 2.2% for AGIs over 100k)
Total tax: $3,695 (reported on 71.9% of returns)
21539:
$3,695
State:
$10,167
(% of AGI for various income ranges: 1.7% for AGIs below $10k, 3.9% for AGIs $10k-25k, 6.2% for AGIs $25k-50k, 8.3% for AGIs $50k-75k, 9.9% for AGIs $75k-100k, 16.5% for AGIs over 100k)
Earned income credit: $1,740 (reported on 17.6% of returns)
Here:
$1,740
State:
$1,700
Percentage of individuals using paid preparers for their 2004 taxes: 57.2%
Here:
57%
State:
55%
(% for various income ranges: 45.9% for AGIs below $10k, 56.6% for AGIs $10k-25k, 60.7% for AGIs $25k-50k, 63.4% for AGIs $50k-75k, 63.6% for AGIs $75k-100k, 65.6% for AGIs over 100k)
Household received Food Stamps/SNAP in the past 12 months: 234 Household did not receive Food Stamps/SNAP in the past 12 months: 663
Women who had a birth in the past 12 months: 14 (14 now married, 0 unmarried) Women who did not have a birth in the past 12 months: 389 (153 now married, 236 unmarried)
Housing units in zip code 21539 with a mortgage: 249 (9 second mortgage, 9 both second mortgage and home equity loan) Houses without a mortgage: 26
Median monthly owner costs for units with a mortgage: $1,092 Median monthly owner costs for units without a mortgage: $438
Residents with income below the poverty level in 2022:
This zip code:
18.4%
Whole state:
9.6%
Residents with income below 50% of the poverty level in 2022:
This zip code:
8.3%
Whole state:
4.7%
Median number of rooms in houses and condos:
Here:
6.7
State:
7.3
Median number of rooms in apartments:
Here:
4.4
State:
4.2
Notable locations in this zip code not listed on our city pages
Streams, rivers, and creeks: Blacklick Run (A), Bluelick Run (B), Elk Lick Run (C), Mudlick Run (D), Swamp Run (E), Little Savage River (F), Koontz Run (G), Jackson Run (H), Hill Run (I). Display/hide their locations on the map
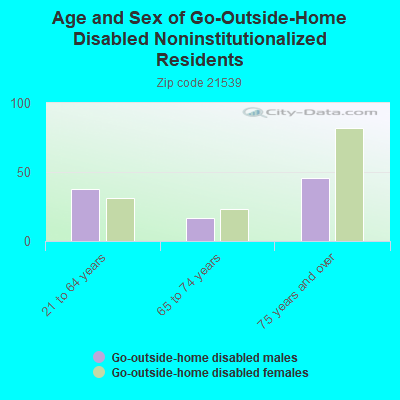
In group quarters: 54 (-1 institutionalized population)
Size of family households: 231 2-persons, 117 3-persons, 88 4-persons, 61 5-persons, 8 6-persons
Size of nonfamily households: 300 1-person, 68 2-persons, 10 5-persons
245 married couples with children.
132 single-parent households (35 men, 97 women).
96.8% of residents of 21539 zip code speak English at home.
0.1% of residents speak Spanish at home (100% well).
0.3% of residents speak other Indo-European language at home (57% very well, 43% well).
1.2% of residents speak Asian or Pacific Island language at home (42% very well, 58% well).
0.7% of residents speak other language at home (100% very well).
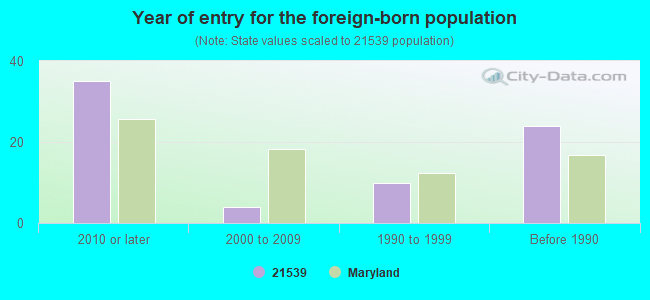
Foreign born population: 57 (2.7%) (33.5% of them are naturalized citizens)
This zip code:
2.7%
Whole state:
16.7%
26%Japan
25%Kuwait
9%Bhutan
5%Sweden
5%United Kingdom, excluding England and Scotland
4%Costa Rica
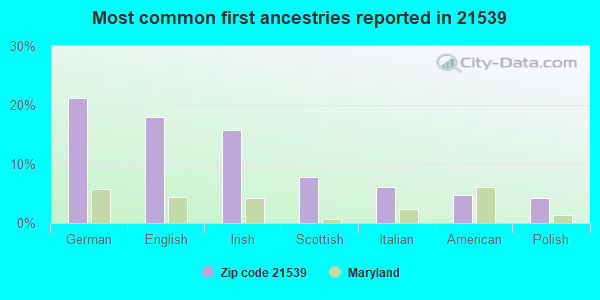
21%German
18%English
16%Irish
8%Scottish
6%Italian
5%American
4%Polish
Year of entry for the foreign-born population
352010 or later
42000 to 2009
101990 to 1999
24Before 1990
Facilities with environmental interests located in this zip code:
BUFFALO COAL COMPANY - #359 (1.5 MILES NORTHWEST OF LONACONING in LONACONING, MD)
STATE MASTER (Maryland Permits tracking) - National Pollutant Discharge Elimination System Permit National Pollutant Discharge Elimination System NON-MAJOR (Tracking pollutant discharge elimination systems) - permit Business SIC classification: BITUMINOUS COAL AND LIGNITE SURFACE MINING; COAL AND OTHER MINERALS AND ORES Alternative names: ', BUFFALO COAL COMPANY,INC., BUFFALO COAL COMPANY - # 326, BUFFALO COAL # 326
BUFFALO COAL COMPANY, INC. - LONACONING TIPPLE (ROUTE 135 NORTH in LONACONING, MD)
AIR MINOR (AIRS/AFS) STATE MASTER (Maryland Permits tracking) - National Pollutant Discharge Elimination System Permit National Pollutant Discharge Elimination System NON-MAJOR (Tracking pollutant discharge elimination systems) - permit National Pollutant Discharge Elimination System NON-MAJOR (Tracking pollutant discharge elimination systems) - permit TRI REPORTER (Tracking of toxic chemicals releasing facilities) Business SIC classification: BITUMINOUS COAL AND LIGNITE SURFACE MINING; BITUMINOUS COAL UNDERGROUND MINING; COAL AND OTHER MINERALS AND ORES Alternative names: BUFFALO COAL CO., BUFFALO COAL CO_TIPPLE MINE# 5, BUFFALO COAL CO., LONACONING MINE 5, LONACONING (MINE # 5), MINE #5
PINE MOUNTAIN COAL COMPANY (RED BIRD LANE in LONACONING, MD)
STATE MASTER (Maryland Permits tracking) - National Pollutant Discharge Elimination System Permit National Pollutant Discharge Elimination System NON-MAJOR (Tracking pollutant discharge elimination systems) - permit Business SIC classification: BITUMINOUS COAL AND LIGNITE SURFACE MINING; COAL AND OTHER MINERALS AND ORES Alternative names: PINE MOUNTAIN COAL (SM-95-424), WEIR-JONES MINE
BEECHWOOD MINE (2.0 MILES OF LONACONING,MD in LONACONING, MD)
National Pollutant Discharge Elimination System NON-MAJOR (Tracking pollutant discharge elimination systems) - permit Business SIC classification: BITUMINOUS COAL AND LIGNITE SURFACE MINING Alternative names: BUFFALO COAL COMPANY,INC.
CLISE COAL COMPANY,INC. (KOONTZ MINE in LONACONING, MD)
National Pollutant Discharge Elimination System NON-MAJOR (Tracking pollutant discharge elimination systems) - permit Business SIC classification: COAL AND OTHER MINERALS AND ORES Alternative names: CLISE COAL COMPANY,INC___/SE.
PAUL'S AUTO BODY (BOX 98 AVOLTON ROAD in LONACONING, MD)
AIR MINOR (AIRS/AFS) Business SIC classification: TOP, BODY, AND UPHOLSTERY REPAIR SHOPS AND PAINT SHOPS
LONACONING AUTO BODY (RT 36 N BOX 33-B in LONACONING, MD)
Small Quantity Generators, between 100 kg and 1000 kg of hazardous waste/month (Resource Conservation and Recovery Act (tracking hazardous waste)) - notification Organizations: OPERNAME (CONTACT/OPERATOR)
, BITTINGER, DWIGHT (CONTACT/OWNER)
Alternative names: LANACONING AUTO BODY
Housing units lacking complete plumbing facilities: 5.1% Housing units lacking complete kitchen facilities: 6.3%
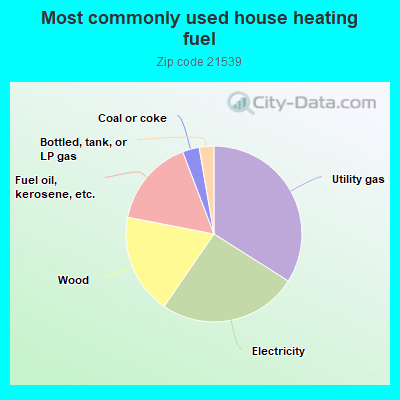
34.1%Utility gas
25.7%Electricity
18.5%Wood
16.2%Fuel oil, kerosene, etc.
3.1%Coal or coke
2.7%Bottled, tank, or LP gas
Population in 1990: 3,494.
Place of birth for U.S.-born residents:
This state: 1,488
Northeast: 188
Midwest: 76
South: 246
West: 9
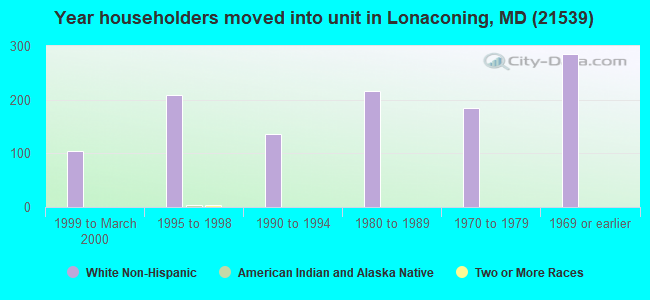
74% of the 21539 zip code residents lived in the same house 5 years ago. Out of people who lived in different houses, 60% lived in this county. Out of people who lived in different counties, 50% lived in Maryland.
97% of the 21539 zip code residents lived in the same house 1 year ago. Out of people who lived in different houses, 103% moved from this county. Out of people who lived in different houses, 5% moved from different county within same state. Out of people who lived in different houses, 8% moved from different state.
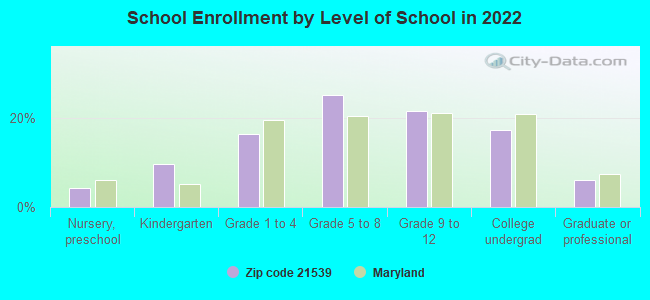
Private vs. public school enrollment:
Students in private schools in grades 1 to 8 (elementary and middle school):
Here:
0.0%
Maryland:
15.2%
Students in private schools in grades 9 to 12 (high school): 6
Here:
5.9%
Maryland:
14.4%
Students in private undergraduate colleges:
Here:
0.0%
Maryland:
20.2%
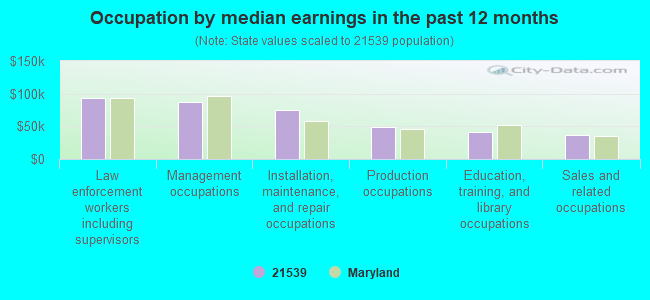
Occupation by median earnings in the past 12 months ($)
93,021Law enforcement workers including supervisors
87,851Management occupations
74,260Installation, maintenance, and repair occupations
49,409Production occupations
41,002Education, training, and library occupations
37,309Sales and related occupations
Top industries in this zip code by the number of employees in 2005:
Health Care and Social Assistance: Nursing Care Facilities (50-99 employees: 1 establishment)
Health Care and Social Assistance: Offices of Physical, Occupational and Speech Therapists, and Audiologists (20-49: 1)
Health Care and Social Assistance: Services for the Elderly and Persons with Disabilities (10-19: 1, 1-4: 1)
Other Services (except Public Administration): Religious Organizations (5-9: 1, 1-4: 4)
Accommodation and Food Services: Limited-Service Restaurants (10-19: 1)
Health Care and Social Assistance: Child Day Care Services (5-9: 1, 1-4: 1)
People in group quarters in 2010:
64 people in nursing facilities/skilled-nursing facilities
28 people in correctional facilities intended for juveniles
People in group quarters in 2000:
64 people in nursing homes
Home Mortgage Disclosure Act Aggregated Statistics For Year 2009 (Based on 2 partial tracts)
A) FHA, FSA/RHS & VA Home Purchase Loans
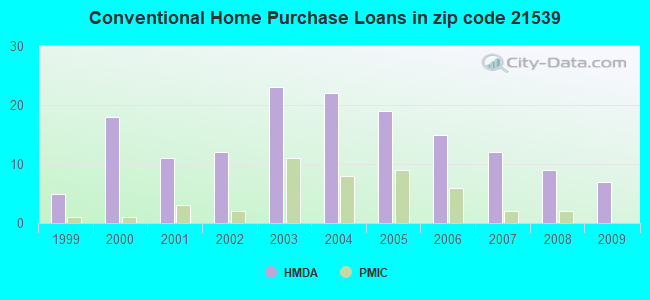
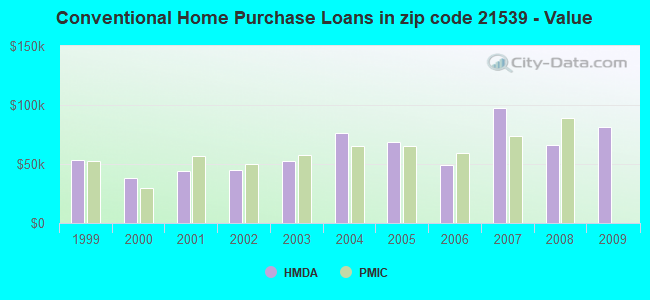
B) Conventional Home Purchase Loans
C) Refinancings
D) Home Improvement Loans
F) Non-occupant Loans on < 5 Family Dwellings (A B C & D)
G) Loans On Manufactured Home Dwelling (A B C & D)
Number
Average Value
Number
Average Value
Number
Average Value
Number
Average Value
Number
Average Value
Number
Average Value
LOANS ORIGINATED
10
$76,431
7
$81,431
29
$74,713
15
$46,220
2
$38,955
1
$113,410
APPLICATIONS APPROVED, NOT ACCEPTED
0
$0
0
$0
2
$107,990
1
$6,900
0
$0
0
$0
APPLICATIONS DENIED
2
$67,555
0
$0
15
$105,523
0
$0
0
$0
0
$0
APPLICATIONS WITHDRAWN
0
$0
1
$39,450
21
$87,725
0
$0
1
$56,210
0
$0
FILES CLOSED FOR INCOMPLETENESS
0
$0
0
$0
2
$100,590
0
$0
0
$0
0
$0
Aggregated Statistics For Year 2008 (Based on 2 partial tracts)
A) FHA, FSA/RHS & VA Home Purchase Loans
B) Conventional Home Purchase Loans
C) Refinancings
D) Home Improvement Loans
F) Non-occupant Loans on < 5 Family Dwellings (A B C & D)
G) Loans On Manufactured Home Dwelling (A B C & D)
Number
Average Value
Number
Average Value
Number
Average Value
Number
Average Value
Number
Average Value
Number
Average Value
LOANS ORIGINATED
14
$75,092
9
$66,294
27
$85,288
14
$24,303
0
$0
4
$75,445
APPLICATIONS APPROVED, NOT ACCEPTED
0
$0
0
$0
5
$120,710
1
$49,310
0
$0
0
$0
APPLICATIONS DENIED
3
$64,760
1
$79,880
32
$106,047
9
$48,981
3
$44,380
2
$64,105
APPLICATIONS WITHDRAWN
0
$0
2
$79,390
5
$68,048
1
$92,700
0
$0
0
$0
FILES CLOSED FOR INCOMPLETENESS
1
$140,040
0
$0
1
$161,740
0
$0
0
$0
1
$140,040
Aggregated Statistics For Year 2007 (Based on 2 partial tracts)
A) FHA, FSA/RHS & VA Home Purchase Loans
B) Conventional Home Purchase Loans
C) Refinancings
D) Home Improvement Loans
F) Non-occupant Loans on < 5 Family Dwellings (A B C & D)
G) Loans On Manufactured Home Dwelling (A B C & D)
Number
Average Value
Number
Average Value
Number
Average Value
Number
Average Value
Number
Average Value
Number
Average Value
LOANS ORIGINATED
3
$87,443
12
$97,222
24
$89,210
21
$31,981
5
$37,278
3
$82,183
APPLICATIONS APPROVED, NOT ACCEPTED
0
$0
0
$0
6
$66,075
2
$27,120
0
$0
0
$0
APPLICATIONS DENIED
0
$0
6
$81,690
39
$85,951
12
$42,571
3
$49,967
2
$106,510
APPLICATIONS WITHDRAWN
0
$0
2
$82,840
19
$76,820
0
$0
0
$0
1
$98,620
FILES CLOSED FOR INCOMPLETENESS
0
$0
2
$493,100
2
$92,210
0
$0
0
$0
0
$0
Aggregated Statistics For Year 2006 (Based on 2 partial tracts)
A) FHA, FSA/RHS & VA Home Purchase Loans
B) Conventional Home Purchase Loans
C) Refinancings
D) Home Improvement Loans
F) Non-occupant Loans on < 5 Family Dwellings (A B C & D)
G) Loans On Manufactured Home Dwelling (A B C & D)
Number
Average Value
Number
Average Value
Number
Average Value
Number
Average Value
Number
Average Value
Number
Average Value
LOANS ORIGINATED
4
$75,198
15
$48,915
34
$84,639
21
$27,567
4
$20,462
2
$85,305
APPLICATIONS APPROVED, NOT ACCEPTED
0
$0
1
$132,150
4
$116,618
0
$0
0
$0
0
$0
APPLICATIONS DENIED
1
$80,870
4
$38,708
37
$72,952
12
$35,010
2
$47,340
1
$37,480
APPLICATIONS WITHDRAWN
0
$0
3
$49,967
30
$94,544
5
$89,350
0
$0
1
$63,120
FILES CLOSED FOR INCOMPLETENESS
0
$0
0
$0
2
$68,540
2
$60,160
0
$0
0
$0
Aggregated Statistics For Year 2005 (Based on 2 partial tracts)
A) FHA, FSA/RHS & VA Home Purchase Loans
B) Conventional Home Purchase Loans
C) Refinancings
D) Home Improvement Loans
F) Non-occupant Loans on < 5 Family Dwellings (A B C & D)
G) Loans On Manufactured Home Dwelling (A B C & D)
Number
Average Value
Number
Average Value
Number
Average Value
Number
Average Value
Number
Average Value
Number
Average Value
LOANS ORIGINATED
5
$70,414
19
$68,930
30
$84,189
20
$27,811
5
$105,918
0
$0
APPLICATIONS APPROVED, NOT ACCEPTED
0
$0
3
$28,930
9
$105,633
0
$0
0
$0
1
$33,530
APPLICATIONS DENIED
5
$83,038
2
$73,965
51
$73,578
12
$14,464
2
$32,545
3
$51,283
APPLICATIONS WITHDRAWN
0
$0
1
$59,170
42
$89,885
5
$71,400
1
$59,170
0
$0
FILES CLOSED FOR INCOMPLETENESS
0
$0
0
$0
5
$96,648
1
$69,030
0
$0
0
$0
Aggregated Statistics For Year 2004 (Based on 2 partial tracts)
A) FHA, FSA/RHS & VA Home Purchase Loans
B) Conventional Home Purchase Loans
C) Refinancings
D) Home Improvement Loans
E) Loans on Dwellings For 5+ Families
F) Non-occupant Loans on < 5 Family Dwellings (A B C & D)
G) Loans On Manufactured Home Dwelling (A B C & D)
Number
Average Value
Number
Average Value
Number
Average Value
Number
Average Value
Number
Average Value
Number
Average Value
Number
Average Value
LOANS ORIGINATED
3
$47,667
22
$76,385
34
$71,354
13
$7,889
2
$51,280
4
$62,622
6
$56,048
APPLICATIONS APPROVED, NOT ACCEPTED
0
$0
1
$73,970
4
$95,415
1
$39,450
0
$0
1
$70,020
0
$0
APPLICATIONS DENIED
2
$59,170
9
$64,760
47
$76,840
11
$21,965
0
$0
2
$14,795
3
$77,910
APPLICATIONS WITHDRAWN
0
$0
1
$54,240
36
$82,567
5
$31,362
0
$0
0
$0
1
$55,230
FILES CLOSED FOR INCOMPLETENESS
0
$0
0
$0
7
$93,407
0
$0
0
$0
1
$71,010
0
$0
Aggregated Statistics For Year 2003 (Based on 2 partial tracts)
A) FHA, FSA/RHS & VA Home Purchase Loans
B) Conventional Home Purchase Loans
C) Refinancings
D) Home Improvement Loans
F) Non-occupant Loans on < 5 Family Dwellings (A B C & D)
Number
Average Value
Number
Average Value
Number
Average Value
Number
Average Value
Number
Average Value
LOANS ORIGINATED
5
$74,754
23
$52,483
63
$63,054
7
$6,340
5
$38,660
APPLICATIONS APPROVED, NOT ACCEPTED
0
$0
1
$3,940
13
$82,613
1
$27,610
0
$0
APPLICATIONS DENIED
0
$0
6
$35,175
40
$70,094
3
$3,943
3
$44,050
APPLICATIONS WITHDRAWN
0
$0
1
$194,280
19
$100,904
1
$9,860
0
$0
FILES CLOSED FOR INCOMPLETENESS
0
$0
0
$0
3
$70,350
0
$0
0
$0
Aggregated Statistics For Year 2002 (Based on 2 partial tracts)
A) FHA, FSA/RHS & VA Home Purchase Loans
B) Conventional Home Purchase Loans
C) Refinancings
D) Home Improvement Loans
F) Non-occupant Loans on < 5 Family Dwellings (A B C & D)
Number
Average Value
Number
Average Value
Number
Average Value
Number
Average Value
Number
Average Value
LOANS ORIGINATED
3
$48,980
12
$45,118
43
$59,585
26
$20,369
6
$33,202
APPLICATIONS APPROVED, NOT ACCEPTED
0
$0
1
$13,810
6
$51,118
1
$26,630
1
$13,810
APPLICATIONS DENIED
0
$0
5
$21,302
40
$52,096
11
$11,117
2
$22,685
APPLICATIONS WITHDRAWN
1
$29,590
0
$0
31
$65,566
2
$19,725
1
$41,420
FILES CLOSED FOR INCOMPLETENESS
0
$0
1
$64,100
5
$39,842
0
$0
0
$0
Aggregated Statistics For Year 2001 (Based on 2 partial tracts)
A) FHA, FSA/RHS & VA Home Purchase Loans
B) Conventional Home Purchase Loans
C) Refinancings
D) Home Improvement Loans
F) Non-occupant Loans on < 5 Family Dwellings (A B C & D)
Number
Average Value
Number
Average Value
Number
Average Value
Number
Average Value
Number
Average Value
LOANS ORIGINATED
4
$55,228
11
$44,020
28
$50,825
13
$14,035
4
$19,970
APPLICATIONS APPROVED, NOT ACCEPTED
0
$0
1
$45,370
3
$44,380
1
$12,820
0
$0
APPLICATIONS DENIED
0
$0
7
$42,829
25
$52,939
9
$15,560
2
$26,625
APPLICATIONS WITHDRAWN
0
$0
0
$0
30
$63,215
2
$13,315
0
$0
FILES CLOSED FOR INCOMPLETENESS
0
$0
0
$0
2
$80,375
0
$0
0
$0
Aggregated Statistics For Year 2000 (Based on 2 partial tracts)
A) FHA, FSA/RHS & VA Home Purchase Loans
B) Conventional Home Purchase Loans
C) Refinancings
D) Home Improvement Loans
F) Non-occupant Loans on < 5 Family Dwellings (A B C & D)
Number
Average Value
Number
Average Value
Number
Average Value
Number
Average Value
Number
Average Value
LOANS ORIGINATED
3
$47,667
18
$38,462
25
$36,095
15
$11,440
6
$19,395
APPLICATIONS APPROVED, NOT ACCEPTED
0
$0
3
$92,373
2
$30,570
1
$9,860
2
$35,505
APPLICATIONS DENIED
0
$0
8
$48,570
16
$41,174
16
$6,780
5
$28,206
APPLICATIONS WITHDRAWN
0
$0
0
$0
15
$49,967
2
$12,330
0
$0
FILES CLOSED FOR INCOMPLETENESS
0
$0
0
$0
0
$0
1
$9,860
0
$0
Aggregated Statistics For Year 1999 (Based on 1 partial tract)
A) FHA, FSA/RHS & VA Home Purchase Loans
B) Conventional Home Purchase Loans
C) Refinancings
D) Home Improvement Loans
F) Non-occupant Loans on < 5 Family Dwellings (A B C & D)
Detailed PMIC statistics for the following Tracts:0021.00
2002 - 2018 National Fire Incident Reporting System (NFIRS) incidents
According to the data from the years 2002 - 2018 the average number of fire incidents per year is 22. The highest number of fires - 44 took place in 2009, and the least - 5 in 2007. The data has a rising trend.
When looking into fire subcategories, the most reports belonged to: Structure Fires (70.5%), and Outside Fires (16.5%).
Fire incident types reported to NFIRS in Zip Code 21539


 Nearest zip codes: 21542, 21557, 21521, 21562, 21532, 21543.


 According to the data from the years 2002 - 2018 the average number of fire incidents per year is 22. The highest number of fires - 44 took place in 2009, and the least - 5 in 2007. The data has a rising trend.
 When looking into fire subcategories, the most reports belonged to: Structure Fires (70.5%), and Outside Fires (16.5%).