Estimated zip code population in 2022: 840 Zip code population in 2010: 906 Zip code population in 2000: 598
Houses and condos: 340 Renter-occupied apartments: 17
% of renters here:
5%
State:
32%
March 2022 cost of living index in zip code 20896: 180.1 (very high, U.S. average is 100)
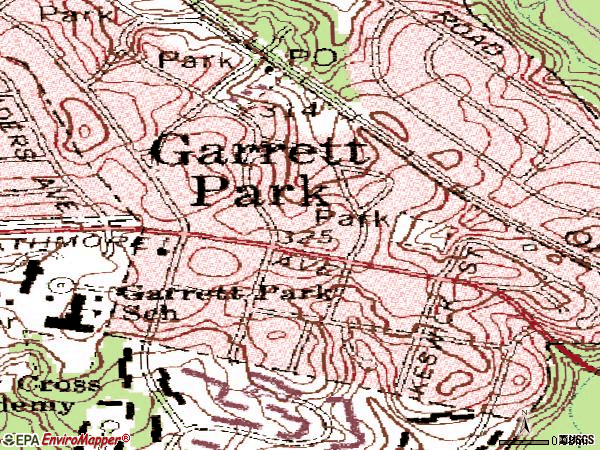
Land area: 0.2 sq. mi. Water area: 0.0 sq. mi.
Population density: 3,394 people per square mile
(average).
OSM Map
General Map
Google Map
MSN Map
OSM Map
General Map
Google Map
MSN Map
OSM Map
General Map
Google Map
MSN Map
OSM Map
General Map
Google Map
MSN Map
Please wait while loading the map...
Real estate property taxes paid for housing units in 2022:
This zip code:
1.0% ($9,051)
Maryland:
0.9% ($3,777)
Median real estate property taxes paid for housing units with mortgages in 2022: $8,807 (0.9%) Median real estate property taxes paid for housing units with no mortgage in 2022: $9,750 (1.0%)
Business Search- 14 Million verified businesses
Males: 422
(50.2%)
Females: 418
(49.8%)
For population 25 years and over in 20896:
High school or higher: 102.8%
Bachelor's degree or higher: 92.1%
Graduate or professional degree: 62.8%
Unemployed: 2.6%
Mean travel time to work (commute): 27.9 minutes
For population 15 years and over in 20896:
Never married: 26.2%
Now married: 59.5%
Separated: 1.6%
Widowed: 6.5%
Divorced: 6.2%
Zip code 20896 compared to state average:
Median household income significantly above state average.
Median house value significantly above state average.
Black race population percentage significantly below state average.
Median age significantly above state average.
Foreign-born population percentage below state average.
Renting percentage significantly below state average.
Length of stay since moving in above state average.
Number of rooms per house above state average.
House age above state average.
Percentage of population with a bachelor's degree or higher above state average.
Estimated median house/condo value in 2022: $951,360
20896:
$951,360
Maryland:
$398,100
Median resident age:
This zip code:
54.0 years
Maryland median age:
39.7 years
Average household size:
This zip code:
2.5 people
Maryland:
2.5 people
Averages for the 2004 tax year for zip code 20896, filed in 2005:
Average Adjusted Gross Income (AGI) in 2004: $120,301 (Individual Income Tax Returns)
Here:
$120,301
State:
$60,339
Salary/wage: $96,061 (reported on 71.0% of returns)
Here:
$96,061
State:
$52,211
(% of AGI for various income ranges: 92.7% for AGIs below $10k, 48.6% for AGIs $10k-25k, 51.9% for AGIs $25k-50k, 47.9% for AGIs $50k-75k, 59.4% for AGIs $75k-100k, 57.1% for AGIs over 100k)
Taxable interest for individuals: $2,528 (reported on 78.2% of returns)
This zip code:
$2,528
Maryland:
$1,701
(% of AGI for various income ranges: 5.0% for AGIs below $10k, 7.7% for AGIs $10k-25k, 1.7% for AGIs $25k-50k, 2.1% for AGIs $50k-75k, 1.1% for AGIs $75k-100k, 1.5% for AGIs over 100k)
Taxable dividends: $5,994 (reported on 64.9% of returns)
Here:
$5,994
State:
$4,235
(% of AGI for various income ranges: 29.2% for AGIs below $10k, 7.0% for AGIs $10k-25k, 3.8% for AGIs $25k-50k, 4.2% for AGIs $50k-75k, 2.2% for AGIs $75k-100k, 3.1% for AGIs over 100k)
Net capital gain/loss: +$12,494 (reported on 53.7% of returns)
Here:
+$12,494
State:
+$15,888
(% of AGI for various income ranges: -16.9% for AGIs below $10k, 2.3% for AGIs $10k-25k, -0.3% for AGIs $25k-50k, 0.5% for AGIs $50k-75k, 2.1% for AGIs $75k-100k, 6.6% for AGIs over 100k)
Profit/loss from business: +$32,226 (reported on 23.9% of returns)
Here:
+$32,226
State:
+$12,221
(% of AGI for various income ranges: 6.8% for AGIs $10k-25k, 4.2% for AGIs $25k-50k, 4.1% for AGIs $75k-100k, 7.1% for AGIs over 100k)
IRA payment deduction: $3,625 (reported on 3.3% of returns)
20896:
$3,625
Maryland:
$2,968
Self-employed pension: $21,763 (reported on 7.9% of returns)
Here:
$21,763
Maryland:
$17,155
Total itemized deductions: $33,674 (19% of AGI, reported on 64.9% of returns)
Here:
$33,674
State:
$22,960
Here:
19.4% of AGI
State:
23.3% of AGI
(% of AGI for various income ranges: 24.9% for AGIs $10k-25k, 20.1% for AGIs $25k-50k, 21.8% for AGIs $50k-75k, 21.7% for AGIs $75k-100k, 17.6% for AGIs over 100k)
Charity contributions deductions: $4,973 (3% of AGI, reported on 62.0% of returns)
Here:
$4,973
State:
$4,031
Here:
2.8% of AGI
State:
3.9% of AGI
(% of AGI for various income ranges: 3.0% for AGIs $10k-25k, 1.8% for AGIs $25k-50k, 3.8% for AGIs $50k-75k, 3.6% for AGIs $75k-100k, 2.4% for AGIs over 100k)
Total tax: $25,924 (reported on 86.9% of returns)
20896:
$25,924
State:
$10,167
(% of AGI for various income ranges: 5.0% for AGIs below $10k, 6.9% for AGIs $10k-25k, 8.6% for AGIs $25k-50k, 10.3% for AGIs $50k-75k, 12.6% for AGIs $75k-100k, 20.5% for AGIs over 100k)
Percentage of individuals using paid preparers for their 2004 taxes: 51.7%
Here:
52%
State:
55%
(% for various income ranges: 36.1% for AGIs below $10k, 46.9% for AGIs $10k-25k, 48.3% for AGIs $25k-50k, 51.1% for AGIs $50k-75k, 51.1% for AGIs $75k-100k, 60.5% for AGIs over 100k)
Household received Food Stamps/SNAP in the past 12 months: 0 Household did not receive Food Stamps/SNAP in the past 12 months: 327
Women who had a birth in the past 12 months: 12 (12 now married, 0 unmarried) Women who did not have a birth in the past 12 months: 98 (50 now married, 47 unmarried)
Housing units in zip code 20896 with a mortgage: 218 (19 second mortgage, 20 both second mortgage and home equity loan) Houses without a mortgage: 20
Median monthly owner costs for units with a mortgage: $3,737 Median monthly owner costs for units without a mortgage: $1,325
Residents with income below the poverty level in 2022:
This zip code:
2.0%
Whole state:
9.6%
Residents with income below 50% of the poverty level in 2022:
This zip code:
1.0%
Whole state:
4.7%
Median number of rooms in houses and condos:
Here:
8.3
State:
7.3
Median number of rooms in apartments:
Here:
6.1
State:
4.2
Notable locations in this zip code not listed on our city pages
In group quarters: 23 (-1 institutionalized population)
Size of family households: 125 2-persons, 64 3-persons, 55 4-persons, 2 5-persons, 2 6-persons
Size of nonfamily households: 55 1-person, 25 2-persons
117 married couples with children.
25 single-parent households (3 men, 22 women).
91.3% of residents of 20896 zip code speak English at home.
2.7% of residents speak Spanish at home (100% very well).
1.4% of residents speak other Indo-European language at home (82% very well, 18% not well).
3.3% of residents speak Asian or Pacific Island language at home (100% very well).
1.0% of residents speak other language at home (100% very well).
Foreign born population: 75 (9.0%) (86.0% of them are naturalized citizens)
This zip code:
9.0%
Whole state:
16.7%
17%Hong Kong
9%Sweden
9%Honduras
8%Norway
5%United Kingdom, excluding England and Scotland
5%Thailand
4%Germany
11%English
10%Czech
10%Irish
9%German
9%European
8%Eastern European
3%Russian
Year of entry for the foreign-born population
172010 or later
32000 to 2009
191990 to 1999
52Before 1990
Facilities with environmental interests located in this zip code:
ACADEMY OF THE HOLY CROSS (4900 STRATHMORE AVENUE in GARRETT PARK, MD)
AIR MINOR (AIRS/AFS) STATE MASTER (Maryland Air Emissions Database) - AIR MINOR COMPLIANCE ACTIVITY (Tracking inspections of insecticide, fungicide, and rodenticide, and toxic substances) Business SIC classification: ELEMENTARY AND SECONDARY SCHOOLS Alternative names: HOLY CROSS ELEMENTARY SCHOOL
Housing units lacking complete plumbing facilities: 1.4% Housing units lacking complete kitchen facilities: 1.6%
84.5%Utility gas
11.8%Electricity
3.7%Bottled, tank, or LP gas
0.6%Fuel oil, kerosene, etc.
Place of birth for U.S.-born residents:
This state: 169
Northeast: 160
Midwest: 91
South: 230
West: 85
74% of the 20896 zip code residents lived in the same house 5 years ago. Out of people who lived in different houses, 51% lived in this county. Out of people who lived in different counties, 50% lived in Maryland.
99% of the 20896 zip code residents lived in the same house 1 year ago. Out of people who lived in different houses, 100% moved from this county. Out of people who lived in different houses, 33% moved from different state.
Private vs. public school enrollment:
Students in private schools in grades 1 to 8 (elementary and middle school): 10
Here:
18.1%
Maryland:
15.2%
Students in private schools in grades 9 to 12 (high school): 1
Here:
4.9%
Maryland:
14.4%
Students in private undergraduate colleges: 10
Here:
23.9%
Maryland:
20.2%
Occupation by median earnings in the past 12 months ($)
171,866Management occupations
168,727Life, physical, and social science occupations
154,438Legal occupations
125,259Office and administrative support occupations
119,297Architecture and engineering occupations
102,534Health diagnosing and treating practitioners and other technical occupations
Companies with federal contracts located in this zip code:
RICHARD FISCHMAN (11407 ROKEBY AVE in GARRETT PARK, MD; small business) : $298,324 in 9 contractsfrom 2002 to 2006
Contracts for Personal Services Contracts by Departmental Offices Signed by year:2000: $0; 2001: $0; 2002: $171,000; 2003: $170,936; 2004: -$61,234; 2005: $23,397; 2006: -$5,775.
Biggest contracts:
$171,000 with Departmental Offices for Personal Services Contracts. Taking place in DC. Signed on 2002-11-15. Completion date: 2003-11-15.
$170,936, same as above.Signed on 2003-11-13. Completion date: 2004-11-13.
$23,397, same as above.Signed on 2005-09-13. Completion date: 2005-11-13.
$15,364, same as above.Signed on 2006-07-18. Completion date: 2006-11-13.
constantine Seferlis (4703 ALBERMARLE AVENUE in GARRETT PARK, MD; small business) : $248,110 in 5 contractsfrom 2001 to 2004
Contracts for Maintenance, Repair or Alteration of Real Property -- Museums and Exhibition Buildings, Maintenance, Repair or Alteration of Real Property -- Miscellaneous Buildings, Maintenance, Repair or Alteration of Real Property -- Other Non-Building Facilities by Smithsonian Institution, except units administered under separate Board of Trustees Signed by year:2000: $0; 2001: $149,030; 2002: $0; 2003: $50,000; 2004: $49,080; 2005: $0; 2006: $0.
Biggest contracts:
$50,030 with Smithsonian Institution, except units administered under separate Board of Trustees for Maintenance, Repair or Alteration of Real Property -- Museums and Exhibition Buildings. Taking place in DC. Signed on 2001-09-06. Completion date: 2001-09-30.
$50,000 with Smithsonian Institution, except units administered under separate Board of Trustees for Maintenance, Repair or Alteration of Real Property -- Miscellaneous Buildings. Taking place in DC. Signed on 2003-06-15. Completion date: 2003-12-15.
$50,000, same as above.Signed on 2001-09-15. Completion date: 2001-09-15.
$49,080 with Smithsonian Institution, except units administered under separate Board of Trustees for Maintenance, Repair or Alteration of Real Property -- Museums and Exhibition Buildings. Taking place in DC. Signed on 2004-06-08. Completion date: 2004-07-30.
DAILEY & O'BRIEN INC (10708 WEYMOUTH ST in GARRETT PARK, MD; small business) 2 employees, $0 revenue. Woman Owned Business: $156,000 in 5 contractsfrom 2000 to 2002
Contracts for Other Professional Services by National Institute of Standards and Technology Signed by year:2000: $116,000; 2001: $30,000; 2002: $10,000; 2003: $0; 2004: $0; 2005: $0; 2006: $0.
Biggest contracts:
$58,000 with National Institute of Standards and Technology for Other Professional Services. Signed on 2000-12-15. Completion date: 2001-09-15.
$58,000, same as above.Signed on 2000-12-15. Completion date: 2001-09-15.
$20,000, same as above.Signed on 2001-11-15. Completion date: 2002-04-15.
$10,000, same as above.Signed on 2002-08-15. Completion date: 2003-03-15.
Top industries in this zip code by the number of employees in 2005:
Accommodation and Food Services: Full-Service Restaurants (20-49 employees: 1 establishment)
Educational Services: Elementary and Secondary Schools (20-49: 1)
Educational Services: All Other Miscellaneous Schools and Instruction (5-9: 1)
Other Services (except Public Administration): Automotive Oil Change and Lubrication Shops (5-9: 1)
Professional, Scientific, and Technical Services: Title Abstract and Settlement Offices (5-9: 1)
Construction: New Single-Family Housing Construction (except Operative Builders) (1-4: 2)
Health Care and Social Assistance: Services for the Elderly and Persons with Disabilities (1-4: 1)
Information: Motion Picture and Video Production (1-4: 1)
Professional, Scientific, and Technical Services: Offices of Certified Public Accountants (1-4: 1)
Home Mortgage Disclosure Act Aggregated Statistics For Year 2009 (Based on 2 partial tracts)
A) FHA, FSA/RHS & VA Home Purchase Loans
B) Conventional Home Purchase Loans
C) Refinancings
D) Home Improvement Loans
F) Non-occupant Loans on < 5 Family Dwellings (A B C & D)
Number
Average Value
Number
Average Value
Number
Average Value
Number
Average Value
Number
Average Value
LOANS ORIGINATED
2
$594,675
7
$364,240
47
$366,159
1
$481,940
3
$291,017
APPLICATIONS APPROVED, NOT ACCEPTED
0
$0
0
$0
4
$312,388
0
$0
0
$0
APPLICATIONS DENIED
0
$0
0
$0
6
$379,828
0
$0
0
$0
APPLICATIONS WITHDRAWN
0
$0
0
$0
6
$422,393
0
$0
0
$0
FILES CLOSED FOR INCOMPLETENESS
0
$0
0
$0
2
$324,320
0
$0
0
$0
Aggregated Statistics For Year 2008 (Based on 2 partial tracts)
A) FHA, FSA/RHS & VA Home Purchase Loans
B) Conventional Home Purchase Loans
C) Refinancings
D) Home Improvement Loans
F) Non-occupant Loans on < 5 Family Dwellings (A B C & D)
Number
Average Value
Number
Average Value
Number
Average Value
Number
Average Value
Number
Average Value
LOANS ORIGINATED
3
$493,217
9
$292,994
17
$363,219
1
$180,590
2
$302,770
APPLICATIONS APPROVED, NOT ACCEPTED
0
$0
1
$242,220
3
$218,470
0
$0
0
$0
APPLICATIONS DENIED
1
$519,700
0
$0
3
$402,387
1
$198,400
0
$0
APPLICATIONS WITHDRAWN
0
$0
0
$0
2
$305,620
0
$0
0
$0
FILES CLOSED FOR INCOMPLETENESS
0
$0
0
$0
1
$307,400
0
$0
0
$0
Aggregated Statistics For Year 2007 (Based on 2 partial tracts)
B) Conventional Home Purchase Loans
C) Refinancings
D) Home Improvement Loans
F) Non-occupant Loans on < 5 Family Dwellings (A B C & D)
Number
Average Value
Number
Average Value
Number
Average Value
Number
Average Value
LOANS ORIGINATED
15
$357,482
13
$359,872
4
$179,970
1
$433,500
APPLICATIONS APPROVED, NOT ACCEPTED
2
$312,385
2
$293,865
0
$0
0
$0
APPLICATIONS DENIED
1
$433,500
5
$398,302
1
$414,970
0
$0
APPLICATIONS WITHDRAWN
2
$537,505
1
$468,760
2
$281,575
0
$0
FILES CLOSED FOR INCOMPLETENESS
0
$0
1
$365,820
0
$0
0
$0
Aggregated Statistics For Year 2006 (Based on 2 partial tracts)
B) Conventional Home Purchase Loans
C) Refinancings
D) Home Improvement Loans
F) Non-occupant Loans on < 5 Family Dwellings (A B C & D)
Number
Average Value
Number
Average Value
Number
Average Value
Number
Average Value
LOANS ORIGINATED
17
$368,290
15
$422,548
3
$221,557
1
$463,420
APPLICATIONS APPROVED, NOT ACCEPTED
0
$0
5
$310,678
1
$169,550
0
$0
APPLICATIONS DENIED
0
$0
5
$302,200
0
$0
0
$0
APPLICATIONS WITHDRAWN
1
$563,150
6
$364,868
0
$0
1
$71,240
FILES CLOSED FOR INCOMPLETENESS
0
$0
1
$160,290
0
$0
0
$0
Aggregated Statistics For Year 2005 (Based on 2 partial tracts)
B) Conventional Home Purchase Loans
C) Refinancings
D) Home Improvement Loans
F) Non-occupant Loans on < 5 Family Dwellings (A B C & D)
Number
Average Value
Number
Average Value
Number
Average Value
Number
Average Value
LOANS ORIGINATED
19
$362,631
25
$330,197
3
$150,673
2
$247,205
APPLICATIONS APPROVED, NOT ACCEPTED
1
$294,220
6
$208,495
1
$114,340
0
$0
APPLICATIONS DENIED
1
$506,160
2
$547,655
0
$0
0
$0
APPLICATIONS WITHDRAWN
1
$515,070
5
$280,828
1
$198,760
0
$0
FILES CLOSED FOR INCOMPLETENESS
0
$0
0
$0
0
$0
0
$0
Aggregated Statistics For Year 2004 (Based on 2 partial tracts)
B) Conventional Home Purchase Loans
C) Refinancings
D) Home Improvement Loans
F) Non-occupant Loans on < 5 Family Dwellings (A B C & D)
Number
Average Value
Number
Average Value
Number
Average Value
Number
Average Value
LOANS ORIGINATED
16
$366,597
32
$294,778
3
$161,833
4
$291,460
APPLICATIONS APPROVED, NOT ACCEPTED
2
$435,455
2
$263,765
0
$0
0
$0
APPLICATIONS DENIED
2
$310,070
4
$225,652
0
$0
0
$0
APPLICATIONS WITHDRAWN
3
$391,227
4
$238,475
0
$0
0
$0
FILES CLOSED FOR INCOMPLETENESS
0
$0
1
$56,640
0
$0
0
$0
Aggregated Statistics For Year 2003 (Based on 2 partial tracts)
B) Conventional Home Purchase Loans
C) Refinancings
D) Home Improvement Loans
F) Non-occupant Loans on < 5 Family Dwellings (A B C & D)
Number
Average Value
Number
Average Value
Number
Average Value
Number
Average Value
LOANS ORIGINATED
18
$240,712
94
$221,484
1
$84,060
4
$179,258
APPLICATIONS APPROVED, NOT ACCEPTED
0
$0
9
$242,810
1
$13,540
0
$0
APPLICATIONS DENIED
0
$0
7
$244,049
0
$0
0
$0
APPLICATIONS WITHDRAWN
2
$267,505
8
$257,043
0
$0
0
$0
FILES CLOSED FOR INCOMPLETENESS
0
$0
3
$301,107
0
$0
1
$121,110
Aggregated Statistics For Year 2002 (Based on 2 partial tracts)
B) Conventional Home Purchase Loans
C) Refinancings
D) Home Improvement Loans
F) Non-occupant Loans on < 5 Family Dwellings (A B C & D)
Number
Average Value
Number
Average Value
Number
Average Value
Number
Average Value
LOANS ORIGINATED
14
$227,205
76
$229,557
2
$37,755
4
$181,750
APPLICATIONS APPROVED, NOT ACCEPTED
0
$0
6
$244,710
1
$28,500
0
$0
APPLICATIONS DENIED
0
$0
5
$198,260
0
$0
0
$0
APPLICATIONS WITHDRAWN
1
$230,460
6
$282,585
0
$0
0
$0
FILES CLOSED FOR INCOMPLETENESS
0
$0
1
$343,730
0
$0
0
$0
Aggregated Statistics For Year 2001 (Based on 2 partial tracts)
B) Conventional Home Purchase Loans
C) Refinancings
D) Home Improvement Loans
F) Non-occupant Loans on < 5 Family Dwellings (A B C & D)
Number
Average Value
Number
Average Value
Number
Average Value
Number
Average Value
LOANS ORIGINATED
21
$223,456
41
$213,416
2
$57,170
4
$227,345
APPLICATIONS APPROVED, NOT ACCEPTED
1
$81,570
3
$113,627
1
$44,520
0
$0
APPLICATIONS DENIED
0
$0
3
$140,460
0
$0
0
$0
APPLICATIONS WITHDRAWN
2
$266,615
6
$199,650
0
$0
0
$0
FILES CLOSED FOR INCOMPLETENESS
0
$0
1
$241,860
0
$0
0
$0
Aggregated Statistics For Year 2000 (Based on 2 partial tracts)
B) Conventional Home Purchase Loans
C) Refinancings
D) Home Improvement Loans
Number
Average Value
Number
Average Value
Number
Average Value
LOANS ORIGINATED
18
$197,691
6
$175,368
4
$71,952
APPLICATIONS APPROVED, NOT ACCEPTED
1
$79,080
1
$200,900
1
$67,680
APPLICATIONS DENIED
1
$289,590
3
$188,430
0
$0
APPLICATIONS WITHDRAWN
1
$565,290
3
$107,217
1
$39,890
FILES CLOSED FOR INCOMPLETENESS
0
$0
0
$0
1
$17,810
Aggregated Statistics For Year 1999 (Based on 1 partial tract)


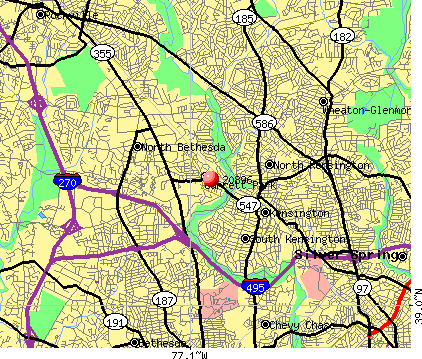 Nearest zip codes: 20895, 20814, 20852, 20851, 20815, 20902.