Estimated zip code population in 2022: 11,264 Zip code population in 2010: 10,622 Zip code population in 2000: 7,428
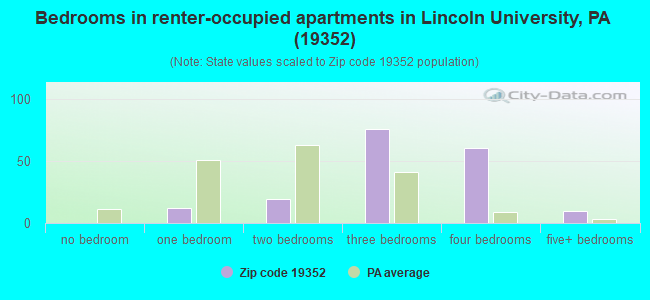
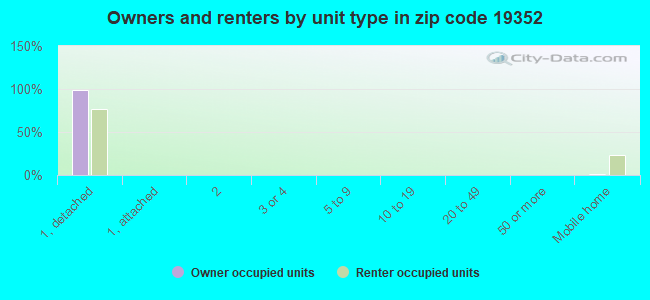
Houses and condos: 3,190 Renter-occupied apartments: 186
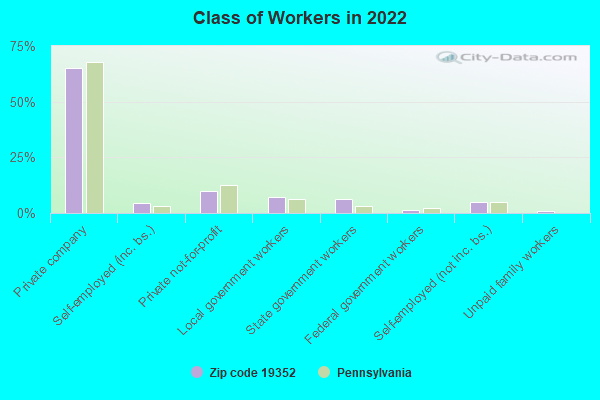
% of renters here:
6%
State:
31%
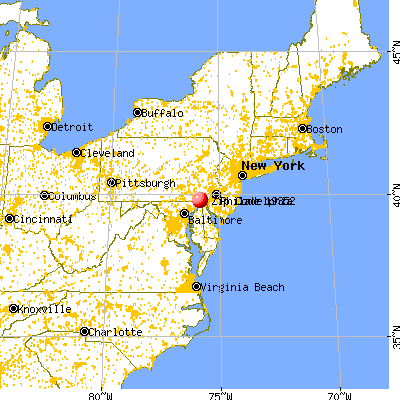
March 2022 cost of living index in zip code 19352: 103.9 (near average, U.S. average is 100)
Land area: 19.2 sq. mi. Water area: 0.1 sq. mi.
Population density: 587 people per square mile
(low).
OSM Map
General Map
Google Map
MSN Map
OSM Map
General Map
Google Map
MSN Map
OSM Map
General Map
Google Map
MSN Map
OSM Map
General Map
Google Map
MSN Map
Please wait while loading the map...
Real estate property taxes paid for housing units in 2022:
This zip code:
1.4% ($6,432)
Pennsylvania:
1.3% ($3,094)
Median real estate property taxes paid for housing units with mortgages in 2022: $6,595 (1.4%) Median real estate property taxes paid for housing units with no mortgage in 2022: $5,928 (1.4%)
Business Search- 14 Million verified businesses
Males: 5,386
(47.8%)
Females: 5,877
(52.2%)
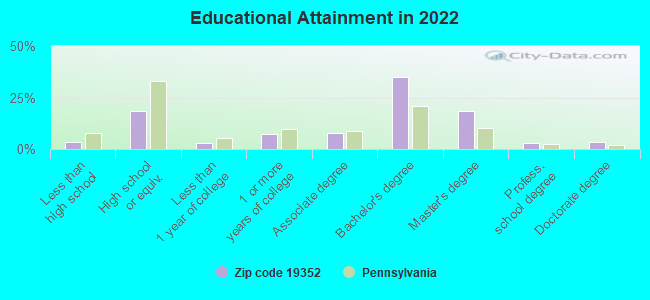
For population 25 years and over in 19352:
High school or higher: 97.7%
Bachelor's degree or higher: 61.0%
Graduate or professional degree: 25.5%
Unemployed: 3.1%
Mean travel time to work (commute): 30.9 minutes
For population 15 years and over in 19352:
Never married: 36.5%
Now married: 56.0%
Separated: 0.0%
Widowed: 2.5%
Divorced: 5.0%
Zip code 19352 compared to state average:
Median household income above state average.
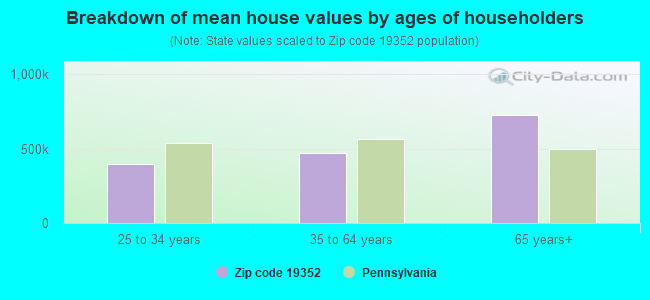
Median house value above state average.
Median age below state average.
Foreign-born population percentage below state average.
Renting percentage significantly below state average.
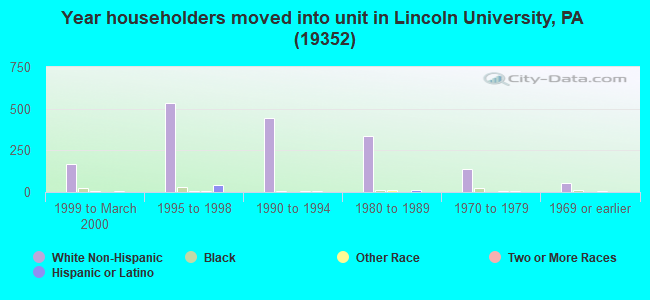
Length of stay since moving in above state average.
Estimated median house/condo value in 2022: $461,479
19352:
$461,479
Pennsylvania:
$245,500
According to our research of Pennsylvania and other state lists, there were 8 registered sex offenders living in 19352 zip code as of April 24, 2024. The ratio of all residents to sex offenders in zip code 19352 is 1,365 to 1. The ratio of registered sex offenders to all residents in this zip code is lower than the state average.
Median resident age:
This zip code:
33.1 years
Pennsylvania median age:
40.9 years
Average household size:
This zip code:
2.9 people
Pennsylvania:
2.4 people
Averages for the 2020 tax year for zip code 19352, filed in 2021:
Average Adjusted Gross Income (AGI) in 2020: $111,287 (Individual Income Tax Returns)
Here:
$111,287
State:
$75,707
Salary/wage: $99,746 (reported on 86.0% of returns)
Here:
$99,746
State:
$62,806
(% of AGI for various income ranges: 1172.6% for AGIs below $25k, 3717.5% for AGIs $25k-50k, 6576.2% for AGIs $50k-75k, 9570.0% for AGIs $75k-100k, 21361.4% for AGIs $100k-200k, 74252.7% for AGIs over 200k)
Taxable interest for individuals: $1,063 (reported on 41.4% of returns)
This zip code:
$1,063
Pennsylvania:
$1,633
(% of AGI for various income ranges: 19.8% for AGIs below $25k, 39.1% for AGIs $25k-50k, 41.0% for AGIs $50k-75k, 78.7% for AGIs $75k-100k, 83.1% for AGIs $100k-200k, 332.7% for AGIs over 200k)
Ordinary dividends: $4,793 (reported on 31.2% of returns)
Here:
$4,793
State:
$7,382
(% of AGI for various income ranges: 32.4% for AGIs below $25k, 48.2% for AGIs $25k-50k, 86.9% for AGIs $50k-75k, 227.8% for AGIs $75k-100k, 267.8% for AGIs $100k-200k, 1551.8% for AGIs over 200k)
Net capital gain/loss in AGI: +$12,886 (reported on 26.4% of returns)
Here:
+$12,886
State:
+$23,522
(% of AGI for various income ranges: 13.5% for AGIs below $25k, 54.1% for AGIs $25k-50k, 65.9% for AGIs $50k-75k, 178.3% for AGIs $75k-100k, 490.7% for AGIs $100k-200k, 4649.1% for AGIs over 200k)
Profit/loss from business: +$17,219 (reported on 15.3% of returns)
Here:
+$17,219
State:
+$16,274
(% of AGI for various income ranges: 90.6% for AGIs below $25k, 197.5% for AGIs $25k-50k, 374.1% for AGIs $50k-75k, 362.6% for AGIs $75k-100k, 548.0% for AGIs $100k-200k, 1938.6% for AGIs over 200k)
Taxable individual retirement arrangement distribution: $25,134 (reported on 9.2% of returns)
19352:
$25,134
Pennsylvania:
$18,583
(% of AGI for various income ranges: 58.5% for AGIs below $25k, 93.2% for AGIs $25k-50k, 316.2% for AGIs $50k-75k, 300.9% for AGIs $75k-100k, 573.6% for AGIs $100k-200k, 1720.5% for AGIs over 200k)
Self-employed (Keogh) retirement plans: $25,933 (reported on 0.7% of returns)
19352:
$25,933
Pennsylvania:
$25,407
(% of AGI for various income ranges: 131.9% for AGIs $100k-200k)
Total itemized deductions: $30,834 (reported on 14.0% of returns)
Here:
$30,834
State:
$34,850
(% of AGI for various income ranges: 224.5% for AGIs $25k-50k, 308.3% for AGIs $50k-75k, 596.5% for AGIs $75k-100k, 1261.2% for AGIs $100k-200k, 3267.7% for AGIs over 200k)
Charity contributions: $7,261 (reported on 11.9% of returns)
Here:
$7,261
State:
$12,392
(% of AGI for various income ranges: 14.1% for AGIs $25k-50k, 24.8% for AGIs $50k-75k, 76.1% for AGIs $75k-100k, 234.6% for AGIs $100k-200k, 847.7% for AGIs over 200k)
Taxes paid: $9,240 (reported on 14.0% of returns)
19352:
$9,240
State:
$8,200
(% of AGI for various income ranges: 64.5% for AGIs $25k-50k, 95.2% for AGIs $50k-75k, 193.9% for AGIs $75k-100k, 378.3% for AGIs $100k-200k, 964.1% for AGIs over 200k)
Earned income credit: $2,045 (reported on 4.8% of returns)
Here:
$2,045
State:
$2,100
(% of AGI for various income ranges: 33.9% for AGIs below $25k, 45.2% for AGIs $25k-50k)
Percentage of individuals using paid preparers for their 2020 taxes: 93.0%
Here:
93%
State:
92%
(% for various income ranges: 92.2% for AGIs below $25k, 93.5% for AGIs $25k-50k, 95.2% for AGIs $50k-75k, 91.4% for AGIs $75k-100k, 93.5% for AGIs $100k-200k, 92.2% for AGIs over 200k)
Averages for the 2012 tax year for zip code 19352, filed in 2013:
Average Adjusted Gross Income (AGI) in 2012: $96,266 (Individual Income Tax Returns)
Here:
$96,266
State:
$61,346
Salary/wage: $81,945 (reported on 90.1% of returns)
Here:
$81,945
State:
$51,902
(% of AGI for various income ranges: 79.8% for AGIs below $25k, 78.3% for AGIs $25k-50k, 75.6% for AGIs $50k-75k, 80.5% for AGIs $75k-100k, 88.4% for AGIs $100k-200k, 62.3% for AGIs over 200k)
Taxable interest for individuals: $786 (reported on 46.0% of returns)
This zip code:
$786
Pennsylvania:
$1,588
(% of AGI for various income ranges: 1.7% for AGIs below $25k, 0.7% for AGIs $25k-50k, 0.9% for AGIs $50k-75k, 0.3% for AGIs $75k-100k, 0.2% for AGIs $100k-200k, 0.4% for AGIs over 200k)
Ordinary dividends: $2,742 (reported on 30.8% of returns)
Here:
$2,742
State:
$5,827
(% of AGI for various income ranges: 1.6% for AGIs below $25k, 0.9% for AGIs $25k-50k, 1.1% for AGIs $50k-75k, 1.0% for AGIs $75k-100k, 0.6% for AGIs $100k-200k, 1.0% for AGIs over 200k)
Net capital gain/loss in AGI: +$10,543 (reported on 22.7% of returns)
Here:
+$10,543
State:
+$14,495
(% of AGI for various income ranges: 0.2% for AGIs $75k-100k, 0.5% for AGIs $100k-200k, 6.2% for AGIs over 200k)
Profit/loss from business: +$15,309 (reported on 14.4% of returns)
Here:
+$15,309
State:
+$16,268
(% of AGI for various income ranges: 5.9% for AGIs below $25k, 4.6% for AGIs $25k-50k, 3.1% for AGIs $50k-75k, 1.9% for AGIs $75k-100k, 1.8% for AGIs $100k-200k, 2.2% for AGIs over 200k)
Taxable individual retirement arrangement distribution: $15,375 (reported on 9.4% of returns)
19352:
$15,375
Pennsylvania:
$14,550
(% of AGI for various income ranges: 2.2% for AGIs below $25k, 1.9% for AGIs $25k-50k, 4.0% for AGIs $50k-75k, 2.3% for AGIs $75k-100k, 1.5% for AGIs $100k-200k, 0.8% for AGIs over 200k)
Self-employment retirement plans: $17,967 (reported on 0.8% of returns)
19352:
$17,967
Pennsylvania:
$20,922
(% of AGI for various income ranges: 0.4% for AGIs $100k-200k)
Total itemized deductions: $27,764 (18% of AGI, reported on 54.8% of returns)
Here:
$27,764
State:
$23,538
Here:
17.9% of AGI
State:
18.4% of AGI
(% of AGI for various income ranges: 11.2% for AGIs below $25k, 13.7% for AGIs $25k-50k, 20.2% for AGIs $50k-75k, 21.6% for AGIs $75k-100k, 18.4% for AGIs $100k-200k, 11.5% for AGIs over 200k)
Charity contributions: $3,093 (reported on 47.8% of returns)
Here:
$3,093
State:
$4,025
(% of AGI for various income ranges: 0.5% for AGIs below $25k, 1.0% for AGIs $25k-50k, 1.4% for AGIs $50k-75k, 1.8% for AGIs $75k-100k, 1.8% for AGIs $100k-200k, 1.4% for AGIs over 200k)
Taxes paid: $12,738 (reported on 54.6% of returns)
19352:
$12,738
State:
$9,982
(% of AGI for various income ranges: 3.2% for AGIs below $25k, 4.4% for AGIs $25k-50k, 7.8% for AGIs $50k-75k, 8.7% for AGIs $75k-100k, 8.5% for AGIs $100k-200k, 6.0% for AGIs over 200k)
Earned income credit: $1,983 (reported on 6.3% of returns)
Here:
$1,983
State:
$2,106
(% of AGI for various income ranges: 3.0% for AGIs below $25k, 0.8% for AGIs $25k-50k)
Percentage of individuals using paid preparers for their 2012 taxes: 52.2%
Here:
52%
State:
53%
(% for various income ranges: 42.6% for AGIs below $25k, 56.2% for AGIs $25k-50k, 61.8% for AGIs $50k-75k, 56.8% for AGIs $75k-100k, 53.7% for AGIs $100k-200k, 61.8% for AGIs over 200k)
Averages for the 2004 tax year for zip code 19352, filed in 2005:
Average Adjusted Gross Income (AGI) in 2004: $74,587 (Individual Income Tax Returns)
Here:
$74,587
State:
$48,049
Salary/wage: $69,743 (reported on 90.6% of returns)
Here:
$69,743
State:
$42,646
(% of AGI for various income ranges: 189.0% for AGIs below $10k, 74.7% for AGIs $10k-25k, 80.6% for AGIs $25k-50k, 84.3% for AGIs $50k-75k, 91.4% for AGIs $75k-100k, 82.8% for AGIs over 100k)
Taxable interest for individuals: $961 (reported on 58.9% of returns)
This zip code:
$961
Pennsylvania:
$1,657
(% of AGI for various income ranges: 7.4% for AGIs below $10k, 2.1% for AGIs $10k-25k, 1.3% for AGIs $25k-50k, 1.2% for AGIs $50k-75k, 0.5% for AGIs $75k-100k, 0.6% for AGIs over 100k)
Taxable dividends: $1,827 (reported on 35.6% of returns)
Here:
$1,827
State:
$3,566
(% of AGI for various income ranges: 9.6% for AGIs below $10k, 1.6% for AGIs $10k-25k, 1.0% for AGIs $25k-50k, 1.4% for AGIs $50k-75k, 0.7% for AGIs $75k-100k, 0.7% for AGIs over 100k)
Net capital gain/loss: +$5,543 (reported on 25.7% of returns)
Here:
+$5,543
State:
+$9,716
(% of AGI for various income ranges: -6.6% for AGIs below $10k, 0.4% for AGIs $10k-25k, 0.1% for AGIs $25k-50k, 0.9% for AGIs $50k-75k, 0.7% for AGIs $75k-100k, 2.8% for AGIs over 100k)
Profit/loss from business: +$18,312 (reported on 14.7% of returns)
Here:
+$18,312
State:
+$14,267
(% of AGI for various income ranges: 10.3% for AGIs below $10k, 4.5% for AGIs $10k-25k, 4.5% for AGIs $25k-50k, 3.1% for AGIs $50k-75k, 1.6% for AGIs $75k-100k, 4.1% for AGIs over 100k)
Profit/loss from farming: +$4,241 (reported on 0.9% of returns)
Here:
+$4,241
State:
+$274
IRA payment deduction: $2,783 (reported on 2.6% of returns)
19352:
$2,783
Pennsylvania:
$2,903
(% of AGI for various income ranges: 0.3% for AGIs $25k-50k, 0.1% for AGIs $50k-75k, 0.2% for AGIs $75k-100k, 0.1% for AGIs over 100k)
Self-employed pension: $13,125 (reported on 1.0% of returns)
Here:
$13,125
Pennsylvania:
$14,674
Total itemized deductions: $23,323 (21% of AGI, reported on 60.1% of returns)
Here:
$23,323
State:
$18,804
Here:
21.2% of AGI
State:
19.5% of AGI
(% of AGI for various income ranges: 13.0% for AGIs below $10k, 15.1% for AGIs $10k-25k, 21.2% for AGIs $25k-50k, 24.2% for AGIs $50k-75k, 23.1% for AGIs $75k-100k, 16.5% for AGIs over 100k)
Charity contributions deductions: $2,678 (2% of AGI, reported on 55.2% of returns)
Here:
$2,678
State:
$3,337
Here:
2.4% of AGI
State:
3.3% of AGI
(% of AGI for various income ranges: 0.9% for AGIs $10k-25k, 1.8% for AGIs $25k-50k, 2.2% for AGIs $50k-75k, 2.3% for AGIs $75k-100k, 1.9% for AGIs over 100k)
Total tax: $11,773 (reported on 80.8% of returns)
19352:
$11,773
State:
$8,008
(% of AGI for various income ranges: 5.1% for AGIs below $10k, 4.4% for AGIs $10k-25k, 6.1% for AGIs $25k-50k, 6.9% for AGIs $50k-75k, 8.1% for AGIs $75k-100k, 16.4% for AGIs over 100k)
Earned income credit: $1,621 (reported on 4.9% of returns)
Here:
$1,621
State:
$1,643
Percentage of individuals using paid preparers for their 2004 taxes: 54.2%
Here:
54%
State:
56%
(% for various income ranges: 39.7% for AGIs below $10k, 53.9% for AGIs $10k-25k, 59.0% for AGIs $25k-50k, 63.1% for AGIs $50k-75k, 58.4% for AGIs $75k-100k, 55.5% for AGIs over 100k)
Household received Food Stamps/SNAP in the past 12 months: 63 Household did not receive Food Stamps/SNAP in the past 12 months: 3,060
Women who had a birth in the past 12 months: 86 (79 now married, 10 unmarried) Women who did not have a birth in the past 12 months: 3,184 (1,148 now married, 2,040 unmarried)
Housing units in zip code 19352 with a mortgage: 2,224 (337 second mortgage, 327 both second mortgage and home equity loan) Houses without a mortgage: 182
Median monthly owner costs for units with a mortgage: $2,564 Median monthly owner costs for units without a mortgage: $956
Residents with income below the poverty level in 2022:
This zip code:
2.5%
Whole state:
11.8%
Residents with income below 50% of the poverty level in 2022:
This zip code:
2.3%
Whole state:
6.1%
Median number of rooms in houses and condos:
Here:
10.0
State:
6.8
Median number of rooms in apartments:
Here:
8.0
State:
4.3
Notable locations in this zip code not listed on our city pages
Notable locations in zip code 19352: Camp Saginaw (A), Amos Hall (B), Cannon House (C), Elliot Cresson Hall (D), Frederick Douglass Hall (E), Grim Hall (F), Guest House (G), Henry Howard Houston Hall (H), Isaac Norton and John Ballard Rendall Hall (I), Jehudi Ashmun Hall (J), John Miller Dickey Hall (K), Langston Hughes Memorial Library (L), Lorraine Hansberry Hall (M), Lucy Laney Hall (N), Manuel Rivero Hall (O), President's House - Lincoln University (P), Robert Baxter McRary Hall (Q), Thurgood Marshall Living Learning Center North (R), Thurgood Marshall Living Learning Center South (S), Vail Memorial Hall (T). Display/hide their locations on the map
Churches in zip code 19352 include: Mary Dod Brown Memorial Chapel (A), Hozannah Church (B), Penns Grove Church (C). Display/hide their locations on the map
In group quarters: 2,074 (-1 institutionalized population)
Size of family households: 1,218 2-persons, 498 3-persons, 624 4-persons, 330 5-persons, 112 6-persons, 42 7-or-more-persons
Size of nonfamily households: 214 1-person, 70 2-persons
2,036 married couples with children.
241 single-parent households (241 women).
92.6% of residents of 19352 zip code speak English at home.
3.6% of residents speak Spanish at home (74% very well, 6% well, 19% not well, 1% not at all).
2.1% of residents speak other Indo-European language at home (62% very well, 22% well, 15% not well).
0.4% of residents speak Asian or Pacific Island language at home (61% very well, 39% well).
0.2% of residents speak other language at home (85% very well, 15% not well).
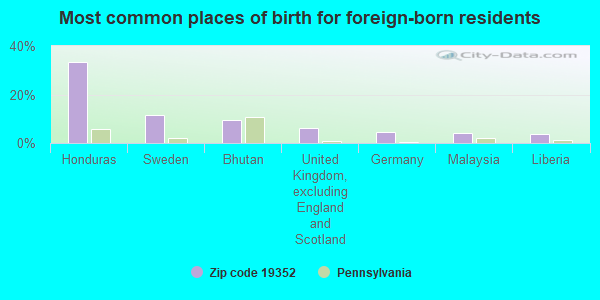
Foreign born population: 490 (4.4%) (50.3% of them are naturalized citizens)
This zip code:
4.4%
Whole state:
7.5%
33%Honduras
11%Sweden
9%Bhutan
6%United Kingdom, excluding England and Scotland
5%Germany
4%Malaysia
4%Liberia
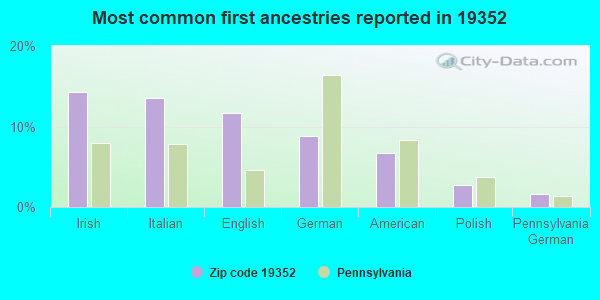
14%Irish
14%Italian
12%English
9%German
7%American
3%Polish
2%Pennsylvania German
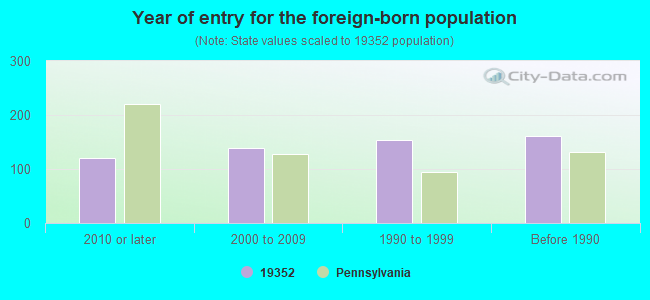
Year of entry for the foreign-born population
1212010 or later
1382000 to 2009
1541990 to 1999
161Before 1990
Housing units lacking complete plumbing facilities: 0.4% Housing units lacking complete kitchen facilities: 0.4%
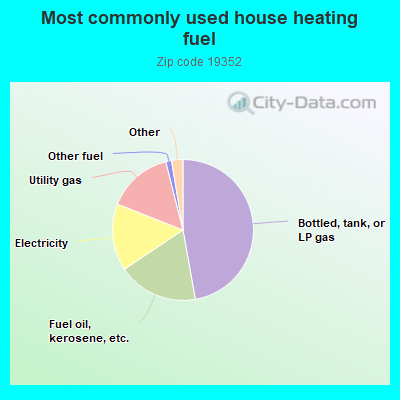
47.2%Bottled, tank, or LP gas
18.4%Fuel oil, kerosene, etc.
15.4%Electricity
15.1%Utility gas
1.3%Other fuel
0.8%Wood
0.8%Coal or coke
0.8%Solar energy
Population in 1990: 6,834. Population change in the 1990s: +594 (+8.7%).
Place of birth for U.S.-born residents:
This state: 5,725
Northeast: 1,267
Midwest: 621
South: 2,834
West: 304
54% of the 19352 zip code residents lived in the same house 5 years ago. Out of people who lived in different houses, 24% lived in this county. Out of people who lived in different counties, 50% lived in Pennsylvania.
93% of the 19352 zip code residents lived in the same house 1 year ago. Out of people who lived in different houses, 34% moved from this county. Out of people who lived in different houses, 42% moved from different county within same state. Out of people who lived in different houses, 25% moved from different state. Out of people who lived in different houses, 1% moved from abroad.
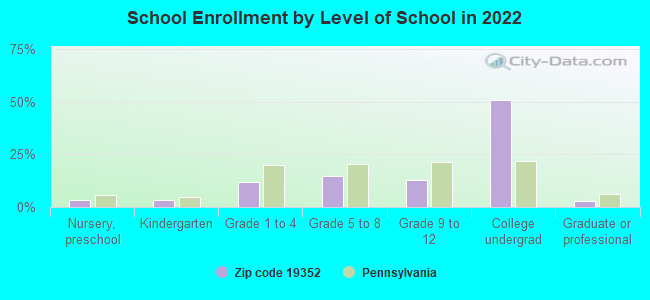
Private vs. public school enrollment:
Students in private schools in grades 1 to 8 (elementary and middle school): 170
Here:
14.1%
Pennsylvania:
15.7%
Students in private schools in grades 9 to 12 (high school): 63
Here:
10.9%
Pennsylvania:
13.4%
Students in private undergraduate colleges: 569
Here:
24.7%
Pennsylvania:
39.8%
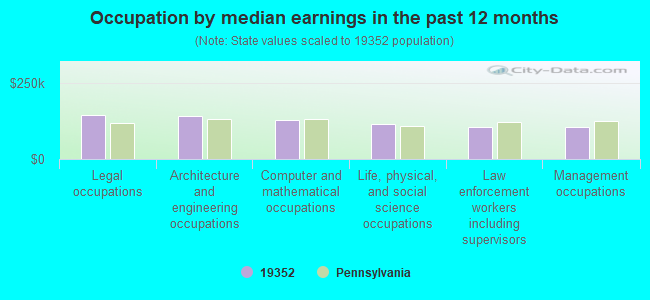
Occupation by median earnings in the past 12 months ($)
143,214Legal occupations
140,398Architecture and engineering occupations
127,832Computer and mathematical occupations
114,250Life, physical, and social science occupations
105,509Law enforcement workers including supervisors
105,051Management occupations
Top industries in this zip code by the number of employees in 2005:
Accommodation and Food Services: Food Service Contractors (50-99 employees: 1 establishment)
Administrative and Support and Waste Management and Remediation Services: Document Preparation Services (10-19: 1, 1-4: 1)
Administrative and Support and Waste Management and Remediation Services: All Other Support Services (10-19: 1)
Construction: Site Preparation Contractors (10-19: 1)
Wholesale Trade: Other Chemical and Allied Products Merchant Wholesalers (10-19: 1)
Construction: Residential Remodelers (1-4: 6)
Information: Data Processing, Hosting, and Related Services (5-9: 1, 1-4: 2)
Administrative and Support and Waste Management and Remediation Services: Landscaping Services (1-4: 5)
Construction: Electrical Contractors (1-4: 4)
Wholesale Trade: Construction and Mining (except Oil Well) Machinery and Equipment Merchant Wholesalers (5-9: 1)
People in group quarters in 2010:
1,718 people in college/university student housing
People in group quarters in 2000:
1,272 people in college dormitories (includes college quarters off campus)
3 people in homes for the mentally retarded
Fatal accident statistics in 2011:
Fatal accident count: 1
Vehicles involved in fatal accidents: 1
Fatal accidents caused by drunken drivers: 0
Fatalities: 1
Persons involved in fatal accidents: 3
Pedestrians involved in fatal accidents: 0
Fatal accident statistics in 2010:
Fatal accident count: 1
Vehicles involved in fatal accidents: 1
Fatal accidents caused by drunken drivers: 1
Fatalities: 1
Persons involved in fatal accidents: 2
Pedestrians involved in fatal accidents: 0
Home Mortgage Disclosure Act Aggregated Statistics For Year 2009 (Based on 10 partial tracts)
A) FHA, FSA/RHS & VA Home Purchase Loans
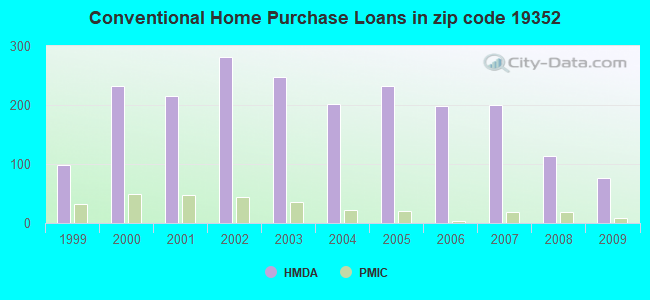
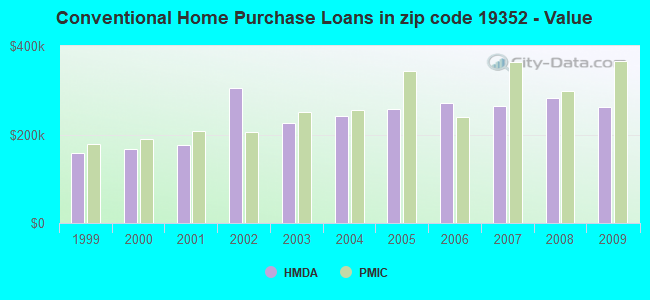
B) Conventional Home Purchase Loans
C) Refinancings
D) Home Improvement Loans
F) Non-occupant Loans on < 5 Family Dwellings (A B C & D)
G) Loans On Manufactured Home Dwelling (A B C & D)
Number
Average Value
Number
Average Value
Number
Average Value
Number
Average Value
Number
Average Value
Number
Average Value
LOANS ORIGINATED
19
$285,106
76
$262,980
463
$262,469
27
$77,553
9
$213,822
3
$51,240
APPLICATIONS APPROVED, NOT ACCEPTED
2
$205,925
6
$233,735
26
$238,513
5
$57,928
0
$0
0
$0
APPLICATIONS DENIED
4
$278,435
6
$148,457
116
$281,807
16
$145,424
5
$170,348
4
$24,060
APPLICATIONS WITHDRAWN
2
$209,475
6
$356,205
79
$280,674
9
$126,964
0
$0
0
$0
FILES CLOSED FOR INCOMPLETENESS
0
$0
0
$0
20
$261,186
0
$0
0
$0
0
$0
Aggregated Statistics For Year 2008 (Based on 10 partial tracts)
A) FHA, FSA/RHS & VA Home Purchase Loans
B) Conventional Home Purchase Loans
C) Refinancings
D) Home Improvement Loans
F) Non-occupant Loans on < 5 Family Dwellings (A B C & D)
G) Loans On Manufactured Home Dwelling (A B C & D)
Number
Average Value
Number
Average Value
Number
Average Value
Number
Average Value
Number
Average Value
Number
Average Value
LOANS ORIGINATED
11
$270,282
114
$283,369
203
$247,710
52
$56,073
13
$295,308
1
$86,970
APPLICATIONS APPROVED, NOT ACCEPTED
0
$0
15
$203,373
28
$221,202
7
$48,840
2
$183,625
2
$51,905
APPLICATIONS DENIED
1
$158,450
6
$334,355
119
$269,353
29
$56,315
2
$221,045
4
$160,092
APPLICATIONS WITHDRAWN
0
$0
6
$371,103
46
$275,815
7
$86,539
2
$298,790
0
$0
FILES CLOSED FOR INCOMPLETENESS
0
$0
4
$205,985
12
$223,222
4
$161,230
0
$0
0
$0
Aggregated Statistics For Year 2007 (Based on 10 partial tracts)
A) FHA, FSA/RHS & VA Home Purchase Loans
B) Conventional Home Purchase Loans
C) Refinancings
D) Home Improvement Loans
F) Non-occupant Loans on < 5 Family Dwellings (A B C & D)
G) Loans On Manufactured Home Dwelling (A B C & D)
Number
Average Value
Number
Average Value
Number
Average Value
Number
Average Value
Number
Average Value
Number
Average Value
LOANS ORIGINATED
3
$233,553
200
$265,008
248
$216,876
79
$73,863
11
$268,811
0
$0
APPLICATIONS APPROVED, NOT ACCEPTED
0
$0
21
$247,967
43
$180,453
19
$59,269
2
$269,420
2
$185,070
APPLICATIONS DENIED
1
$400,330
21
$266,448
95
$277,019
19
$66,308
3
$184,697
2
$133,710
APPLICATIONS WITHDRAWN
1
$400,330
25
$225,826
40
$230,828
5
$50,716
2
$439,695
0
$0
FILES CLOSED FOR INCOMPLETENESS
0
$0
4
$652,052
20
$311,084
0
$0
0
$0
0
$0
Aggregated Statistics For Year 2006 (Based on 10 partial tracts)
A) FHA, FSA/RHS & VA Home Purchase Loans
B) Conventional Home Purchase Loans
C) Refinancings
D) Home Improvement Loans
F) Non-occupant Loans on < 5 Family Dwellings (A B C & D)
G) Loans On Manufactured Home Dwelling (A B C & D)
Number
Average Value
Number
Average Value
Number
Average Value
Number
Average Value
Number
Average Value
Number
Average Value
LOANS ORIGINATED
4
$205,938
198
$271,018
303
$202,659
94
$69,996
11
$272,389
1
$56,790
APPLICATIONS APPROVED, NOT ACCEPTED
0
$0
19
$277,249
45
$186,661
14
$77,720
1
$209,150
1
$29,550
APPLICATIONS DENIED
0
$0
19
$181,838
137
$245,798
50
$86,199
4
$97,632
5
$69,122
APPLICATIONS WITHDRAWN
0
$0
18
$223,712
75
$238,480
11
$117,935
1
$184,380
0
$0
FILES CLOSED FOR INCOMPLETENESS
0
$0
5
$274,416
17
$261,713
4
$129,098
1
$346,070
0
$0
Aggregated Statistics For Year 2005 (Based on 10 partial tracts)
B) Conventional Home Purchase Loans
C) Refinancings
D) Home Improvement Loans
E) Loans on Dwellings For 5+ Families
F) Non-occupant Loans on < 5 Family Dwellings (A B C & D)
G) Loans On Manufactured Home Dwelling (A B C & D)
Number
Average Value
Number
Average Value
Number
Average Value
Number
Average Value
Number
Average Value
Number
Average Value
LOANS ORIGINATED
233
$258,663
376
$184,345
90
$55,022
0
$0
9
$247,417
1
$75,160
APPLICATIONS APPROVED, NOT ACCEPTED
21
$246,623
49
$173,303
9
$71,484
0
$0
0
$0
2
$30,260
APPLICATIONS DENIED
31
$272,012
111
$219,556
24
$49,668
0
$0
5
$162,380
3
$86,823
APPLICATIONS WITHDRAWN
23
$253,180
138
$217,310
17
$114,413
1
$249,290
5
$203,246
2
$43,740
FILES CLOSED FOR INCOMPLETENESS
5
$314,344
31
$204,443
4
$29,242
0
$0
2
$93,900
0
$0
Aggregated Statistics For Year 2004 (Based on 10 partial tracts)
A) FHA, FSA/RHS & VA Home Purchase Loans
B) Conventional Home Purchase Loans
C) Refinancings
D) Home Improvement Loans
F) Non-occupant Loans on < 5 Family Dwellings (A B C & D)
G) Loans On Manufactured Home Dwelling (A B C & D)
Number
Average Value
Number
Average Value
Number
Average Value
Number
Average Value
Number
Average Value
Number
Average Value
LOANS ORIGINATED
3
$161,323
201
$241,261
387
$170,641
82
$67,435
14
$163,624
2
$73,190
APPLICATIONS APPROVED, NOT ACCEPTED
0
$0
26
$238,957
52
$147,264
11
$40,330
2
$184,555
1
$54,580
APPLICATIONS DENIED
1
$111,670
21
$211,271
119
$179,971
31
$106,189
3
$186,347
2
$70,560
APPLICATIONS WITHDRAWN
0
$0
18
$252,806
105
$196,299
8
$137,408
0
$0
0
$0
FILES CLOSED FOR INCOMPLETENESS
0
$0
3
$389,570
60
$205,069
7
$57,719
0
$0
0
$0
Aggregated Statistics For Year 2003 (Based on 10 partial tracts)
A) FHA, FSA/RHS & VA Home Purchase Loans
B) Conventional Home Purchase Loans
C) Refinancings
D) Home Improvement Loans
F) Non-occupant Loans on < 5 Family Dwellings (A B C & D)
Number
Average Value
Number
Average Value
Number
Average Value
Number
Average Value
Number
Average Value
LOANS ORIGINATED
3
$170,567
248
$226,408
1,034
$164,213
94
$49,095
13
$179,334
APPLICATIONS APPROVED, NOT ACCEPTED
0
$0
36
$185,835
150
$169,551
11
$68,772
0
$0
APPLICATIONS DENIED
0
$0
38
$159,772
181
$183,412
28
$50,919
5
$101,526
APPLICATIONS WITHDRAWN
0
$0
16
$250,210
133
$177,121
5
$74,310
3
$94,427
FILES CLOSED FOR INCOMPLETENESS
0
$0
11
$218,024
23
$165,924
3
$147,560
1
$106,470
Aggregated Statistics For Year 2002 (Based on 10 partial tracts)
A) FHA, FSA/RHS & VA Home Purchase Loans
B) Conventional Home Purchase Loans
C) Refinancings
D) Home Improvement Loans
F) Non-occupant Loans on < 5 Family Dwellings (A B C & D)
Number
Average Value
Number
Average Value
Number
Average Value
Number
Average Value
Number
Average Value
LOANS ORIGINATED
7
$184,016
282
$306,193
563
$203,270
102
$40,830
12
$2,505,968
APPLICATIONS APPROVED, NOT ACCEPTED
2
$155,195
26
$192,995
72
$143,611
24
$36,035
3
$124,827
APPLICATIONS DENIED
0
$0
21
$142,120
104
$155,694
16
$36,903
0
$0
APPLICATIONS WITHDRAWN
0
$0
21
$181,919
102
$427,761
7
$65,960
1
$84,940
FILES CLOSED FOR INCOMPLETENESS
0
$0
2
$190,670
22
$154,370
4
$18,072
0
$0
Aggregated Statistics For Year 2001 (Based on 10 partial tracts)
A) FHA, FSA/RHS & VA Home Purchase Loans
B) Conventional Home Purchase Loans
C) Refinancings
D) Home Improvement Loans
F) Non-occupant Loans on < 5 Family Dwellings (A B C & D)
Number
Average Value
Number
Average Value
Number
Average Value
Number
Average Value
Number
Average Value
LOANS ORIGINATED
6
$155,352
216
$175,331
337
$155,170
89
$32,005
4
$151,318
APPLICATIONS APPROVED, NOT ACCEPTED
2
$124,945
27
$154,958
55
$103,338
18
$33,059
0
$0
APPLICATIONS DENIED
0
$0
18
$102,908
72
$122,414
17
$27,758
2
$143,060
APPLICATIONS WITHDRAWN
0
$0
13
$136,338
62
$148,979
11
$76,743
4
$94,460
FILES CLOSED FOR INCOMPLETENESS
0
$0
4
$224,190
19
$129,746
0
$0
0
$0
Aggregated Statistics For Year 2000 (Based on 10 partial tracts)
A) FHA, FSA/RHS & VA Home Purchase Loans
B) Conventional Home Purchase Loans
C) Refinancings
D) Home Improvement Loans
F) Non-occupant Loans on < 5 Family Dwellings (A B C & D)
Number
Average Value
Number
Average Value
Number
Average Value
Number
Average Value
Number
Average Value
LOANS ORIGINATED
14
$132,511
232
$167,614
111
$94,728
70
$28,087
8
$59,356
APPLICATIONS APPROVED, NOT ACCEPTED
0
$0
32
$144,121
24
$75,368
17
$40,183
0
$0
APPLICATIONS DENIED
1
$178,140
22
$109,421
44
$104,652
25
$21,130
3
$54,187
APPLICATIONS WITHDRAWN
0
$0
21
$131,775
31
$108,989
11
$27,238
2
$120,400
FILES CLOSED FOR INCOMPLETENESS
0
$0
5
$179,708
4
$136,100
3
$63,543
0
$0
Aggregated Statistics For Year 1999 (Based on 5 partial tracts)
A) FHA, FSA/RHS & VA Home Purchase Loans
B) Conventional Home Purchase Loans
C) Refinancings
D) Home Improvement Loans
F) Non-occupant Loans on < 5 Family Dwellings (A B C & D)
2003 - 2018 National Fire Incident Reporting System (NFIRS) incidents
According to the data from the years 2003 - 2018 the average number of fire incidents per year is 8. The highest number of fires - 17 took place in 2008, and the least - 3 in 2010. The data has a growing trend.
When looking into fire subcategories, the most reports belonged to: Structure Fires (61.1%), and Outside Fires (22.9%).
Fire incident types reported to NFIRS in Zip Code 19352


 Nearest zip codes: 19390, 19363, 19350, 19330, 19311, 21920.


 According to the data from the years 2003 - 2018 the average number of fire incidents per year is 8. The highest number of fires - 17 took place in 2008, and the least - 3 in 2010. The data has a growing trend.
 When looking into fire subcategories, the most reports belonged to: Structure Fires (61.1%), and Outside Fires (22.9%).