Estimated zip code population in 2022: 11,326 Zip code population in 2010: 8,584 Zip code population in 2000: 5,094
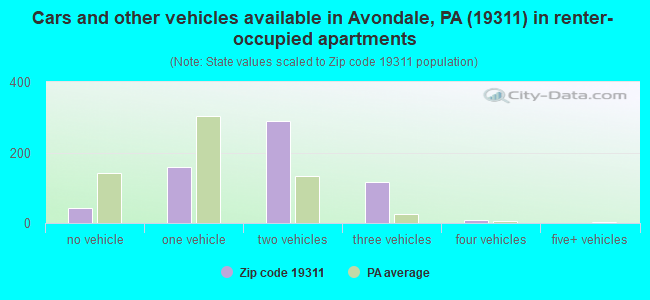
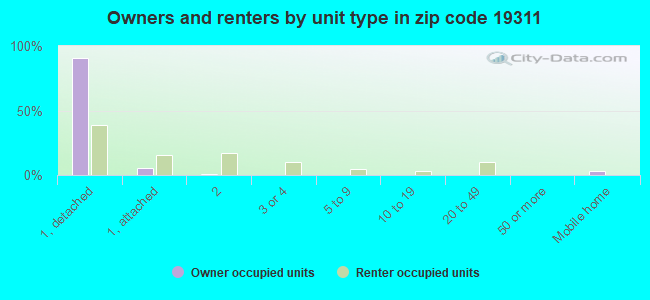
Houses and condos: 3,652 Renter-occupied apartments: 616
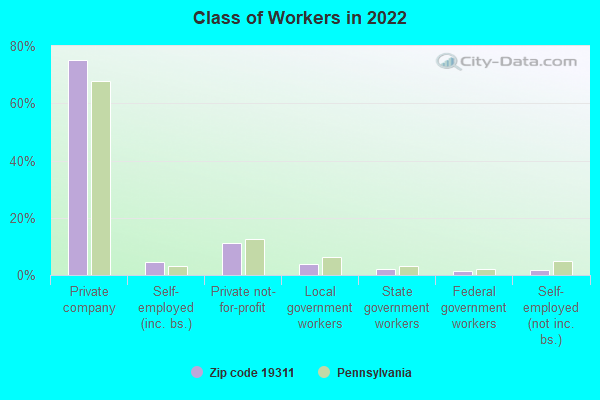
% of renters here:
17%
State:
31%
March 2022 cost of living index in zip code 19311: 104.4 (near average, U.S. average is 100)
Land area: 12.6 sq. mi. Water area: 0.1 sq. mi.
Population density: 899 people per square mile
(low).
OSM Map
General Map
Google Map
MSN Map
OSM Map
General Map
Google Map
MSN Map
OSM Map
General Map
Google Map
MSN Map
OSM Map
General Map
Google Map
MSN Map
Please wait while loading the map...
Real estate property taxes paid for housing units in 2022:
This zip code:
1.4% ($7,606)
Pennsylvania:
1.3% ($3,094)
Median real estate property taxes paid for housing units with mortgages in 2022: $7,968 (1.4%) Median real estate property taxes paid for housing units with no mortgage in 2022: $6,437 (1.4%)
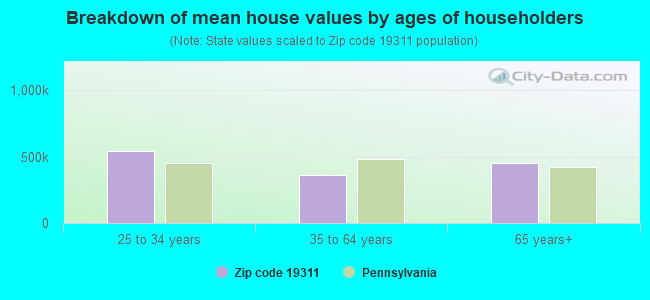
Estimated median house/condo value in 2022: $535,281
19311:
$535,281
Pennsylvania:
$245,500
According to our research of Pennsylvania and other state lists, there were 6 registered sex offenders living in 19311 zip code as of May 05, 2024. The ratio of all residents to sex offenders in zip code 19311 is 1,644 to 1. The ratio of registered sex offenders to all residents in this zip code is much lower than the state average.
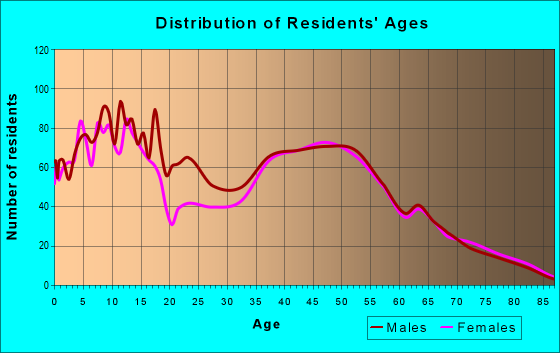
Median resident age:
This zip code:
36.3 years
Pennsylvania median age:
40.9 years
Average household size:
This zip code:
3.1 people
Pennsylvania:
2.4 people
Averages for the 2020 tax year for zip code 19311, filed in 2021:
Average Adjusted Gross Income (AGI) in 2020: $115,165 (Individual Income Tax Returns)
Here:
$115,165
State:
$75,707
Salary/wage: $99,170 (reported on 85.0% of returns)
Here:
$99,170
State:
$62,806
(% of AGI for various income ranges: 1422.6% for AGIs below $25k, 4217.5% for AGIs $25k-50k, 7199.4% for AGIs $50k-75k, 9145.5% for AGIs $75k-100k, 17959.4% for AGIs $100k-200k, 83738.2% for AGIs over 200k)
Taxable interest for individuals: $1,836 (reported on 38.8% of returns)
This zip code:
$1,836
Pennsylvania:
$1,633
(% of AGI for various income ranges: 14.5% for AGIs below $25k, 17.5% for AGIs $25k-50k, 37.3% for AGIs $50k-75k, 67.7% for AGIs $75k-100k, 144.9% for AGIs $100k-200k, 805.5% for AGIs over 200k)
Ordinary dividends: $6,440 (reported on 33.1% of returns)
Here:
$6,440
State:
$7,382
(% of AGI for various income ranges: 45.5% for AGIs below $25k, 72.7% for AGIs $25k-50k, 146.1% for AGIs $50k-75k, 225.0% for AGIs $75k-100k, 346.6% for AGIs $100k-200k, 2490.0% for AGIs over 200k)
Net capital gain/loss in AGI: +$13,533 (reported on 29.3% of returns)
Here:
+$13,533
State:
+$23,522
(% of AGI for various income ranges: 41.1% for AGIs below $25k, 52.3% for AGIs $25k-50k, 103.3% for AGIs $50k-75k, 122.3% for AGIs $75k-100k, 452.3% for AGIs $100k-200k, 5959.5% for AGIs over 200k)
Profit/loss from business: +$21,677 (reported on 13.6% of returns)
Here:
+$21,677
State:
+$16,274
(% of AGI for various income ranges: 138.4% for AGIs below $25k, 140.2% for AGIs $25k-50k, 392.1% for AGIs $50k-75k, 500.5% for AGIs $75k-100k, 711.9% for AGIs $100k-200k, 2091.4% for AGIs over 200k)
Taxable individual retirement arrangement distribution: $30,017 (reported on 11.4% of returns)
19311:
$30,017
Pennsylvania:
$18,583
(% of AGI for various income ranges: 49.8% for AGIs below $25k, 165.6% for AGIs $25k-50k, 300.9% for AGIs $50k-75k, 572.7% for AGIs $75k-100k, 1085.3% for AGIs $100k-200k, 2378.6% for AGIs over 200k)
Self-employed (Keogh) retirement plans: $28,050 (reported on 1.0% of returns)
19311:
$28,050
Pennsylvania:
$25,407
(% of AGI for various income ranges: 510.0% for AGIs over 200k)
Total itemized deductions: $31,966 (reported on 16.2% of returns)
Here:
$31,966
State:
$34,850
(% of AGI for various income ranges: 263.8% for AGIs $25k-50k, 403.0% for AGIs $50k-75k, 746.4% for AGIs $75k-100k, 1311.3% for AGIs $100k-200k, 4746.8% for AGIs over 200k)
Charity contributions: $8,338 (reported on 13.3% of returns)
Here:
$8,338
State:
$12,392
(% of AGI for various income ranges: 25.8% for AGIs $25k-50k, 38.5% for AGIs $50k-75k, 100.9% for AGIs $75k-100k, 204.5% for AGIs $100k-200k, 1410.0% for AGIs over 200k)
Taxes paid: $9,316 (reported on 16.2% of returns)
19311:
$9,316
State:
$8,200
(% of AGI for various income ranges: 55.4% for AGIs $25k-50k, 128.8% for AGIs $50k-75k, 284.1% for AGIs $75k-100k, 427.4% for AGIs $100k-200k, 1241.8% for AGIs over 200k)
Earned income credit: $2,300 (reported on 7.9% of returns)
Here:
$2,300
State:
$2,100
(% of AGI for various income ranges: 66.6% for AGIs below $25k, 66.5% for AGIs $25k-50k)
Percentage of individuals using paid preparers for their 2020 taxes: 90.7%
Here:
91%
State:
92%
(% for various income ranges: 87.6% for AGIs below $25k, 89.6% for AGIs $25k-50k, 91.7% for AGIs $50k-75k, 91.2% for AGIs $75k-100k, 92.1% for AGIs $100k-200k, 94.0% for AGIs over 200k)
Averages for the 2012 tax year for zip code 19311, filed in 2013:
Average Adjusted Gross Income (AGI) in 2012: $90,664 (Individual Income Tax Returns)
Here:
$90,664
State:
$61,346
Salary/wage: $77,417 (reported on 89.3% of returns)
Here:
$77,417
State:
$51,902
(% of AGI for various income ranges: 85.8% for AGIs below $25k, 88.3% for AGIs $25k-50k, 78.0% for AGIs $50k-75k, 72.1% for AGIs $75k-100k, 78.7% for AGIs $100k-200k, 72.0% for AGIs over 200k)
Taxable interest for individuals: $1,307 (reported on 38.4% of returns)
This zip code:
$1,307
Pennsylvania:
$1,588
(% of AGI for various income ranges: 0.7% for AGIs below $25k, 0.3% for AGIs $25k-50k, 0.6% for AGIs $50k-75k, 0.6% for AGIs $75k-100k, 0.5% for AGIs $100k-200k, 0.6% for AGIs over 200k)
Ordinary dividends: $6,151 (reported on 28.1% of returns)
Here:
$6,151
State:
$5,827
(% of AGI for various income ranges: 1.5% for AGIs below $25k, 1.0% for AGIs $25k-50k, 1.6% for AGIs $50k-75k, 1.3% for AGIs $75k-100k, 1.8% for AGIs $100k-200k, 2.3% for AGIs over 200k)
Net capital gain/loss in AGI: +$7,627 (reported on 23.0% of returns)
Here:
+$7,627
State:
+$14,495
(% of AGI for various income ranges: 0.5% for AGIs $100k-200k, 4.1% for AGIs over 200k)
Profit/loss from business: +$17,387 (reported on 10.7% of returns)
Here:
+$17,387
State:
+$16,268
(% of AGI for various income ranges: 3.3% for AGIs below $25k, 2.1% for AGIs $25k-50k, 3.4% for AGIs $50k-75k, 2.6% for AGIs $75k-100k, 2.2% for AGIs $100k-200k, 1.5% for AGIs over 200k)
Taxable individual retirement arrangement distribution: $19,827 (reported on 10.5% of returns)
19311:
$19,827
Pennsylvania:
$14,550
(% of AGI for various income ranges: 2.4% for AGIs below $25k, 1.6% for AGIs $25k-50k, 3.1% for AGIs $50k-75k, 4.7% for AGIs $75k-100k, 2.8% for AGIs $100k-200k, 1.5% for AGIs over 200k)
Self-employment retirement plans: $16,975 (reported on 0.9% of returns)
19311:
$16,975
Pennsylvania:
$20,922
Total itemized deductions: $31,406 (18% of AGI, reported on 41.6% of returns)
Here:
$31,406
State:
$23,538
Here:
17.8% of AGI
State:
18.4% of AGI
(% of AGI for various income ranges: 7.3% for AGIs below $25k, 6.8% for AGIs $25k-50k, 16.5% for AGIs $50k-75k, 18.9% for AGIs $75k-100k, 18.6% for AGIs $100k-200k, 12.9% for AGIs over 200k)
Charity contributions: $4,027 (reported on 36.0% of returns)
Here:
$4,027
State:
$4,025
(% of AGI for various income ranges: 0.5% for AGIs below $25k, 0.6% for AGIs $25k-50k, 1.3% for AGIs $50k-75k, 1.6% for AGIs $75k-100k, 1.9% for AGIs $100k-200k, 1.8% for AGIs over 200k)
Taxes paid: $15,043 (reported on 41.6% of returns)
19311:
$15,043
State:
$9,982
(% of AGI for various income ranges: 1.9% for AGIs below $25k, 2.3% for AGIs $25k-50k, 5.9% for AGIs $50k-75k, 7.4% for AGIs $75k-100k, 8.5% for AGIs $100k-200k, 7.3% for AGIs over 200k)
Earned income credit: $2,455 (reported on 9.3% of returns)
Here:
$2,455
State:
$2,106
(% of AGI for various income ranges: 4.0% for AGIs below $25k, 0.9% for AGIs $25k-50k)
Percentage of individuals using paid preparers for their 2012 taxes: 59.8%
Here:
60%
State:
53%
(% for various income ranges: 53.6% for AGIs below $25k, 60.8% for AGIs $25k-50k, 67.5% for AGIs $50k-75k, 59.5% for AGIs $75k-100k, 60.5% for AGIs $100k-200k, 69.0% for AGIs over 200k)
Averages for the 2004 tax year for zip code 19311, filed in 2005:
Average Adjusted Gross Income (AGI) in 2004: $72,902 (Individual Income Tax Returns)
Here:
$72,902
State:
$48,049
Salary/wage: $65,637 (reported on 89.4% of returns)
Here:
$65,637
State:
$42,646
(% of AGI for various income ranges: 87.4% for AGIs below $10k, 84.9% for AGIs $10k-25k, 86.2% for AGIs $25k-50k, 82.2% for AGIs $50k-75k, 77.9% for AGIs $75k-100k, 79.3% for AGIs over 100k)
Taxable interest for individuals: $2,234 (reported on 48.4% of returns)
This zip code:
$2,234
Pennsylvania:
$1,657
(% of AGI for various income ranges: 4.7% for AGIs below $10k, 1.5% for AGIs $10k-25k, 1.2% for AGIs $25k-50k, 1.0% for AGIs $50k-75k, 1.2% for AGIs $75k-100k, 1.6% for AGIs over 100k)
Taxable dividends: $2,570 (reported on 34.1% of returns)
Here:
$2,570
State:
$3,566
(% of AGI for various income ranges: 5.0% for AGIs below $10k, 1.3% for AGIs $10k-25k, 0.9% for AGIs $25k-50k, 1.1% for AGIs $50k-75k, 1.4% for AGIs $75k-100k, 1.2% for AGIs over 100k)
Net capital gain/loss: +$6,767 (reported on 28.0% of returns)
Here:
+$6,767
State:
+$9,716
(% of AGI for various income ranges: -5.3% for AGIs below $10k, 0.4% for AGIs $10k-25k, 0.6% for AGIs $25k-50k, 0.5% for AGIs $50k-75k, 0.6% for AGIs $75k-100k, 3.8% for AGIs over 100k)
Profit/loss from business: +$16,061 (reported on 11.4% of returns)
Here:
+$16,061
State:
+$14,267
(% of AGI for various income ranges: 3.1% for AGIs below $10k, 3.0% for AGIs $10k-25k, 3.6% for AGIs $25k-50k, 4.4% for AGIs $50k-75k, 2.3% for AGIs $75k-100k, 2.1% for AGIs over 100k)
IRA payment deduction: $3,306 (reported on 3.3% of returns)
19311:
$3,306
Pennsylvania:
$2,903
(% of AGI for various income ranges: 0.2% for AGIs $25k-50k, 0.3% for AGIs $50k-75k, 0.2% for AGIs $75k-100k, 0.1% for AGIs over 100k)
Self-employed pension: $14,095 (reported on 1.3% of returns)
Here:
$14,095
Pennsylvania:
$14,674
Total itemized deductions: $26,078 (19% of AGI, reported on 43.2% of returns)
Here:
$26,078
State:
$18,804
Here:
19.3% of AGI
State:
19.5% of AGI
(% of AGI for various income ranges: 10.0% for AGIs below $10k, 7.9% for AGIs $10k-25k, 9.5% for AGIs $25k-50k, 16.5% for AGIs $50k-75k, 22.2% for AGIs $75k-100k, 15.9% for AGIs over 100k)
Charity contributions deductions: $3,111 (2% of AGI, reported on 39.0% of returns)
Here:
$3,111
State:
$3,337
Here:
2.2% of AGI
State:
3.3% of AGI
(% of AGI for various income ranges: 0.5% for AGIs below $10k, 0.8% for AGIs $10k-25k, 0.8% for AGIs $25k-50k, 1.5% for AGIs $50k-75k, 2.4% for AGIs $75k-100k, 1.8% for AGIs over 100k)
Total tax: $15,113 (reported on 71.1% of returns)
19311:
$15,113
State:
$8,008
(% of AGI for various income ranges: 1.8% for AGIs below $10k, 3.1% for AGIs $10k-25k, 5.5% for AGIs $25k-50k, 8.8% for AGIs $50k-75k, 9.7% for AGIs $75k-100k, 18.9% for AGIs over 100k)
Earned income credit: $1,855 (reported on 8.2% of returns)
Here:
$1,855
State:
$1,643
Percentage of individuals using paid preparers for their 2004 taxes: 60.9%
Here:
61%
State:
56%
(% for various income ranges: 54.6% for AGIs below $10k, 59.4% for AGIs $10k-25k, 64.2% for AGIs $25k-50k, 61.2% for AGIs $50k-75k, 59.7% for AGIs $75k-100k, 63.4% for AGIs over 100k)
Household received Food Stamps/SNAP in the past 12 months: 113 Household did not receive Food Stamps/SNAP in the past 12 months: 3,434
Women who had a birth in the past 12 months: 125 (123 now married, 8 unmarried) Women who did not have a birth in the past 12 months: 2,500 (1,077 now married, 1,419 unmarried)
Housing units in zip code 19311 with a mortgage: 2,093 (275 second mortgage, 2 home equity loan, 222 both second mortgage and home equity loan) Houses without a mortgage: 68
Median monthly owner costs for units with a mortgage: $2,834 Median monthly owner costs for units without a mortgage: $1,037
Residents with income below the poverty level in 2022:
This zip code:
3.0%
Whole state:
11.8%
Residents with income below 50% of the poverty level in 2022:
This zip code:
1.0%
Whole state:
6.1%
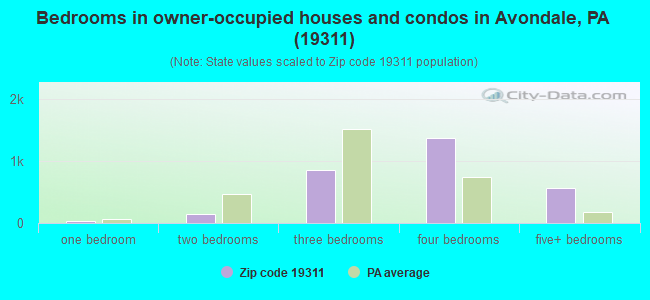
Median number of rooms in houses and condos:
Here:
10.0
State:
6.8
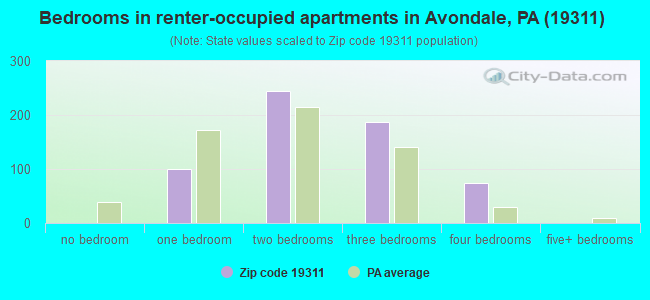
Median number of rooms in apartments:
Here:
5.6
State:
4.3
Notable locations in this zip code not listed on our city pages
Streams, rivers, and creeks: Trout Run (A), Agnew Run (B), Brickyard Run (C), Evans Brook (D), Mushroom Run (E), Lenni Lenape Run (F). Display/hide their locations on the map
2,473 married couples with children.
387 single-parent households (235 men, 152 women).
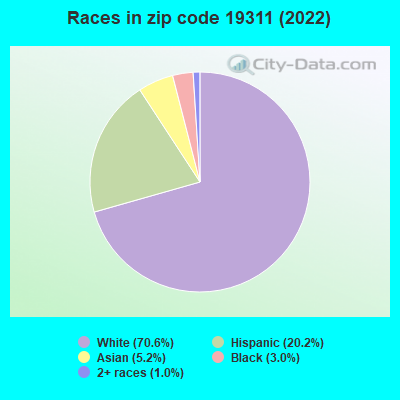
78.9% of residents of 19311 zip code speak English at home.
16.8% of residents speak Spanish at home (39% very well, 14% well, 25% not well, 22% not at all).
2.1% of residents speak other Indo-European language at home (95% very well, 3% well, 3% not well).
2.8% of residents speak Asian or Pacific Island language at home (100% very well).
0.2% of residents speak other language at home (100% well).
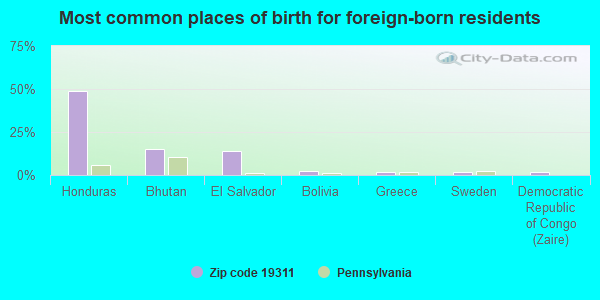
Foreign born population: 1,564 (13.8%) (36.0% of them are naturalized citizens)
This zip code:
13.8%
Whole state:
7.5%
49%Honduras
15%Bhutan
14%El Salvador
3%Bolivia
2%Greece
2%Sweden
2%Democratic Republic of Congo (Zaire)
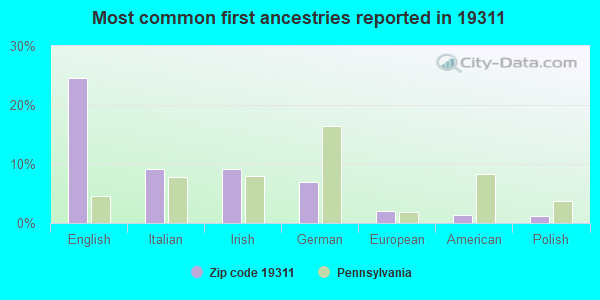
25%English
9%Italian
9%Irish
7%German
2%European
1%American
1%Polish
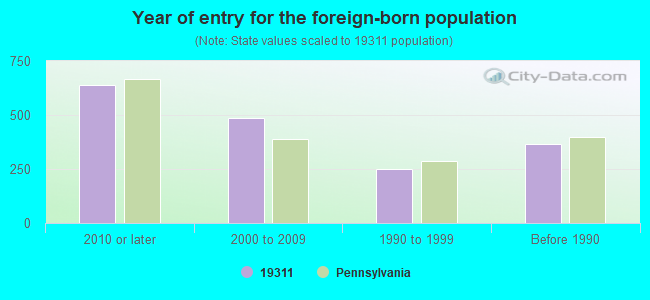
Year of entry for the foreign-born population
6392010 or later
4872000 to 2009
2521990 to 1999
365Before 1990
Facilities with environmental interests located in this zip code:
AMER MFG TECH (380 STARR ROAD in AVONDALE, PA)
COMPLIANCE ACTIVITY (Tracking inspections of insecticide, fungicide, and rodenticide, and toxic substances) STATE MASTER (Pennsylvania database) - RCRIS-PAD987390754, HAZARDOUS WASTE PROGRAM Small Quantity Generators, between 100 kg and 1000 kg of hazardous waste/month (Resource Conservation and Recovery Act (tracking hazardous waste)) - notification TRI REPORTER (Tracking of toxic chemicals releasing facilities) - ICIS-, ENFORCEMENT/COMPLIANCE ACTIVITY Business SIC classification: METAL STAMPINGS; INDUSTRIAL AND COMMERCIAL MACHINERY AND EQUIPMENT Organizations: HEWLETT PACKARD (CONTACT/OWNER)
ABERNETHYS AUTO BODY SVC (834 GAP NEWPORT PIKE in AVONDALE, PA)
AIR MINOR (AIRS/AFS) STATE MASTER (Pennsylvania database) - RCRIS-PAD013837224, HAZARDOUS WASTE PROGRAM, AFS-00-1200268-1, AIR PROGRAM Conditionally Exempt Small Quantity Generators, less than 100 kg/month of hazardous waste (Resource Conservation and Recovery Act (tracking hazardous waste)) - notification Business SIC classification: TOP, BODY, AND UPHOLSTERY REPAIR SHOPS AND PAINT SHOPS; GENERAL AUTOMOTIVE REPAIR SHOPS; AUTOMOTIVE REPAIR SHOPS Business NAICS classification: AUTOMOTIVE BODY, PAINT, AND INTERIOR REPAIR AND MAINTENANCE.; AUTOMOTIVE BODY, PAINT, AND INTERIOR REPAIR AND MAINTENANCE. Organizations: OPERNAME (CONTACT/OPERATOR)
, ABERNETHY ROBERT M (CONTACT/OWNER)
, ABERNETHY S AUTO BODY, INC. (CONTACT/OWNER)
Alternative names: ABERNATHY'S AUTO BODY
ACE QUALITY CLNR (RT #41 & OLD BALTIMORE PIKE in AVONDALE, PA)
AIR MINOR (AIRS/AFS) STATE MASTER (Pennsylvania database) - AFS-00-1200110-1, AIR PROGRAM Small Quantity Generators, between 100 kg and 1000 kg of hazardous waste/month (Resource Conservation and Recovery Act (tracking hazardous waste)) - notification Business SIC classification: DRYCLEANING PLANTS, EXCEPT RUG CLEANING Business NAICS classification: DRYCLEANING AND LAUNDRY SERVICES (EXCEPT COIN-OPERATED). Organizations: ANTHONY TSAGANOS (CONTACT/OWNER)
, ACE QUALITY CLEANER (OWNER/OPERATOR)
BAVARIAN COLLISION (9020 GAP NEWPORT PIKE in AVONDALE, PA)
STATE MASTER (Pennsylvania database) - RCRIS-PAR000002253, HAZARDOUS WASTE PROGRAM (Resource Conservation and Recovery Act (tracking hazardous waste)) Alternative names: 3 D STRUCTURES
AVON FUEL & SUPPLY CO (915 PENN GREEN ST in AVONDALE, PA)
(Integrated Compliance Information System) - ICIS-03-2003-0269, FORMAL ENFORCEMENT ACTION
ATLANTIC SERVICE STATION (STATE & PENNA AVE in AVONDALE, PA)
Conditionally Exempt Small Quantity Generators, less than 100 kg/month of hazardous waste (Resource Conservation and Recovery Act (tracking hazardous waste)) - notification Organizations: OPERNAME (CONTACT/OPERATOR)
, ATLANTIC REFINING & MARKETING (CONTACT/OWNER)
AVONDALE ATLANTIC (PA AVE & 1ST STREET in AVONDALE, PA)
Small Quantity Generators, between 100 kg and 1000 kg of hazardous waste/month (Resource Conservation and Recovery Act (tracking hazardous waste)) - notification Organizations: OPERNAME (CONTACT/OPERATOR)
, ATLANTIC REFINING & MARKETING (CONTACT/OWNER)
AVONDALE BORO WTP (126 WEST STATE ST in AVONDALE, PA)
National Pollutant Discharge Elimination System NON-MAJOR (Tracking pollutant discharge elimination systems) - permit Business SIC classification: SEWERAGE SYSTEMS
AVONDALE MOBIL STATION (1803 OLD BALTIMORE PIKE in AVONDALE, PA)
National Pollutant Discharge Elimination System NON-MAJOR (Tracking pollutant discharge elimination systems) - permit Business SIC classification: GASOLINE SERVICE STATIONS Alternative names: WALKER OIL CO
Housing units lacking complete plumbing facilities: 1.2% Housing units lacking complete kitchen facilities: 1.3%
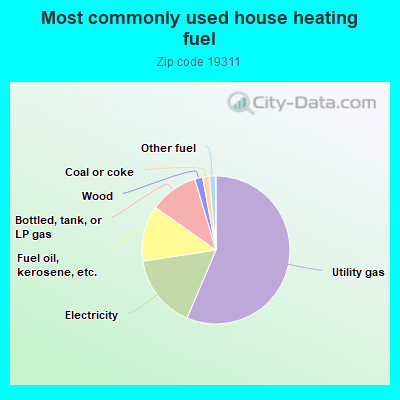
56.4%Utility gas
16.2%Electricity
12.2%Fuel oil, kerosene, etc.
10.6%Bottled, tank, or LP gas
1.7%Wood
1.5%Coal or coke
1.3%Other fuel
Population in 1990: 4,161. Population change in the 1990s: +933 (+22.4%).
Place of birth for U.S.-born residents:
This state: 4,857
Northeast: 1,198
Midwest: 353
South: 2,925
West: 366
56% of the 19311 zip code residents lived in the same house 5 years ago. Out of people who lived in different houses, 34% lived in this county. Out of people who lived in different counties, 50% lived in Pennsylvania.
91% of the 19311 zip code residents lived in the same house 1 year ago. Out of people who lived in different houses, 45% moved from this county. Out of people who lived in different houses, 28% moved from different county within same state. Out of people who lived in different houses, 26% moved from different state. Out of people who lived in different houses, 0% moved from abroad.
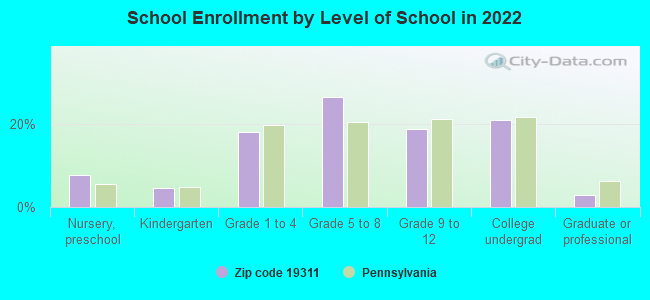
Private vs. public school enrollment:
Students in private schools in grades 1 to 8 (elementary and middle school): 46
Here:
3.6%
Pennsylvania:
15.7%
Students in private schools in grades 9 to 12 (high school): 142
Here:
26.0%
Pennsylvania:
13.4%
Students in private undergraduate colleges: 331
Here:
54.0%
Pennsylvania:
39.8%
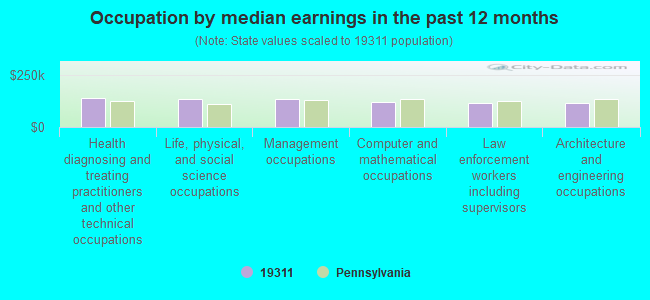
Occupation by median earnings in the past 12 months ($)
141,830Health diagnosing and treating practitioners and other technical occupations
136,519Life, physical, and social science occupations
133,425Management occupations
118,874Computer and mathematical occupations
116,290Law enforcement workers including supervisors
114,779Architecture and engineering occupations
Companies with federal contracts located in this zip code:
ANHOLT TECHNOLOGIES INC (440 CHURCH ROAD in AVONDALE, PA; small business) : $1,812,268 in 10 contractsfrom 2000 to 2004
Contracts for Other Research and Development -- Applied Research and Exploratory Development (R&D), Other Defense -- Basic Research (R&D), Soups and Bouillons, Gas Turbines and Jet Engines, Non-Aircraft; and Components, and moreby Navy, Army Signed by year:2000: $229,707; 2001: $665,428; 2002: $137,630; 2003: $413,438; 2004: $366,065; 2005: $0; 2006: $0.
Biggest contracts:
$394,596 with Navy for Other Research and Development -- Applied Research and Exploratory Development (R&D). Signed on 2001-01-17. Completion date: 2001-08-22.
$366,065 with Army for Other Defense -- Basic Research (R&D). Signed on 2004-12-02. Completion date: 2004-11-24.
$363,674, same as above.Signed on 2003-11-17. Completion date: 2005-11-17.
$270,832 with Navy for Soups and Bouillons. Signed on 2001-09-28. Completion date: 2002-04-19.
COUNTRY FRESH MUSHROOM CO (8990 S RTE 41 in AVONDALE, PA; small business) : $5,369 in 2 contractsin 2004
$2,754 with Defense Logistics Agency for Fruits and Vegetables. Signed on 2004-12-21. Completion date: 2004-12-21.
$2,615, same as above.Signed on 2004-10-19. Completion date: 2004-10-19.
Top industries in this zip code by the number of employees in 2005:
2003 - 2018 National Fire Incident Reporting System (NFIRS) incidents
According to the data from the years 2003 - 2018 the average number of fire incidents per year is 46. The highest number of reported fire incidents - 75 took place in 2011, and the least - 7 in 2006. The data has a constant trend.
When looking into fire subcategories, the most incidents belonged to: Structure Fires (46.0%), and Outside Fires (30.4%).
Fire incident types reported to NFIRS in Zip Code 19311


 Nearest zip codes: 19374, 19350, 19390, 19348, 19375, 19707.
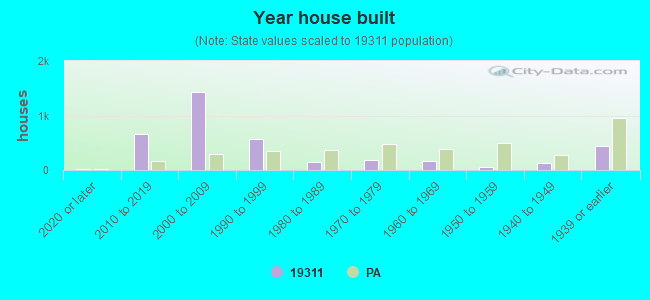


 According to the data from the years 2003 - 2018 the average number of fire incidents per year is 46. The highest number of reported fire incidents - 75 took place in 2011, and the least - 7 in 2006. The data has a constant trend.
 When looking into fire subcategories, the most incidents belonged to: Structure Fires (46.0%), and Outside Fires (30.4%).