Estimated zip code population in 2022: 3,605 Zip code population in 2010: 2,839 Zip code population in 2000: 2,556
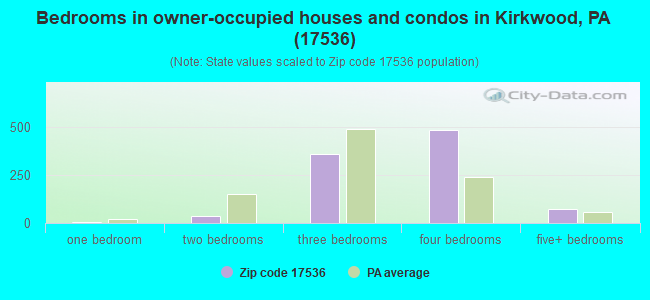
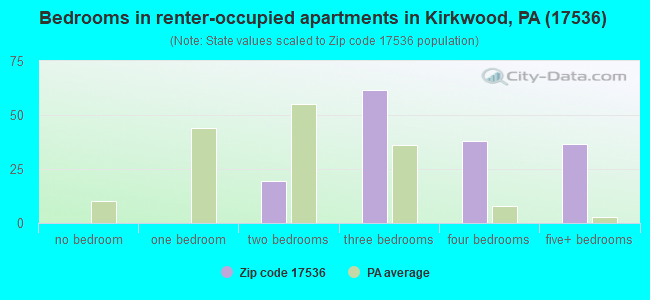
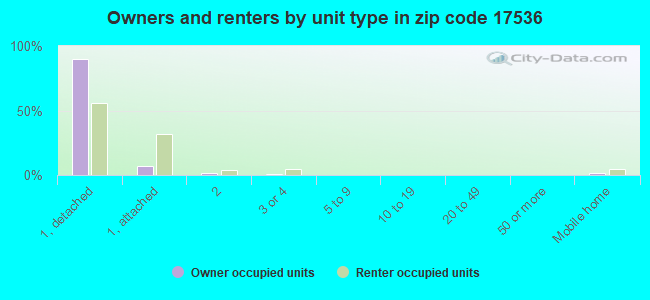
Houses and condos: 1,173 Renter-occupied apartments: 162
% of renters here:
14%
State:
31%
March 2022 cost of living index in zip code 17536: 95.8 (near average, U.S. average is 100)
Land area: 21.7 sq. mi. Water area: 0.7 sq. mi.
Population density: 167 people per square mile
(very low).
OSM Map
General Map
Google Map
MSN Map
OSM Map
General Map
Google Map
MSN Map
OSM Map
General Map
Google Map
MSN Map
OSM Map
General Map
Google Map
MSN Map
Please wait while loading the map...
Real estate property taxes paid for housing units in 2022:
This zip code:
0.8% ($2,868)
Pennsylvania:
1.3% ($3,094)
Median real estate property taxes paid for housing units with mortgages in 2022: $2,822 (0.7%) Median real estate property taxes paid for housing units with no mortgage in 2022: $3,073 (1.0%)
Business Search- 14 Million verified businesses
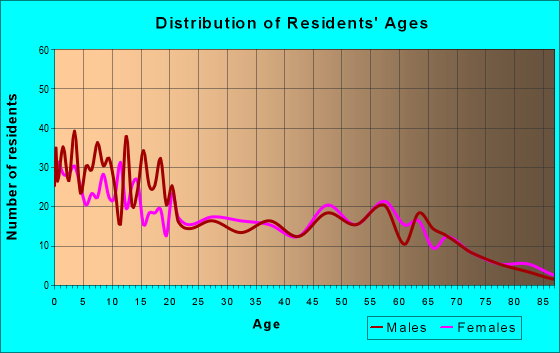
Males: 1,623
(45.0%)
Females: 1,982
(55.0%)
For population 25 years and over in 17536:
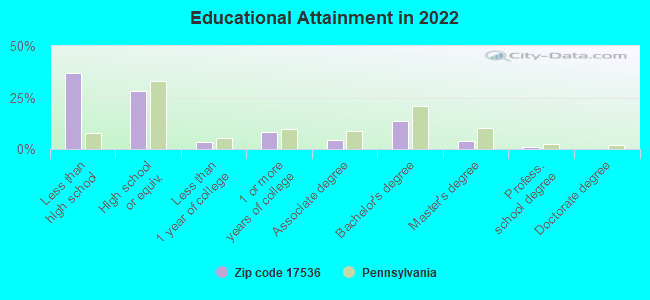
High school or higher: 60.2%
Bachelor's degree or higher: 18.0%
Graduate or professional degree: 4.8%
Unemployed: 0.9%
Mean travel time to work (commute): 30.8 minutes
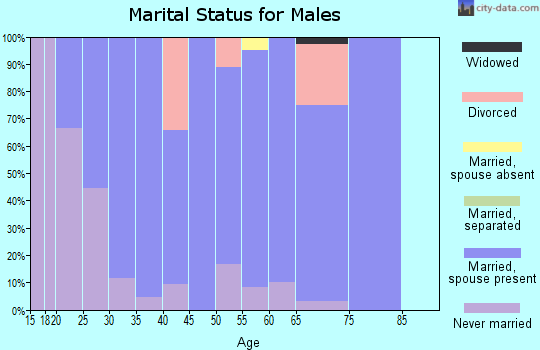
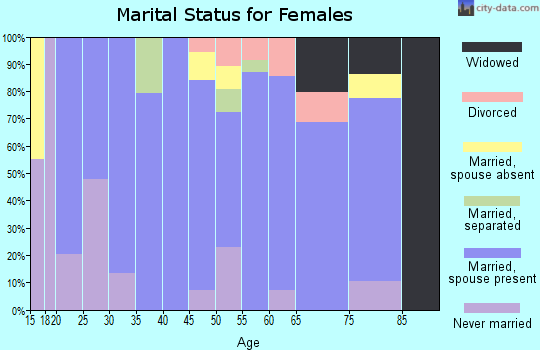
For population 15 years and over in 17536:
Never married: 27.7%
Now married: 62.2%
Separated: 0.3%
Widowed: 6.5%
Divorced: 3.4%
Zip code 17536 compared to state average:
Unemployed percentage significantly below state average.
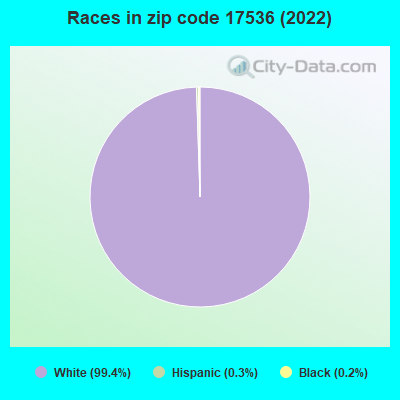
Black race population percentage significantly below state average.
Hispanic race population percentage significantly below state average.
Foreign-born population percentage significantly below state average.
Renting percentage below state average.
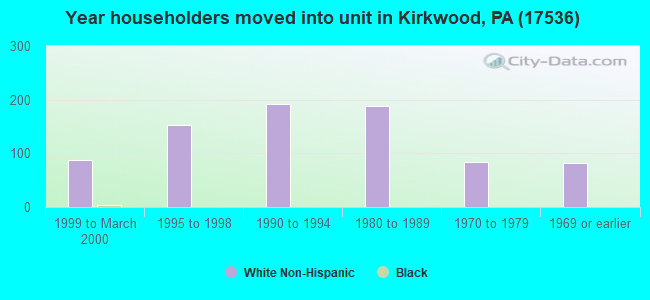
Length of stay since moving in significantly above state average.
House age below state average.
Number of college students below state average.
Percentage of population with a bachelor's degree or higher significantly below state average.
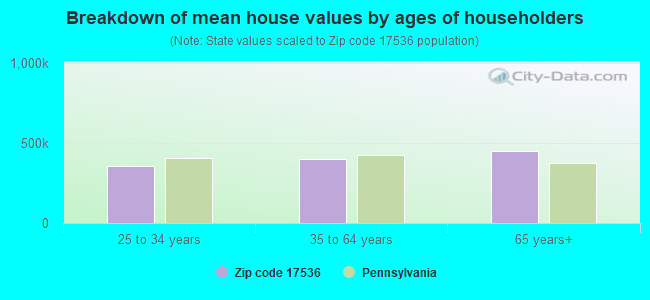
Estimated median house/condo value in 2022: $367,599
17536:
$367,599
Pennsylvania:
$245,500
According to our research of Pennsylvania and other state lists, there were 3 registered sex offenders living in 17536 zip code as of May 19, 2024. The ratio of all residents to sex offenders in zip code 17536 is 1,020 to 1. The ratio of registered sex offenders to all residents in this zip code is lower than the state average.
Median resident age:
This zip code:
37.9 years
Pennsylvania median age:
40.9 years
Average household size:
This zip code:
3.2 people
Pennsylvania:
2.4 people
Averages for the 2020 tax year for zip code 17536, filed in 2021:
Average Adjusted Gross Income (AGI) in 2020: $63,417 (Individual Income Tax Returns)
Here:
$63,417
State:
$75,707
Salary/wage: $52,200 (reported on 69.0% of returns)
Here:
$52,200
State:
$62,806
(% of AGI for various income ranges: 1381.6% for AGIs below $25k, 4179.4% for AGIs $25k-50k, 6572.7% for AGIs $50k-75k, 9197.5% for AGIs $75k-100k, 17354.4% for AGIs $100k-200k)
Taxable interest for individuals: $1,591 (reported on 34.9% of returns)
This zip code:
$1,591
Pennsylvania:
$1,633
(% of AGI for various income ranges: 56.3% for AGIs below $25k, 53.1% for AGIs $25k-50k, 124.5% for AGIs $50k-75k, 97.5% for AGIs $75k-100k, 113.3% for AGIs $100k-200k)
Ordinary dividends: $7,487 (reported on 18.3% of returns)
Here:
$7,487
State:
$7,382
(% of AGI for various income ranges: 52.6% for AGIs below $25k, 90.0% for AGIs $25k-50k, 200.9% for AGIs $50k-75k, 60.0% for AGIs $75k-100k, 247.8% for AGIs $100k-200k)
Net capital gain/loss in AGI: +$22,513 (reported on 18.3% of returns)
Here:
+$22,513
State:
+$23,522
(% of AGI for various income ranges: 32.1% for AGIs below $25k, 71.9% for AGIs $25k-50k, 216.4% for AGIs $50k-75k, 187.5% for AGIs $75k-100k, 373.3% for AGIs $100k-200k)
Profit/loss from business: +$18,737 (reported on 23.8% of returns)
Here:
+$18,737
State:
+$16,274
(% of AGI for various income ranges: 418.4% for AGIs below $25k, 675.6% for AGIs $25k-50k, 715.5% for AGIs $50k-75k, 592.5% for AGIs $75k-100k, 2760.0% for AGIs $100k-200k)
Taxable individual retirement arrangement distribution: $17,931 (reported on 10.3% of returns)
17536:
$17,931
Pennsylvania:
$18,583
(% of AGI for various income ranges: 95.3% for AGIs below $25k, 189.4% for AGIs $25k-50k, 660.0% for AGIs $50k-75k, 1245.6% for AGIs $100k-200k)
Total itemized deductions: $31,200 (reported on 5.6% of returns)
Here:
$31,200
State:
$34,850
(% of AGI for various income ranges: 387.5% for AGIs $25k-50k, 1737.8% for AGIs $100k-200k)
Charity contributions: $19,050 (reported on 3.2% of returns)
Here:
$19,050
State:
$12,392
(% of AGI for various income ranges: 846.7% for AGIs $100k-200k)
Taxes paid: $7,529 (reported on 5.6% of returns)
17536:
$7,529
State:
$8,200
(% of AGI for various income ranges: 82.5% for AGIs $25k-50k, 438.9% for AGIs $100k-200k)
Earned income credit: $1,844 (reported on 7.1% of returns)
Here:
$1,844
State:
$2,100
(% of AGI for various income ranges: 39.5% for AGIs below $25k, 56.9% for AGIs $25k-50k)
Percentage of individuals using paid preparers for their 2020 taxes: 92.1%
Here:
92%
State:
92%
(% for various income ranges: 90.0% for AGIs below $25k, 90.6% for AGIs $25k-50k, 94.7% for AGIs $50k-75k, 92.3% for AGIs $75k-100k, 94.1% for AGIs $100k-200k, 100.0% for AGIs over 200k)
Averages for the 2012 tax year for zip code 17536, filed in 2013:
Average Adjusted Gross Income (AGI) in 2012: $51,350 (Individual Income Tax Returns)
Here:
$51,350
State:
$61,346
Salary/wage: $47,862 (reported on 71.1% of returns)
Here:
$47,862
State:
$51,902
(% of AGI for various income ranges: 56.0% for AGIs below $25k, 59.0% for AGIs $25k-50k, 68.0% for AGIs $50k-75k, 68.5% for AGIs $75k-100k, 103.0% for AGIs $100k-200k)
Taxable interest for individuals: $1,293 (reported on 39.5% of returns)
This zip code:
$1,293
Pennsylvania:
$1,588
(% of AGI for various income ranges: 2.7% for AGIs below $25k, 0.4% for AGIs $25k-50k, 0.7% for AGIs $50k-75k, 0.7% for AGIs $75k-100k, 1.7% for AGIs $100k-200k)
Ordinary dividends: $4,328 (reported on 21.9% of returns)
Here:
$4,328
State:
$5,827
(% of AGI for various income ranges: 1.7% for AGIs below $25k, 1.3% for AGIs $25k-50k, 1.0% for AGIs $50k-75k, 1.5% for AGIs $75k-100k, 3.7% for AGIs $100k-200k)
Net capital gain/loss in AGI: +$10,132 (reported on 21.9% of returns)
Here:
+$10,132
State:
+$14,495
(% of AGI for various income ranges: 4.0% for AGIs below $25k, 4.7% for AGIs $25k-50k, 1.8% for AGIs $50k-75k, 0.3% for AGIs $75k-100k, 10.0% for AGIs $100k-200k)
Profit/loss from business: +$13,100 (reported on 23.7% of returns)
Here:
+$13,100
State:
+$16,268
(% of AGI for various income ranges: 17.7% for AGIs below $25k, 9.0% for AGIs $25k-50k, 6.3% for AGIs $50k-75k, 5.5% for AGIs $75k-100k, 3.9% for AGIs $100k-200k)
Taxable individual retirement arrangement distribution: $12,054 (reported on 11.4% of returns)
17536:
$12,054
Pennsylvania:
$14,550
(% of AGI for various income ranges: 3.5% for AGIs below $25k, 2.8% for AGIs $25k-50k, 6.0% for AGIs $50k-75k, 3.2% for AGIs $100k-200k)
Total itemized deductions: $20,672 (21% of AGI, reported on 31.6% of returns)
Here:
$20,672
State:
$23,538
Here:
21.4% of AGI
State:
18.4% of AGI
(% of AGI for various income ranges: 7.1% for AGIs below $25k, 9.5% for AGIs $25k-50k, 13.7% for AGIs $50k-75k, 14.9% for AGIs $75k-100k, 20.5% for AGIs $100k-200k)
Charity contributions: $3,889 (reported on 24.6% of returns)
Here:
$3,889
State:
$4,025
(% of AGI for various income ranges: 1.6% for AGIs $25k-50k, 1.5% for AGIs $50k-75k, 1.9% for AGIs $75k-100k, 3.6% for AGIs $100k-200k)
Taxes paid: $7,781 (reported on 31.6% of returns)
17536:
$7,781
State:
$9,982
(% of AGI for various income ranges: 1.4% for AGIs below $25k, 2.3% for AGIs $25k-50k, 4.8% for AGIs $50k-75k, 5.3% for AGIs $75k-100k, 9.2% for AGIs $100k-200k)
Earned income credit: $1,790 (reported on 8.8% of returns)
Here:
$1,790
State:
$2,106
(% of AGI for various income ranges: 2.3% for AGIs below $25k, 0.7% for AGIs $25k-50k)
Percentage of individuals using paid preparers for their 2012 taxes: 69.3%
Here:
69%
State:
53%
(% for various income ranges: 66.7% for AGIs below $25k, 77.8% for AGIs $25k-50k, 68.8% for AGIs $50k-75k, 63.6% for AGIs $75k-100k, 76.9% for AGIs $100k-200k)
Averages for the 2004 tax year for zip code 17536, filed in 2005:
Average Adjusted Gross Income (AGI) in 2004: $42,722 (Individual Income Tax Returns)
Here:
$42,722
State:
$48,049
Salary/wage: $39,271 (reported on 72.3% of returns)
Here:
$39,271
State:
$42,646
(% of AGI for various income ranges: 85.3% for AGIs below $10k, 56.3% for AGIs $10k-25k, 60.7% for AGIs $25k-50k, 70.4% for AGIs $50k-75k, 78.6% for AGIs $75k-100k, 61.5% for AGIs over 100k)
Taxable interest for individuals: $1,797 (reported on 54.5% of returns)
This zip code:
$1,797
Pennsylvania:
$1,657
(% of AGI for various income ranges: 11.7% for AGIs below $10k, 4.2% for AGIs $10k-25k, 2.4% for AGIs $25k-50k, 2.6% for AGIs $50k-75k, 0.8% for AGIs $75k-100k, 1.6% for AGIs over 100k)
Taxable dividends: $2,912 (reported on 27.4% of returns)
Here:
$2,912
State:
$3,566
(% of AGI for various income ranges: 7.0% for AGIs below $10k, 2.1% for AGIs $10k-25k, 1.1% for AGIs $25k-50k, 1.0% for AGIs $50k-75k, 0.8% for AGIs $75k-100k, 3.5% for AGIs over 100k)
Net capital gain/loss: +$10,851 (reported on 24.3% of returns)
Here:
+$10,851
State:
+$9,716
(% of AGI for various income ranges: -2.1% for AGIs below $10k, 0.5% for AGIs $10k-25k, 3.2% for AGIs $25k-50k, 2.4% for AGIs $50k-75k, 2.3% for AGIs $75k-100k, 16.9% for AGIs over 100k)
Profit/loss from business: +$10,684 (reported on 24.8% of returns)
Here:
+$10,684
State:
+$14,267
(% of AGI for various income ranges: 24.3% for AGIs below $10k, 14.2% for AGIs $10k-25k, 8.8% for AGIs $25k-50k, 6.1% for AGIs $50k-75k, 2.0% for AGIs $75k-100k, 3.1% for AGIs over 100k)
Profit/loss from farming: +$13,082 (reported on 11.4% of returns)
Here:
+$13,082
State:
+$274
(% of AGI for various income ranges: -4.4% for AGIs below $10k, 10.5% for AGIs $10k-25k, 10.7% for AGIs $25k-50k, 1.7% for AGIs $50k-75k)
IRA payment deduction: $2,920 (reported on 2.3% of returns)
17536:
$2,920
Pennsylvania:
$2,903
Total itemized deductions: $17,538 (23% of AGI, reported on 31.5% of returns)
Here:
$17,538
State:
$18,804
Here:
22.6% of AGI
State:
19.5% of AGI
(% of AGI for various income ranges: 9.5% for AGIs $10k-25k, 12.1% for AGIs $25k-50k, 14.5% for AGIs $50k-75k, 15.5% for AGIs $75k-100k, 12.5% for AGIs over 100k)
Charity contributions deductions: $3,457 (4% of AGI, reported on 28.0% of returns)
Here:
$3,457
State:
$3,337
Here:
4.3% of AGI
State:
3.3% of AGI
(% of AGI for various income ranges: 1.1% for AGIs $10k-25k, 2.1% for AGIs $25k-50k, 2.5% for AGIs $50k-75k, 1.8% for AGIs $75k-100k, 3.1% for AGIs over 100k)
Total tax: $5,915 (reported on 67.8% of returns)
17536:
$5,915
State:
$8,008
(% of AGI for various income ranges: 3.4% for AGIs below $10k, 4.1% for AGIs $10k-25k, 5.7% for AGIs $25k-50k, 7.8% for AGIs $50k-75k, 10.1% for AGIs $75k-100k, 15.3% for AGIs over 100k)
Earned income credit: $1,462 (reported on 7.5% of returns)
Here:
$1,462
State:
$1,643
Percentage of individuals using paid preparers for their 2004 taxes: 67.3%
Here:
67%
State:
56%
(% for various income ranges: 58.9% for AGIs below $10k, 74.5% for AGIs $10k-25k, 69.9% for AGIs $25k-50k, 68.0% for AGIs $50k-75k, 58.6% for AGIs $75k-100k, 68.8% for AGIs over 100k)
Household received Food Stamps/SNAP in the past 12 months: 30 Household did not receive Food Stamps/SNAP in the past 12 months: 1,088
Women who had a birth in the past 12 months: 83 (89 now married, 0 unmarried) Women who did not have a birth in the past 12 months: 804 (316 now married, 488 unmarried)
Housing units in zip code 17536 with a mortgage: 666 (120 second mortgage, 112 both second mortgage and home equity loan) Houses without a mortgage: 11
Median monthly owner costs for units with a mortgage: $1,704 Median monthly owner costs for units without a mortgage: $608
Residents with income below the poverty level in 2022:
This zip code:
18.0%
Whole state:
11.8%
Residents with income below 50% of the poverty level in 2022:
This zip code:
10.6%
Whole state:
6.1%
Median number of rooms in houses and condos:
Here:
6.9
State:
6.8
Median number of rooms in apartments:
Here:
6.0
State:
4.3
Notable locations in this zip code not listed on our city pages
Size of family households: 588 2-persons, 63 3-persons, 109 4-persons, 94 5-persons, 64 6-persons, 119 7-or-more-persons
Size of nonfamily households: 59 1-person, 18 2-persons, 10 5-persons
1,162 married couples with children.
14 single-parent households (14 women).
53.6% of residents of 17536 zip code speak English at home.
0.7% of residents speak Spanish at home (74% very well, 26% not well).
47.0% of residents speak other Indo-European language at home (56% very well, 38% well, 6% not well).
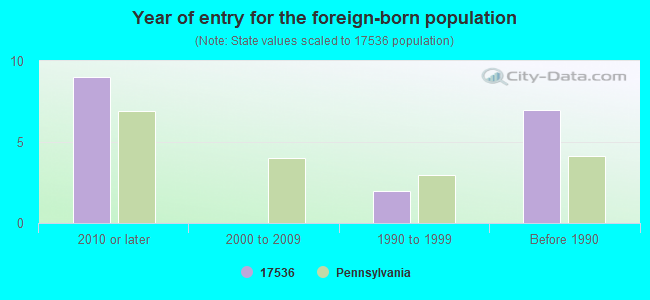
Foreign born population: 17 (0.5%) (100.0% of them are naturalized citizens)
This zip code:
0.5%
Whole state:
7.5%
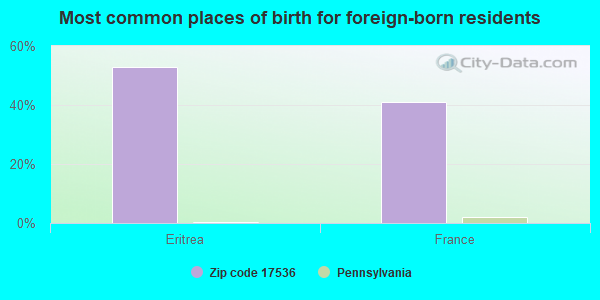
53%Eritrea
41%France
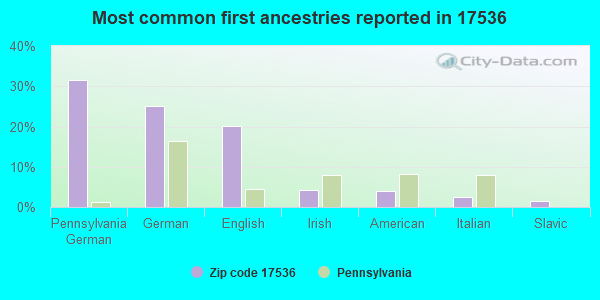
32%Pennsylvania German
25%German
20%English
4%Irish
4%American
3%Italian
2%Slavic
Year of entry for the foreign-born population
92010 or later
02000 to 2009
21990 to 1999
7Before 1990
Housing units lacking complete plumbing facilities: 2.2% Housing units lacking complete kitchen facilities: 4.5%
28.3%Bottled, tank, or LP gas
28.0%Fuel oil, kerosene, etc.
14.2%Coal or coke
13.9%Electricity
11.3%Wood
1.9%Utility gas
1.4%No fuel used
1.0%Other fuel
Population in 1990: 2,384. Population change in the 1990s: +172 (+7.2%).
Place of birth for U.S.-born residents:
This state: 3,036
Northeast: 114
Midwest: 38
South: 363
West: 11
77% of the 17536 zip code residents lived in the same house 5 years ago. Out of people who lived in different houses, 76% lived in this county. Out of people who lived in different counties, 50% lived in Pennsylvania.
97% of the 17536 zip code residents lived in the same house 1 year ago. Out of people who lived in different houses, 49% moved from this county. Out of people who lived in different houses, 46% moved from different county within same state. Out of people who lived in different houses, 13% moved from different state.
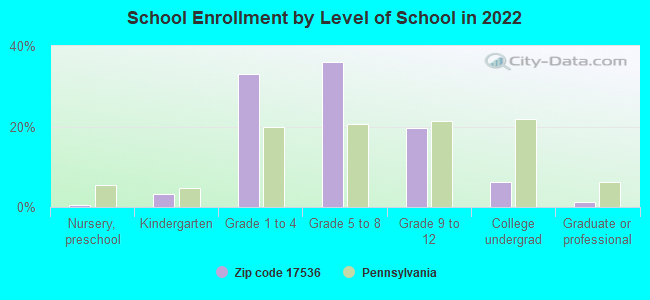
Private vs. public school enrollment:
Students in private schools in grades 1 to 8 (elementary and middle school): 373
Here:
65.1%
Pennsylvania:
15.7%
Students in private schools in grades 9 to 12 (high school): 23
Here:
14.7%
Pennsylvania:
13.4%
Students in private undergraduate colleges: 20
Here:
41.3%
Pennsylvania:
39.8%
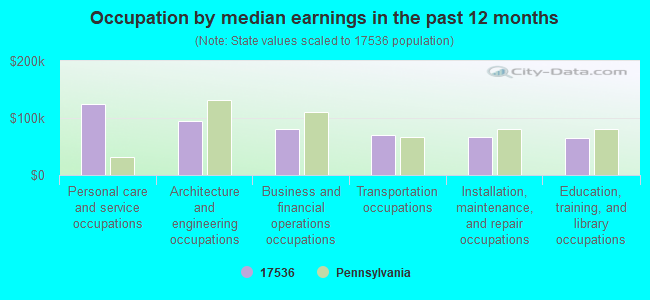
Occupation by median earnings in the past 12 months ($)
123,881Personal care and service occupations
94,187Architecture and engineering occupations
81,262Business and financial operations occupations
70,259Transportation occupations
67,335Installation, maintenance, and repair occupations
65,558Education, training, and library occupations
Top industries in this zip code by the number of employees in 2005:
Other Services (except Public Administration): Religious Organizations (5-9 employees: 1 establishment, 1-4 employees: 1 establishment)
Construction: Plumbing, Heating, and Air-Conditioning Contractors (5-9: 1, 1-4: 1)
Construction: New Single-Family Housing Construction (except Operative Builders) (1-4: 2)
Accommodation and Food Services: Snack and Nonalcoholic Beverage Bars (1-4: 1)
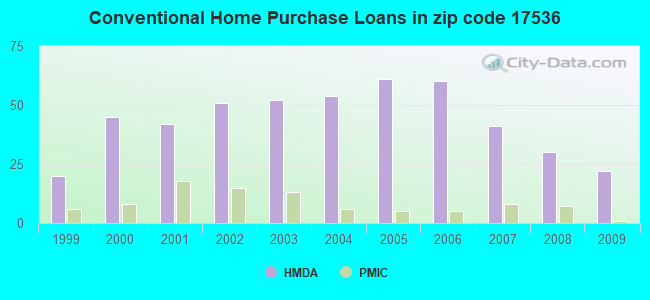
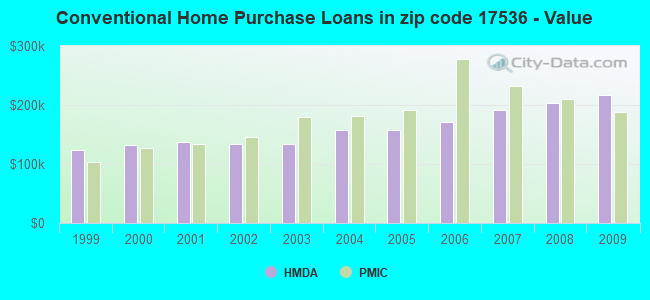
Home Mortgage Disclosure Act Aggregated Statistics For Year 2009 (Based on 2 partial tracts)
A) FHA, FSA/RHS & VA Home Purchase Loans
B) Conventional Home Purchase Loans
C) Refinancings
D) Home Improvement Loans
F) Non-occupant Loans on < 5 Family Dwellings (A B C & D)
G) Loans On Manufactured Home Dwelling (A B C & D)
Number
Average Value
Number
Average Value
Number
Average Value
Number
Average Value
Number
Average Value
Number
Average Value
LOANS ORIGINATED
4
$282,162
22
$216,842
129
$191,791
10
$78,269
5
$188,232
2
$75,890
APPLICATIONS APPROVED, NOT ACCEPTED
0
$0
3
$160,207
16
$203,019
1
$60,260
0
$0
1
$27,530
APPLICATIONS DENIED
3
$158,720
3
$190,960
43
$217,023
3
$24,553
1
$251,470
4
$77,190
APPLICATIONS WITHDRAWN
0
$0
1
$392,090
22
$183,870
1
$116,810
1
$29,760
1
$112,340
FILES CLOSED FOR INCOMPLETENESS
1
$172,610
1
$93,740
5
$210,106
0
$0
0
$0
1
$128,710
Aggregated Statistics For Year 2008 (Based on 2 partial tracts)
A) FHA, FSA/RHS & VA Home Purchase Loans
B) Conventional Home Purchase Loans
C) Refinancings
D) Home Improvement Loans
F) Non-occupant Loans on < 5 Family Dwellings (A B C & D)
G) Loans On Manufactured Home Dwelling (A B C & D)
Number
Average Value
Number
Average Value
Number
Average Value
Number
Average Value
Number
Average Value
Number
Average Value
LOANS ORIGINATED
6
$211,172
30
$203,633
90
$177,403
21
$39,645
8
$182,188
4
$120,342
APPLICATIONS APPROVED, NOT ACCEPTED
1
$162,190
2
$197,160
14
$128,287
3
$9,920
1
$76,630
1
$37,200
APPLICATIONS DENIED
1
$300,580
7
$266,883
39
$188,518
15
$77,823
1
$237,340
4
$42,035
APPLICATIONS WITHDRAWN
0
$0
4
$150,660
13
$195,844
2
$127,595
0
$0
0
$0
FILES CLOSED FOR INCOMPLETENESS
0
$0
2
$102,300
4
$175,955
1
$26,780
1
$71,420
1
$71,420
Aggregated Statistics For Year 2007 (Based on 2 partial tracts)
A) FHA, FSA/RHS & VA Home Purchase Loans
B) Conventional Home Purchase Loans
C) Refinancings
D) Home Improvement Loans
F) Non-occupant Loans on < 5 Family Dwellings (A B C & D)
G) Loans On Manufactured Home Dwelling (A B C & D)
Number
Average Value
Number
Average Value
Number
Average Value
Number
Average Value
Number
Average Value
Number
Average Value
LOANS ORIGINATED
2
$169,630
41
$191,517
100
$145,102
40
$61,659
6
$146,568
7
$90,769
APPLICATIONS APPROVED, NOT ACCEPTED
0
$0
7
$169,739
16
$167,261
8
$57,195
0
$0
4
$72,912
APPLICATIONS DENIED
0
$0
10
$170,897
54
$180,792
10
$78,194
1
$412,920
5
$72,168
APPLICATIONS WITHDRAWN
0
$0
4
$176,700
16
$197,718
1
$247,750
0
$0
0
$0
FILES CLOSED FOR INCOMPLETENESS
0
$0
1
$91,510
9
$201,789
0
$0
0
$0
1
$179,300
Aggregated Statistics For Year 2006 (Based on 2 partial tracts)
A) FHA, FSA/RHS & VA Home Purchase Loans
B) Conventional Home Purchase Loans
C) Refinancings
D) Home Improvement Loans
F) Non-occupant Loans on < 5 Family Dwellings (A B C & D)
G) Loans On Manufactured Home Dwelling (A B C & D)
Number
Average Value
Number
Average Value
Number
Average Value
Number
Average Value
Number
Average Value
Number
Average Value
LOANS ORIGINATED
2
$210,925
60
$171,033
108
$141,952
39
$54,407
8
$164,052
6
$106,888
APPLICATIONS APPROVED, NOT ACCEPTED
1
$128,710
12
$166,780
15
$192,597
1
$195,670
1
$572,880
1
$245,520
APPLICATIONS DENIED
1
$139,130
10
$204,302
42
$156,488
13
$109,768
4
$239,195
9
$73,573
APPLICATIONS WITHDRAWN
0
$0
7
$229,151
42
$159,588
6
$104,037
1
$114,580
2
$148,430
FILES CLOSED FOR INCOMPLETENESS
0
$0
1
$185,260
11
$182,618
1
$139,130
0
$0
0
$0
Aggregated Statistics For Year 2005 (Based on 2 partial tracts)
B) Conventional Home Purchase Loans
C) Refinancings
D) Home Improvement Loans
F) Non-occupant Loans on < 5 Family Dwellings (A B C & D)
G) Loans On Manufactured Home Dwelling (A B C & D)
Number
Average Value
Number
Average Value
Number
Average Value
Number
Average Value
Number
Average Value
LOANS ORIGINATED
61
$157,984
125
$148,312
44
$46,838
8
$91,140
8
$61,938
APPLICATIONS APPROVED, NOT ACCEPTED
10
$137,789
16
$148,754
3
$45,137
1
$124,250
2
$91,510
APPLICATIONS DENIED
13
$106,850
63
$165,227
13
$44,869
1
$75,140
11
$78,391
APPLICATIONS WITHDRAWN
5
$139,574
57
$161,996
11
$145,485
1
$193,440
1
$37,200
FILES CLOSED FOR INCOMPLETENESS
4
$181,908
13
$177,244
0
$0
0
$0
0
$0
Aggregated Statistics For Year 2004 (Based on 2 partial tracts)
A) FHA, FSA/RHS & VA Home Purchase Loans
B) Conventional Home Purchase Loans
C) Refinancings
D) Home Improvement Loans
F) Non-occupant Loans on < 5 Family Dwellings (A B C & D)
G) Loans On Manufactured Home Dwelling (A B C & D)
Number
Average Value
Number
Average Value
Number
Average Value
Number
Average Value
Number
Average Value
Number
Average Value
LOANS ORIGINATED
1
$178,560
54
$156,860
127
$139,005
39
$55,209
2
$207,575
4
$41,850
APPLICATIONS APPROVED, NOT ACCEPTED
1
$128,710
8
$107,880
25
$124,843
3
$46,377
0
$0
4
$100,068
APPLICATIONS DENIED
1
$152,520
8
$304,854
62
$189,048
13
$55,628
4
$112,345
6
$84,443
APPLICATIONS WITHDRAWN
0
$0
10
$136,673
48
$166,997
4
$47,245
2
$146,195
2
$91,885
FILES CLOSED FOR INCOMPLETENESS
0
$0
0
$0
25
$164,037
1
$14,880
0
$0
0
$0
Aggregated Statistics For Year 2003 (Based on 2 partial tracts)
A) FHA, FSA/RHS & VA Home Purchase Loans
B) Conventional Home Purchase Loans
C) Refinancings
D) Home Improvement Loans
F) Non-occupant Loans on < 5 Family Dwellings (A B C & D)
Number
Average Value
Number
Average Value
Number
Average Value
Number
Average Value
Number
Average Value
LOANS ORIGINATED
2
$178,190
52
$133,605
252
$117,593
26
$33,251
7
$88,643
APPLICATIONS APPROVED, NOT ACCEPTED
1
$47,620
10
$87,346
33
$118,792
1
$36,460
0
$0
APPLICATIONS DENIED
1
$94,490
10
$106,690
68
$143,690
10
$42,854
1
$133,920
APPLICATIONS WITHDRAWN
0
$0
2
$94,860
57
$148,604
2
$48,360
1
$143,590
FILES CLOSED FOR INCOMPLETENESS
0
$0
4
$177,072
4
$184,325
1
$68,450
0
$0
Aggregated Statistics For Year 2002 (Based on 2 partial tracts)
A) FHA, FSA/RHS & VA Home Purchase Loans
B) Conventional Home Purchase Loans
C) Refinancings
D) Home Improvement Loans
F) Non-occupant Loans on < 5 Family Dwellings (A B C & D)
Number
Average Value
Number
Average Value
Number
Average Value
Number
Average Value
Number
Average Value
LOANS ORIGINATED
3
$138,137
51
$133,161
148
$110,519
28
$32,338
6
$76,757
APPLICATIONS APPROVED, NOT ACCEPTED
0
$0
4
$55,800
21
$129,350
4
$34,225
1
$19,340
APPLICATIONS DENIED
0
$0
6
$96,968
56
$113,991
8
$23,158
2
$78,120
APPLICATIONS WITHDRAWN
0
$0
1
$96,720
35
$112,280
4
$22,135
1
$40,180
FILES CLOSED FOR INCOMPLETENESS
0
$0
0
$0
9
$122,760
0
$0
0
$0
Aggregated Statistics For Year 2001 (Based on 2 partial tracts)
A) FHA, FSA/RHS & VA Home Purchase Loans
B) Conventional Home Purchase Loans
C) Refinancings
D) Home Improvement Loans
F) Non-occupant Loans on < 5 Family Dwellings (A B C & D)
Number
Average Value
Number
Average Value
Number
Average Value
Number
Average Value
Number
Average Value
LOANS ORIGINATED
6
$138,383
42
$136,666
99
$107,655
30
$24,726
3
$102,673
APPLICATIONS APPROVED, NOT ACCEPTED
0
$0
7
$98,314
13
$102,729
4
$36,828
1
$37,940
APPLICATIONS DENIED
1
$99,700
11
$69,598
40
$105,108
4
$21,948
1
$62,500
APPLICATIONS WITHDRAWN
1
$144,340
3
$92,257
28
$129,615
3
$32,240
1
$65,470
FILES CLOSED FOR INCOMPLETENESS
0
$0
0
$0
2
$46,500
0
$0
0
$0
Aggregated Statistics For Year 2000 (Based on 2 partial tracts)
A) FHA, FSA/RHS & VA Home Purchase Loans
B) Conventional Home Purchase Loans
C) Refinancings
D) Home Improvement Loans
F) Non-occupant Loans on < 5 Family Dwellings (A B C & D)
Number
Average Value
Number
Average Value
Number
Average Value
Number
Average Value
Number
Average Value
LOANS ORIGINATED
6
$122,017
45
$131,721
37
$67,201
33
$16,706
6
$87,297
APPLICATIONS APPROVED, NOT ACCEPTED
0
$0
4
$163,122
7
$97,357
10
$28,421
1
$10,420
APPLICATIONS DENIED
0
$0
16
$67,006
19
$70,954
7
$17,324
2
$40,920
APPLICATIONS WITHDRAWN
0
$0
7
$147,524
28
$123,557
4
$20,088
1
$176,330
FILES CLOSED FOR INCOMPLETENESS
1
$115,320
1
$171,120
1
$154,750
1
$22,320
0
$0
Aggregated Statistics For Year 1999 (Based on 1 partial tract)
A) FHA, FSA/RHS & VA Home Purchase Loans
B) Conventional Home Purchase Loans
C) Refinancings
D) Home Improvement Loans
F) Non-occupant Loans on < 5 Family Dwellings (A B C & D)
Detailed PMIC statistics for the following Tracts:0146.02
2002 - 2018 National Fire Incident Reporting System (NFIRS) incidents
Based on the data from the years 2002 - 2018 the average number of fire incidents per year is 9. The highest number of fires - 19 took place in 2012, and the least - 0 in 2003. The data has a constant trend.
When looking into fire subcategories, the most incidents belonged to: Other (44.5%), and Structure Fires (30.8%).
Fire incident types reported to NFIRS in Zip Code 17536


 Nearest zip codes: 17509, 17566, 19362, 19363, 17562, 19310.
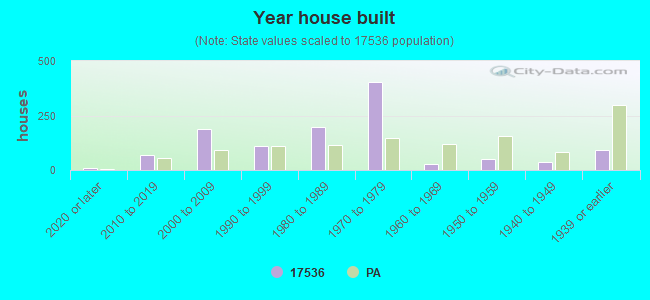


 Based on the data from the years 2002 - 2018 the average number of fire incidents per year is 9. The highest number of fires - 19 took place in 2012, and the least - 0 in 2003. The data has a constant trend.
 When looking into fire subcategories, the most incidents belonged to: Other (44.5%), and Structure Fires (30.8%).