Estimated zip code population in 2022: 423 Zip code population in 2010: 823 Zip code population in 2000: 927
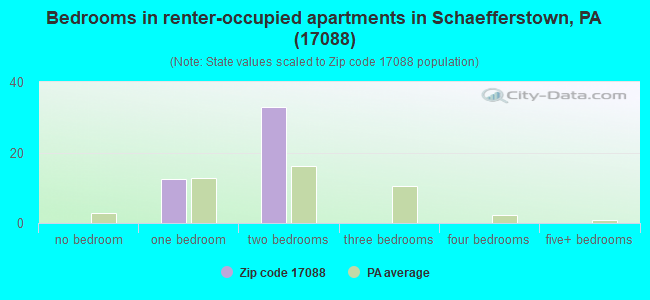
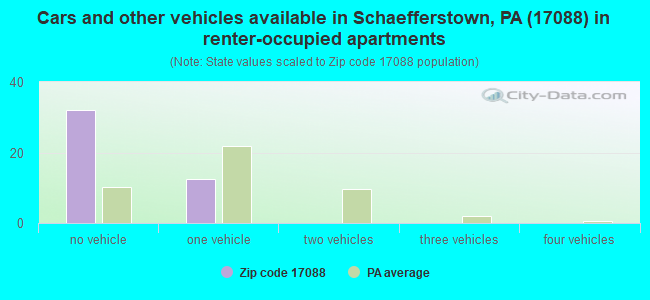
Houses and condos: 236 Renter-occupied apartments: 44
% of renters here:
26%
State:
31%
March 2022 cost of living index in zip code 17088: 89.2 (less than average, U.S. average is 100)
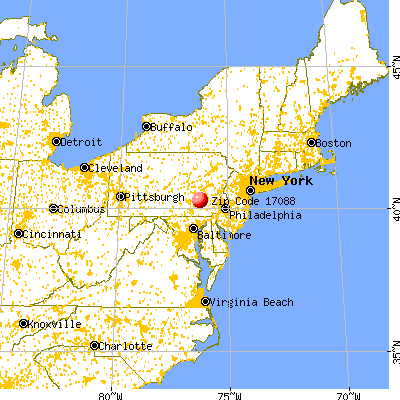
Land area: 1.8 sq. mi. Water area: 0.0 sq. mi.
Population density: 231 people per square mile
(very low).
OSM Map
General Map
Google Map
MSN Map
OSM Map
General Map
Google Map
MSN Map
OSM Map
General Map
Google Map
MSN Map
OSM Map
General Map
Google Map
MSN Map
Please wait while loading the map...
Real estate property taxes paid for housing units in 2022:
This zip code:
1.1% ($2,638)
Pennsylvania:
1.3% ($3,094)
Median real estate property taxes paid for housing units with mortgages in 2022: $2,742 (1.2%) Median real estate property taxes paid for housing units with no mortgage in 2022: $2,325 (0.9%)
Business Search- 14 Million verified businesses
Males: 229
(54.2%)
Females: 193
(45.8%)
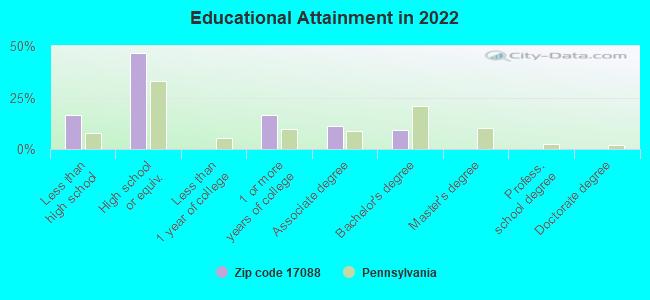
For population 25 years and over in 17088:
High school or higher: 82.7%
Bachelor's degree or higher: 9.1%
Graduate or professional degree: 0.0%
Mean travel time to work (commute): 21.5 minutes
For population 15 years and over in 17088:
Never married: 14.1%
Now married: 79.4%
Separated: 0.0%
Widowed: 0.0%
Divorced: 6.5%
Zip code 17088 compared to state average:
Unemployed percentage significantly below state average.
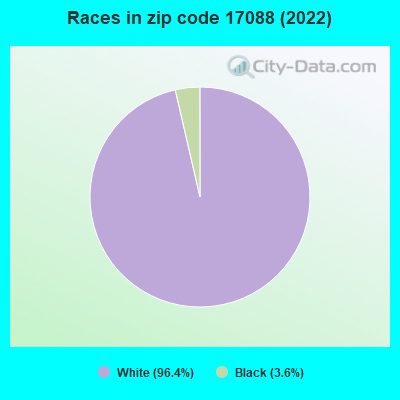
Black race population percentage below state average.
Hispanic race population percentage significantly below state average.
Median age significantly above state average.
Foreign-born population percentage significantly below state average.
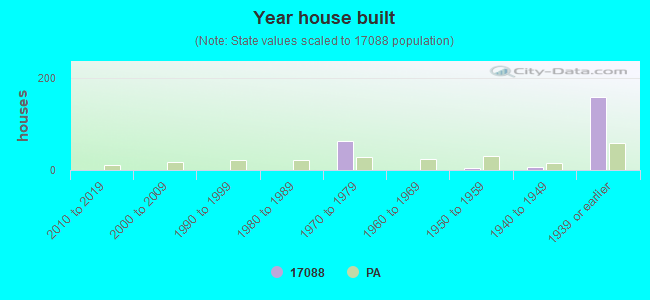
House age above state average.
Number of college students below state average.
Percentage of population with a bachelor's degree or higher significantly below state average.
Estimated median house/condo value in 2022: $240,290
17088:
$240,290
Pennsylvania:
$245,500
Median resident age:
This zip code:
60.5 years
Pennsylvania median age:
40.9 years
Average household size:
This zip code:
2.5 people
Pennsylvania:
2.4 people
Averages for the 2004 tax year for zip code 17088, filed in 2005:
Average Adjusted Gross Income (AGI) in 2004: $40,956 (Individual Income Tax Returns)
Here:
$40,956
State:
$48,049
Salary/wage: $37,483 (reported on 83.8% of returns)
Here:
$37,483
State:
$42,646
(% of AGI for various income ranges: 73.0% for AGIs below $10k, 64.6% for AGIs $10k-25k, 87.3% for AGIs $25k-50k, 81.9% for AGIs $50k-75k, 77.5% for AGIs $75k-100k, 61.9% for AGIs over 100k)
Taxable interest for individuals: $829 (reported on 50.2% of returns)
This zip code:
$829
Pennsylvania:
$1,657
(% of AGI for various income ranges: 7.3% for AGIs below $10k, 4.1% for AGIs $10k-25k, 0.7% for AGIs $25k-50k, 0.3% for AGIs $50k-75k, 0.1% for AGIs $75k-100k, 1.1% for AGIs over 100k)
Taxable dividends: $1,033 (reported on 28.0% of returns)
Here:
$1,033
State:
$3,566
(% of AGI for various income ranges: 2.3% for AGIs below $10k, 1.3% for AGIs $10k-25k, 0.6% for AGIs $25k-50k, 0.1% for AGIs $50k-75k, 0.5% for AGIs $75k-100k, 1.3% for AGIs over 100k)
Net capital gain/loss: +$1,169 (reported on 15.0% of returns)
Here:
+$1,169
State:
+$9,716
(% of AGI for various income ranges: 2.1% for AGIs below $10k, -0.1% for AGIs $25k-50k, -0.1% for AGIs $75k-100k, 2.1% for AGIs over 100k)
Profit/loss from business: +$5,926 (reported on 12.5% of returns)
Here:
+$5,926
State:
+$14,267
(% of AGI for various income ranges: 6.0% for AGIs $10k-25k, 2.1% for AGIs $50k-75k, 3.9% for AGIs $75k-100k)
Total itemized deductions: $13,733 (19% of AGI, reported on 24.3% of returns)
Here:
$13,733
State:
$18,804
Here:
18.6% of AGI
State:
19.5% of AGI
(% of AGI for various income ranges: 8.5% for AGIs $25k-50k, 8.4% for AGIs $50k-75k, 8.6% for AGIs $75k-100k, 11.5% for AGIs over 100k)
Charity contributions deductions: $3,446 (4% of AGI, reported on 19.2% of returns)
Here:
$3,446
State:
$3,337
Here:
4.2% of AGI
State:
3.3% of AGI
(% of AGI for various income ranges: 0.7% for AGIs $25k-50k, 1.4% for AGIs $50k-75k, 2.0% for AGIs $75k-100k, 3.6% for AGIs over 100k)
Total tax: $5,250 (reported on 78.7% of returns)
17088:
$5,250
State:
$8,008
(% of AGI for various income ranges: 2.1% for AGIs below $10k, 4.6% for AGIs $10k-25k, 7.0% for AGIs $25k-50k, 9.0% for AGIs $50k-75k, 11.7% for AGIs $75k-100k, 17.0% for AGIs over 100k)
Earned income credit: $1,667 (reported on 6.9% of returns)
Here:
$1,667
State:
$1,643
Percentage of individuals using paid preparers for their 2004 taxes: 68.1%
Here:
68%
State:
56%
(% for various income ranges: 64.0% for AGIs below $10k, 72.2% for AGIs $10k-25k, 68.6% for AGIs $25k-50k, 69.4% for AGIs $50k-75k, 57.9% for AGIs $75k-100k, 76.0% for AGIs over 100k)
Household received Food Stamps/SNAP in the past 12 months: 50 Household did not receive Food Stamps/SNAP in the past 12 months: 123
Women who had a birth in the past 12 months: 18 (19 now married, 0 unmarried) Women who did not have a birth in the past 12 months: 37 (20 now married, 17 unmarried)
Housing units in zip code 17088 with a mortgage: 77 (27 second mortgage, 27 both second mortgage and home equity loan) Median monthly owner costs for units with a mortgage: $1,344 Median monthly owner costs for units without a mortgage: $801
Residents with income below the poverty level in 2022:
This zip code:
15.0%
Whole state:
11.8%
Residents with income below 50% of the poverty level in 2022:
This zip code:
15.0%
Whole state:
6.1%
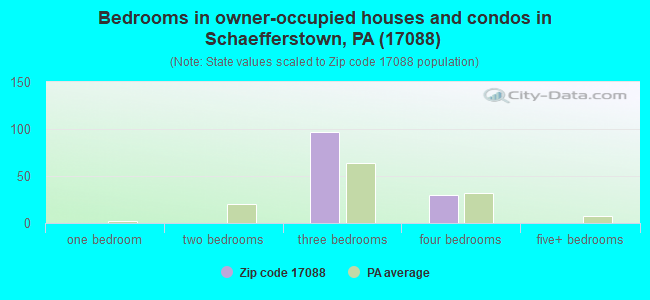
Median number of rooms in houses and condos:
Here:
7.6
State:
6.8
Notable locations in this zip code not listed on our city pages
Size of family households: 113 2-persons, 35 3-persons, 4 5-persons
Size of nonfamily households: 12 1-person, 6 4-persons
27 married couples with children.
0 single-parent households ().
100.2% of residents of 17088 zip code speak English at home.
Foreign born population: 0 (0.0%)
:
0.0%
Whole state:
7.5%
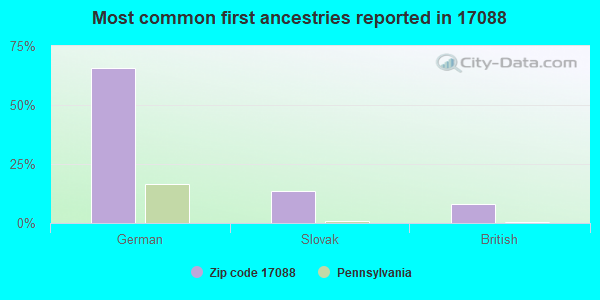
66%German
13%Slovak
8%British
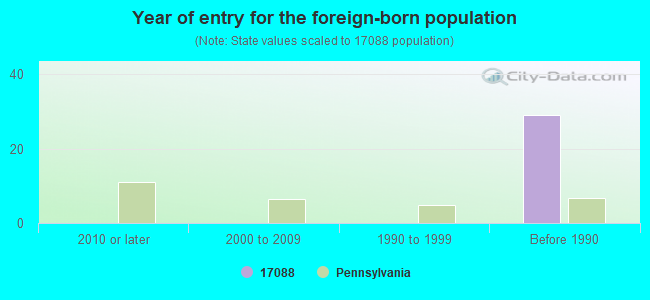
Year of entry for the foreign-born population
02010 or later
02000 to 2009
01990 to 1999
29Before 1990
Facilities with environmental interests located in this zip code:
BIRCHWOOD AUTO & TRUCK (500 W. MAIN ST. in SCHAEFFERSTOWN, PA)
AIR MINOR (AIRS/AFS) Business SIC classification: TRUCK RENTAL AND LEASING, WITHOUT DRIVERS
81.7%Fuel oil, kerosene, etc.
19.1%Coal or coke
Place of birth for U.S.-born residents:
This state: 355
Northeast: 31
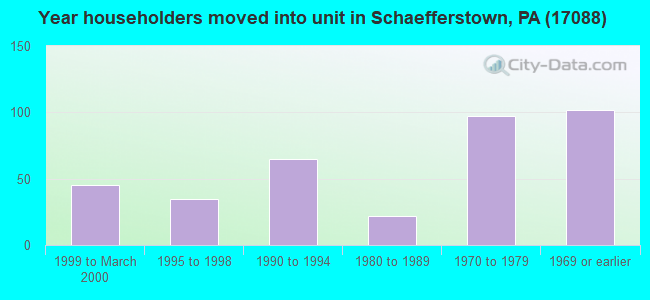
78% of the 17088 zip code residents lived in the same house 5 years ago. Out of people who lived in different houses, 54% lived in this county. Out of people who lived in different counties, 50% lived in Pennsylvania.
101% of the 17088 zip code residents lived in the same house 1 year ago.
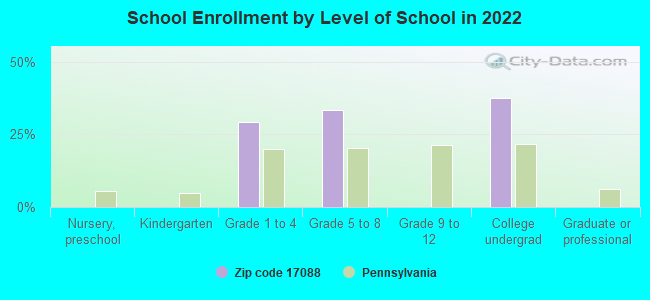
Private vs. public school enrollment:
Students in private schools in grades 1 to 8 (elementary and middle school): 7
Here:
46.1%
Pennsylvania:
15.7%
Students in private undergraduate colleges: 9
Here:
100.0%
Pennsylvania:
39.8%
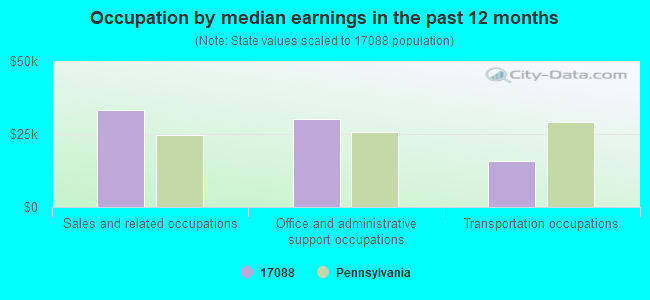
Occupation by median earnings in the past 12 months ($)
33,432Sales and related occupations
30,297Office and administrative support occupations
15,861Transportation occupations
Top industries in this zip code by the number of employees in 2005:
Administrative and Support and Waste Management and Remediation Services: Solid Waste Collection (100-249 employees: 1 establishment)
Accommodation and Food Services: Full-Service Restaurants (20-49: 1, 5-9: 1)
Health Care and Social Assistance: Offices of Physicians (except Mental Health Specialists) (10-19: 1)
Other Services (except Public Administration): Religious Organizations (5-9: 1, 1-4: 2)
Wholesale Trade: Plumbing and Heating Equipment and Supplies (Hydronics) Merchant Wholesalers (5-9: 1)
Fatal accident statistics in 2012:
Fatal accident count: 1
Vehicles involved in fatal accidents: 3
Fatal accidents caused by drunken drivers: 0
Fatalities: 1
Persons involved in fatal accidents: 7
Pedestrians involved in fatal accidents: 0
Home Mortgage Disclosure Act Aggregated Statistics For Year 2009 (Based on 2 partial tracts)
A) FHA, FSA/RHS & VA Home Purchase Loans
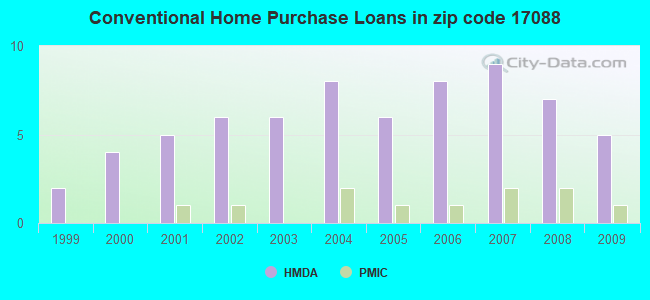
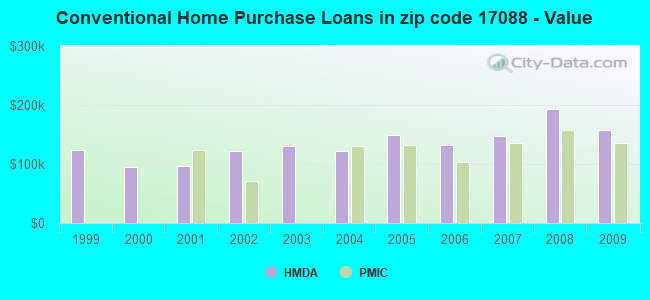
B) Conventional Home Purchase Loans
C) Refinancings
D) Home Improvement Loans
F) Non-occupant Loans on < 5 Family Dwellings (A B C & D)
Number
Average Value
Number
Average Value
Number
Average Value
Number
Average Value
Number
Average Value
LOANS ORIGINATED
2
$117,960
5
$157,838
15
$148,107
3
$100,340
2
$147,190
APPLICATIONS APPROVED, NOT ACCEPTED
0
$0
0
$0
1
$281,280
0
$0
0
$0
APPLICATIONS DENIED
0
$0
1
$104,960
5
$175,110
0
$0
0
$0
APPLICATIONS WITHDRAWN
0
$0
0
$0
3
$123,813
0
$0
0
$0
FILES CLOSED FOR INCOMPLETENESS
0
$0
0
$0
1
$111,600
0
$0
0
$0
Aggregated Statistics For Year 2008 (Based on 2 partial tracts)
B) Conventional Home Purchase Loans
C) Refinancings
D) Home Improvement Loans
F) Non-occupant Loans on < 5 Family Dwellings (A B C & D)
Number
Average Value
Number
Average Value
Number
Average Value
Number
Average Value
LOANS ORIGINATED
7
$193,650
13
$121,151
3
$120,903
2
$171,485
APPLICATIONS APPROVED, NOT ACCEPTED
0
$0
2
$142,350
0
$0
0
$0
APPLICATIONS DENIED
1
$62,060
5
$153,966
1
$82,560
0
$0
APPLICATIONS WITHDRAWN
1
$106,100
2
$152,220
0
$0
0
$0
FILES CLOSED FOR INCOMPLETENESS
0
$0
1
$157,720
0
$0
0
$0
Aggregated Statistics For Year 2007 (Based on 2 partial tracts)
B) Conventional Home Purchase Loans
C) Refinancings
D) Home Improvement Loans
F) Non-occupant Loans on < 5 Family Dwellings (A B C & D)
Number
Average Value
Number
Average Value
Number
Average Value
Number
Average Value
LOANS ORIGINATED
9
$148,129
11
$105,960
6
$45,425
2
$147,380
APPLICATIONS APPROVED, NOT ACCEPTED
1
$141,590
2
$92,245
0
$0
0
$0
APPLICATIONS DENIED
1
$162,660
10
$138,573
2
$61,685
0
$0
APPLICATIONS WITHDRAWN
0
$0
3
$167,403
1
$63,200
0
$0
FILES CLOSED FOR INCOMPLETENESS
0
$0
1
$177,080
0
$0
0
$0
Aggregated Statistics For Year 2006 (Based on 2 partial tracts)
A) FHA, FSA/RHS & VA Home Purchase Loans
B) Conventional Home Purchase Loans
C) Refinancings
D) Home Improvement Loans
F) Non-occupant Loans on < 5 Family Dwellings (A B C & D)
Number
Average Value
Number
Average Value
Number
Average Value
Number
Average Value
Number
Average Value
LOANS ORIGINATED
1
$103,820
8
$131,626
11
$94,485
7
$51,327
1
$156,400
APPLICATIONS APPROVED, NOT ACCEPTED
0
$0
1
$159,240
1
$181,070
1
$41,760
0
$0
APPLICATIONS DENIED
0
$0
1
$112,360
5
$157,686
2
$95,185
0
$0
APPLICATIONS WITHDRAWN
0
$0
0
$0
2
$128,115
0
$0
0
$0
FILES CLOSED FOR INCOMPLETENESS
0
$0
0
$0
0
$0
0
$0
0
$0
Aggregated Statistics For Year 2005 (Based on 2 partial tracts)
A) FHA, FSA/RHS & VA Home Purchase Loans
B) Conventional Home Purchase Loans
C) Refinancings
D) Home Improvement Loans
F) Non-occupant Loans on < 5 Family Dwellings (A B C & D)
Number
Average Value
Number
Average Value
Number
Average Value
Number
Average Value
Number
Average Value
LOANS ORIGINATED
1
$78,770
6
$149,783
13
$95,776
7
$49,240
2
$77,155
APPLICATIONS APPROVED, NOT ACCEPTED
0
$0
1
$52,200
2
$129,065
1
$19,550
0
$0
APPLICATIONS DENIED
0
$0
1
$61,310
6
$127,293
1
$54,470
0
$0
APPLICATIONS WITHDRAWN
0
$0
1
$93,570
5
$116,234
1
$145,010
0
$0
FILES CLOSED FOR INCOMPLETENESS
0
$0
0
$0
1
$141,400
0
$0
0
$0
Aggregated Statistics For Year 2004 (Based on 2 partial tracts)
A) FHA, FSA/RHS & VA Home Purchase Loans
B) Conventional Home Purchase Loans
C) Refinancings
D) Home Improvement Loans
F) Non-occupant Loans on < 5 Family Dwellings (A B C & D)
Number
Average Value
Number
Average Value
Number
Average Value
Number
Average Value
Number
Average Value
LOANS ORIGINATED
1
$97,370
8
$122,302
13
$95,236
5
$32,228
1
$113,310
APPLICATIONS APPROVED, NOT ACCEPTED
0
$0
0
$0
1
$91,290
1
$64,720
0
$0
APPLICATIONS DENIED
0
$0
0
$0
4
$101,020
1
$44,600
0
$0
APPLICATIONS WITHDRAWN
0
$0
1
$150,890
3
$146,907
0
$0
0
$0
FILES CLOSED FOR INCOMPLETENESS
0
$0
0
$0
1
$138,740
0
$0
0
$0
Aggregated Statistics For Year 2003 (Based on 2 partial tracts)
B) Conventional Home Purchase Loans
C) Refinancings
D) Home Improvement Loans
E) Loans on Dwellings For 5+ Families
F) Non-occupant Loans on < 5 Family Dwellings (A B C & D)
Number
Average Value
Number
Average Value
Number
Average Value
Number
Average Value
Number
Average Value
LOANS ORIGINATED
6
$130,140
30
$101,777
4
$18,695
1
$42,700
2
$47,450
APPLICATIONS APPROVED, NOT ACCEPTED
0
$0
4
$115,160
0
$0
0
$0
0
$0
APPLICATIONS DENIED
0
$0
6
$117,960
1
$21,260
0
$0
0
$0
APPLICATIONS WITHDRAWN
0
$0
5
$130,202
0
$0
0
$0
0
$0
FILES CLOSED FOR INCOMPLETENESS
0
$0
0
$0
0
$0
0
$0
0
$0
Aggregated Statistics For Year 2002 (Based on 2 partial tracts)
A) FHA, FSA/RHS & VA Home Purchase Loans
B) Conventional Home Purchase Loans
C) Refinancings
D) Home Improvement Loans
F) Non-occupant Loans on < 5 Family Dwellings (A B C & D)
Number
Average Value
Number
Average Value
Number
Average Value
Number
Average Value
Number
Average Value
LOANS ORIGINATED
1
$80,290
6
$121,598
15
$94,900
3
$30,620
1
$25,810
APPLICATIONS APPROVED, NOT ACCEPTED
0
$0
0
$0
2
$83,225
1
$33,210
0
$0
APPLICATIONS DENIED
0
$0
0
$0
6
$139,947
1
$32,270
0
$0
APPLICATIONS WITHDRAWN
0
$0
0
$0
5
$109,704
0
$0
0
$0
FILES CLOSED FOR INCOMPLETENESS
0
$0
0
$0
1
$268,950
0
$0
0
$0
Aggregated Statistics For Year 2001 (Based on 2 partial tracts)
B) Conventional Home Purchase Loans
C) Refinancings
D) Home Improvement Loans
F) Non-occupant Loans on < 5 Family Dwellings (A B C & D)
Number
Average Value
Number
Average Value
Number
Average Value
Number
Average Value
LOANS ORIGINATED
5
$96,950
11
$82,684
4
$29,798
1
$33,970
APPLICATIONS APPROVED, NOT ACCEPTED
0
$0
2
$113,215
0
$0
0
$0
APPLICATIONS DENIED
0
$0
4
$117,580
1
$22,210
0
$0
APPLICATIONS WITHDRAWN
0
$0
1
$105,150
0
$0
0
$0
FILES CLOSED FOR INCOMPLETENESS
0
$0
1
$55,800
0
$0
0
$0
Aggregated Statistics For Year 2000 (Based on 2 partial tracts)
A) FHA, FSA/RHS & VA Home Purchase Loans
B) Conventional Home Purchase Loans
C) Refinancings
D) Home Improvement Loans
F) Non-occupant Loans on < 5 Family Dwellings (A B C & D)
Number
Average Value
Number
Average Value
Number
Average Value
Number
Average Value
Number
Average Value
LOANS ORIGINATED
1
$67,760
4
$95,612
4
$57,842
5
$18,942
1
$45,740
APPLICATIONS APPROVED, NOT ACCEPTED
0
$0
0
$0
1
$33,400
1
$16,890
0
$0
APPLICATIONS DENIED
0
$0
1
$69,850
1
$138,550
1
$25,050
0
$0
APPLICATIONS WITHDRAWN
0
$0
0
$0
1
$121,850
0
$0
0
$0
FILES CLOSED FOR INCOMPLETENESS
0
$0
0
$0
0
$0
0
$0
0
$0
Aggregated Statistics For Year 1999 (Based on 1 partial tract)


 Nearest zip codes: 17073, 17039, 17067, 17016, 19544, 17543.