Estimated zip code population in 2022: 2,681 Zip code population in 2010: 2,767 Zip code population in 2000: 2,642
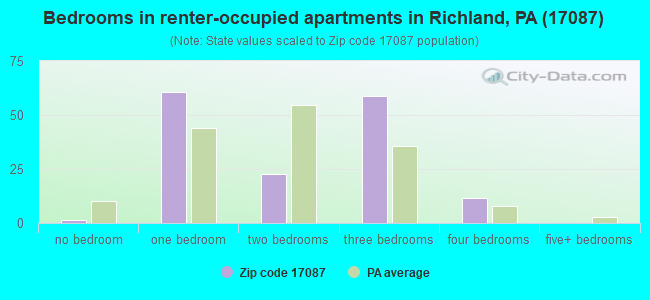
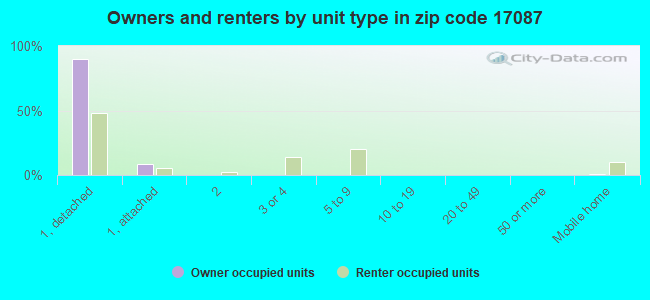
Houses and condos: 991 Renter-occupied apartments: 156
% of renters here:
17%
State:
31%
March 2022 cost of living index in zip code 17087: 94.1 (less than average, U.S. average is 100)
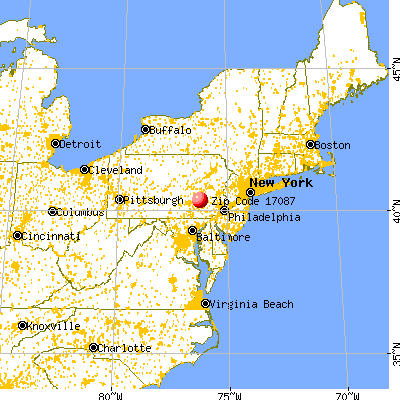
Land area: 12.3 sq. mi. Water area: 0.1 sq. mi.
Population density: 219 people per square mile
(very low).
OSM Map
General Map
Google Map
MSN Map
OSM Map
General Map
Google Map
MSN Map
OSM Map
General Map
Google Map
MSN Map
OSM Map
General Map
Google Map
MSN Map
Please wait while loading the map...
Real estate property taxes paid for housing units in 2022:
This zip code:
1.5% ($3,366)
Pennsylvania:
1.3% ($3,094)
Median real estate property taxes paid for housing units with mortgages in 2022: $3,044 (1.4%) Median real estate property taxes paid for housing units with no mortgage in 2022: $4,351 (1.6%)
Business Search- 14 Million verified businesses
Males: 1,351
(50.4%)
Females: 1,329
(49.6%)
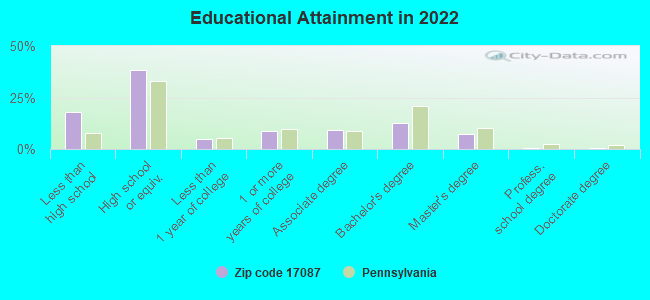
For population 25 years and over in 17087:
High school or higher: 80.0%
Bachelor's degree or higher: 20.5%
Graduate or professional degree: 8.1%
Unemployed: 2.3%
Mean travel time to work (commute): 23.5 minutes
For population 15 years and over in 17087:
Never married: 27.8%
Now married: 59.7%
Separated: 0.4%
Widowed: 5.1%
Divorced: 7.0%
Zip code 17087 compared to state average:
Unemployed percentage below state average.
Black race population percentage significantly below state average.
Hispanic race population percentage significantly below state average.
Foreign-born population percentage significantly below state average.
Renting percentage below state average.
Length of stay since moving in significantly above state average.
Percentage of population with a bachelor's degree or higher below state average.
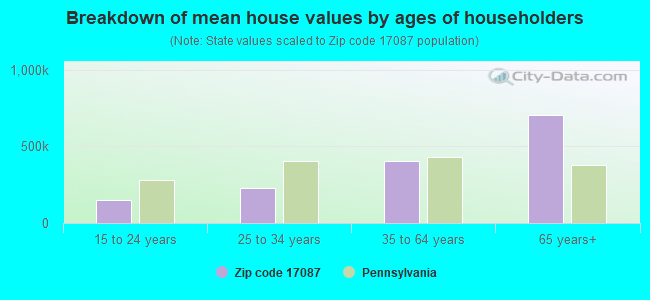
Estimated median house/condo value in 2022: $226,507
17087:
$226,507
Pennsylvania:
$245,500
According to our research of Pennsylvania and other state lists, there were 3 registered sex offenders living in 17087 zip code as of May 26, 2024. The ratio of all residents to sex offenders in zip code 17087 is 969 to 1. The ratio of registered sex offenders to all residents in this zip code is lower than the state average.
Median resident age:
This zip code:
38.4 years
Pennsylvania median age:
40.9 years
Average household size:
This zip code:
2.8 people
Pennsylvania:
2.4 people
Averages for the 2020 tax year for zip code 17087, filed in 2021:
Average Adjusted Gross Income (AGI) in 2020: $66,580 (Individual Income Tax Returns)
Here:
$66,580
State:
$75,707
Salary/wage: $52,184 (reported on 80.3% of returns)
Here:
$52,184
State:
$62,806
(% of AGI for various income ranges: 1497.2% for AGIs below $25k, 4183.5% for AGIs $25k-50k, 6838.2% for AGIs $50k-75k, 10921.0% for AGIs $75k-100k, 15215.0% for AGIs $100k-200k)
Taxable interest for individuals: $1,898 (reported on 32.8% of returns)
This zip code:
$1,898
Pennsylvania:
$1,633
(% of AGI for various income ranges: 64.4% for AGIs below $25k, 57.0% for AGIs $25k-50k, 91.2% for AGIs $50k-75k, 85.0% for AGIs $75k-100k, 175.8% for AGIs $100k-200k)
Ordinary dividends: $1,573 (reported on 19.0% of returns)
Here:
$1,573
State:
$7,382
(% of AGI for various income ranges: 27.2% for AGIs below $25k, 31.7% for AGIs $25k-50k, 45.9% for AGIs $50k-75k, 40.0% for AGIs $75k-100k, 140.8% for AGIs $100k-200k)
Net capital gain/loss in AGI: +$16,022 (reported on 16.8% of returns)
Here:
+$16,022
State:
+$23,522
(% of AGI for various income ranges: 21.1% for AGIs below $25k, 42.2% for AGIs $25k-50k, 143.5% for AGIs $50k-75k, 224.0% for AGIs $75k-100k, 2568.3% for AGIs $100k-200k)
Profit/loss from business: +$14,205 (reported on 13.9% of returns)
Here:
+$14,205
State:
+$16,274
(% of AGI for various income ranges: 178.9% for AGIs below $25k, 80.9% for AGIs $25k-50k, 185.3% for AGIs $50k-75k, 359.0% for AGIs $75k-100k, 1264.2% for AGIs $100k-200k)
Taxable individual retirement arrangement distribution: $13,133 (reported on 13.1% of returns)
17087:
$13,133
Pennsylvania:
$18,583
(% of AGI for various income ranges: 151.1% for AGIs below $25k, 157.8% for AGIs $25k-50k, 352.9% for AGIs $50k-75k, 569.0% for AGIs $75k-100k, 466.7% for AGIs $100k-200k)
Total itemized deductions: $41,288 (reported on 5.8% of returns)
Here:
$41,288
State:
$34,850
(% of AGI for various income ranges: 651.8% for AGIs $50k-75k, 1829.2% for AGIs $100k-200k)
Charity contributions: $23,329 (reported on 5.1% of returns)
Here:
$23,329
State:
$12,392
(% of AGI for various income ranges: 54.3% for AGIs $25k-50k, 1256.7% for AGIs $100k-200k)
Taxes paid: $7,288 (reported on 5.8% of returns)
17087:
$7,288
State:
$8,200
(% of AGI for various income ranges: 120.6% for AGIs $50k-75k, 315.0% for AGIs $100k-200k)
Earned income credit: $1,992 (reported on 8.8% of returns)
Here:
$1,992
State:
$2,100
(% of AGI for various income ranges: 67.8% for AGIs below $25k, 50.9% for AGIs $25k-50k)
Percentage of individuals using paid preparers for their 2020 taxes: 90.5%
Here:
91%
State:
92%
(% for various income ranges: 91.4% for AGIs below $25k, 91.4% for AGIs $25k-50k, 92.3% for AGIs $50k-75k, 88.2% for AGIs $75k-100k, 90.0% for AGIs $100k-200k, 75.0% for AGIs over 200k)
Averages for the 2012 tax year for zip code 17087, filed in 2013:
Average Adjusted Gross Income (AGI) in 2012: $50,079 (Individual Income Tax Returns)
Here:
$50,079
State:
$61,346
Salary/wage: $42,907 (reported on 80.2% of returns)
Here:
$42,907
State:
$51,902
(% of AGI for various income ranges: 63.5% for AGIs below $25k, 77.4% for AGIs $25k-50k, 76.9% for AGIs $50k-75k, 76.2% for AGIs $75k-100k, 89.2% for AGIs $100k-200k)
Taxable interest for individuals: $1,774 (reported on 38.2% of returns)
This zip code:
$1,774
Pennsylvania:
$1,588
(% of AGI for various income ranges: 3.3% for AGIs below $25k, 1.2% for AGIs $25k-50k, 1.9% for AGIs $50k-75k, 0.8% for AGIs $75k-100k, 1.5% for AGIs $100k-200k)
Ordinary dividends: $2,684 (reported on 23.7% of returns)
Here:
$2,684
State:
$5,827
(% of AGI for various income ranges: 1.6% for AGIs below $25k, 1.7% for AGIs $25k-50k, 0.6% for AGIs $50k-75k, 1.0% for AGIs $75k-100k, 2.5% for AGIs $100k-200k)
Net capital gain/loss in AGI: +$9,805 (reported on 14.5% of returns)
Here:
+$9,805
State:
+$14,495
(% of AGI for various income ranges: 1.1% for AGIs $25k-50k, 0.9% for AGIs $50k-75k, 0.9% for AGIs $75k-100k, 11.5% for AGIs $100k-200k)
Profit/loss from business: +$11,700 (reported on 13.7% of returns)
Here:
+$11,700
State:
+$16,268
(% of AGI for various income ranges: 5.3% for AGIs below $25k, 2.0% for AGIs $25k-50k, 2.0% for AGIs $50k-75k, 4.1% for AGIs $75k-100k, 5.9% for AGIs $100k-200k)
Taxable individual retirement arrangement distribution: $8,363 (reported on 14.5% of returns)
17087:
$8,363
Pennsylvania:
$14,550
(% of AGI for various income ranges: 7.5% for AGIs below $25k, 2.7% for AGIs $25k-50k, 3.3% for AGIs $50k-75k, 3.1% for AGIs $75k-100k)
Total itemized deductions: $19,786 (22% of AGI, reported on 27.5% of returns)
Here:
$19,786
State:
$23,538
Here:
21.6% of AGI
State:
18.4% of AGI
(% of AGI for various income ranges: 7.3% for AGIs below $25k, 9.5% for AGIs $25k-50k, 9.6% for AGIs $50k-75k, 9.9% for AGIs $75k-100k, 22.8% for AGIs $100k-200k)
Charity contributions: $5,433 (reported on 20.6% of returns)
Here:
$5,433
State:
$4,025
(% of AGI for various income ranges: 1.5% for AGIs $25k-50k, 1.6% for AGIs $50k-75k, 1.9% for AGIs $75k-100k, 6.3% for AGIs $100k-200k)
Taxes paid: $6,900 (reported on 27.5% of returns)
17087:
$6,900
State:
$9,982
(% of AGI for various income ranges: 1.5% for AGIs below $25k, 2.8% for AGIs $25k-50k, 3.3% for AGIs $50k-75k, 3.7% for AGIs $75k-100k, 8.7% for AGIs $100k-200k)
Earned income credit: $1,827 (reported on 11.5% of returns)
Here:
$1,827
State:
$2,106
(% of AGI for various income ranges: 2.4% for AGIs below $25k, 1.1% for AGIs $25k-50k)
Percentage of individuals using paid preparers for their 2012 taxes: 67.2%
Here:
67%
State:
53%
(% for various income ranges: 63.0% for AGIs below $25k, 63.9% for AGIs $25k-50k, 68.2% for AGIs $50k-75k, 73.3% for AGIs $75k-100k, 100.0% for AGIs $100k-200k)
Averages for the 2004 tax year for zip code 17087, filed in 2005:
Average Adjusted Gross Income (AGI) in 2004: $41,941 (Individual Income Tax Returns)
Here:
$41,941
State:
$48,049
Salary/wage: $36,938 (reported on 83.3% of returns)
Here:
$36,938
State:
$42,646
(% of AGI for various income ranges: 92.4% for AGIs below $10k, 74.5% for AGIs $10k-25k, 79.7% for AGIs $25k-50k, 75.9% for AGIs $50k-75k, 82.6% for AGIs $75k-100k, 54.0% for AGIs over 100k)
Taxable interest for individuals: $1,467 (reported on 50.4% of returns)
This zip code:
$1,467
Pennsylvania:
$1,657
(% of AGI for various income ranges: 5.3% for AGIs below $10k, 2.2% for AGIs $10k-25k, 1.4% for AGIs $25k-50k, 1.8% for AGIs $50k-75k, 1.4% for AGIs $75k-100k, 1.9% for AGIs over 100k)
Taxable dividends: $1,597 (reported on 26.3% of returns)
Here:
$1,597
State:
$3,566
(% of AGI for various income ranges: 3.1% for AGIs below $10k, 1.0% for AGIs $10k-25k, 0.6% for AGIs $25k-50k, 0.8% for AGIs $50k-75k, 0.2% for AGIs $75k-100k, 2.1% for AGIs over 100k)
Net capital gain/loss: +$5,641 (reported on 19.1% of returns)
Here:
+$5,641
State:
+$9,716
(% of AGI for various income ranges: 1.4% for AGIs below $10k, -0.0% for AGIs $10k-25k, 0.3% for AGIs $25k-50k, 2.2% for AGIs $50k-75k, 3.6% for AGIs $75k-100k, 6.1% for AGIs over 100k)
Profit/loss from business: +$13,515 (reported on 14.5% of returns)
Here:
+$13,515
State:
+$14,267
(% of AGI for various income ranges: 7.7% for AGIs below $10k, 6.7% for AGIs $10k-25k, 3.8% for AGIs $25k-50k, 5.4% for AGIs $50k-75k, 3.3% for AGIs $75k-100k, 4.5% for AGIs over 100k)
Profit/loss from farming: +$12,404 (reported on 3.5% of returns)
Here:
+$12,404
State:
+$274
IRA payment deduction: $3,043 (reported on 3.4% of returns)
17087:
$3,043
Pennsylvania:
$2,903
Total itemized deductions: $15,601 (22% of AGI, reported on 30.9% of returns)
Here:
$15,601
State:
$18,804
Here:
21.6% of AGI
State:
19.5% of AGI
(% of AGI for various income ranges: 9.3% for AGIs $10k-25k, 9.4% for AGIs $25k-50k, 12.0% for AGIs $50k-75k, 12.4% for AGIs $75k-100k, 14.5% for AGIs over 100k)
Charity contributions deductions: $4,051 (5% of AGI, reported on 24.9% of returns)
Here:
$4,051
State:
$3,337
Here:
5.3% of AGI
State:
3.3% of AGI
(% of AGI for various income ranges: 0.8% for AGIs $10k-25k, 1.6% for AGIs $25k-50k, 1.9% for AGIs $50k-75k, 1.7% for AGIs $75k-100k, 5.5% for AGIs over 100k)
Total tax: $5,123 (reported on 77.6% of returns)
17087:
$5,123
State:
$8,008
(% of AGI for various income ranges: 2.5% for AGIs below $10k, 4.9% for AGIs $10k-25k, 6.6% for AGIs $25k-50k, 8.5% for AGIs $50k-75k, 9.2% for AGIs $75k-100k, 16.8% for AGIs over 100k)
Earned income credit: $1,575 (reported on 8.4% of returns)
Here:
$1,575
State:
$1,643
Percentage of individuals using paid preparers for their 2004 taxes: 67.1%
Here:
67%
State:
56%
(% for various income ranges: 57.2% for AGIs below $10k, 62.7% for AGIs $10k-25k, 68.6% for AGIs $25k-50k, 73.5% for AGIs $50k-75k, 72.9% for AGIs $75k-100k, 80.3% for AGIs over 100k)
Household received Food Stamps/SNAP in the past 12 months: 44 Household did not receive Food Stamps/SNAP in the past 12 months: 891
Women who had a birth in the past 12 months: 36 (25 now married, 11 unmarried) Women who did not have a birth in the past 12 months: 512 (292 now married, 216 unmarried)
Housing units in zip code 17087 with a mortgage: 533 (72 second mortgage, 7 home equity loan, 59 both second mortgage and home equity loan) Median monthly owner costs for units with a mortgage: $1,515 Median monthly owner costs for units without a mortgage: $676
Residents with income below the poverty level in 2022:
This zip code:
3.2%
Whole state:
11.8%
Residents with income below 50% of the poverty level in 2022:
This zip code:
1.2%
Whole state:
6.1%
Median number of rooms in houses and condos:
Here:
6.9
State:
6.8
Median number of rooms in apartments:
Here:
4.6
State:
4.3
Notable locations in this zip code not listed on our city pages
Size of family households: 259 2-persons, 179 3-persons, 110 4-persons, 107 5-persons, 7 6-persons, 46 7-or-more-persons
Size of nonfamily households: 188 1-person, 36 2-persons
591 married couples with children.
69 single-parent households (21 men, 48 women).
91.7% of residents of 17087 zip code speak English at home.
1.5% of residents speak Spanish at home (66% very well, 24% well, 11% not well).
6.5% of residents speak other Indo-European language at home (25% very well, 72% well, 3% not well).
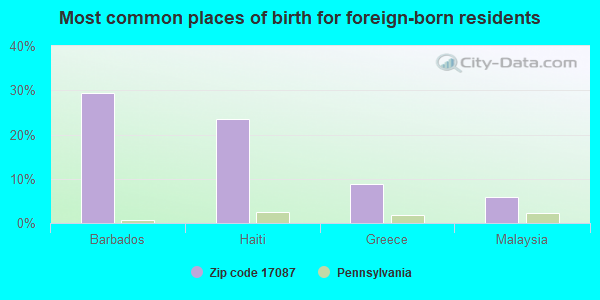
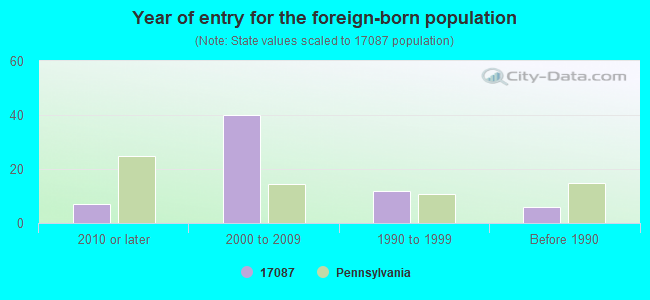
Foreign born population: 34 (1.3%) (55.5% of them are naturalized citizens)
This zip code:
1.3%
Whole state:
7.5%
29%Barbados
24%Haiti
9%Greece
6%Malaysia
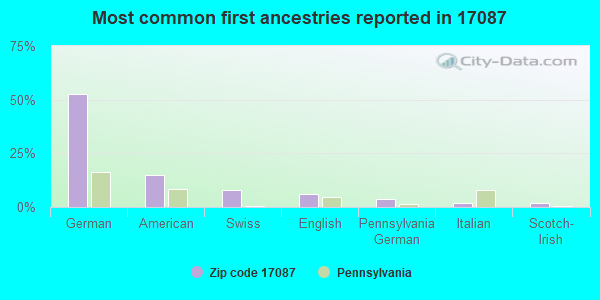
53%German
15%American
8%Swiss
6%English
4%Pennsylvania German
2%Italian
2%Scotch-Irish
Year of entry for the foreign-born population
72010 or later
402000 to 2009
121990 to 1999
6Before 1990
Facilities with environmental interests located in this zip code:
ARNOLD W KREIDER (44 KETTERMAN HILL RD in RICHLAND, PA)
Conditionally Exempt Small Quantity Generators, less than 100 kg/month of hazardous waste (Resource Conservation and Recovery Act (tracking hazardous waste)) - notification TRANSPORTER (Resource Conservation and Recovery Act (tracking hazardous waste)) - notification USED OIL PROGRAM (Resource Conservation and Recovery Act (tracking hazardous waste))
Housing units lacking complete plumbing facilities: 0.8% Housing units lacking complete kitchen facilities: 0.3%
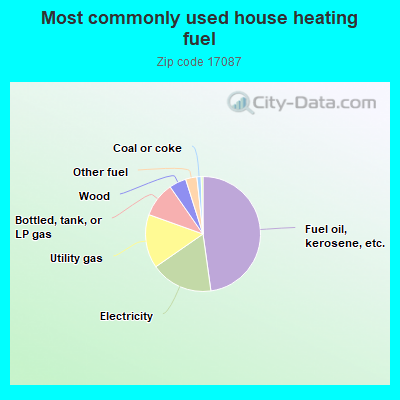
48.0%Fuel oil, kerosene, etc.
17.6%Electricity
15.2%Utility gas
9.9%Bottled, tank, or LP gas
4.8%Wood
3.2%Other fuel
1.2%Coal or coke
0.5%No fuel used
Population in 1990: 3,367.
Place of birth for U.S.-born residents:
This state: 2,387
Northeast: 66
Midwest: 37
South: 71
West: 28
70% of the 17087 zip code residents lived in the same house 5 years ago. Out of people who lived in different houses, 67% lived in this county. Out of people who lived in different counties, 50% lived in Pennsylvania.
92% of the 17087 zip code residents lived in the same house 1 year ago. Out of people who lived in different houses, 35% moved from this county. Out of people who lived in different houses, 41% moved from different county within same state. Out of people who lived in different houses, 22% moved from different state. Out of people who lived in different houses, 1% moved from abroad.
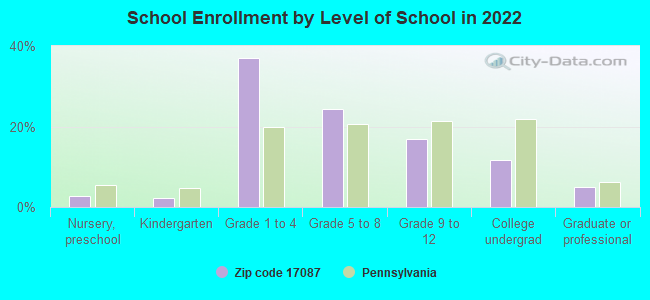
Private vs. public school enrollment:
Students in private schools in grades 1 to 8 (elementary and middle school): 129
Here:
37.4%
Pennsylvania:
15.7%
Students in private schools in grades 9 to 12 (high school): 23
Here:
25.0%
Pennsylvania:
13.4%
Students in private undergraduate colleges: 3
Here:
6.0%
Pennsylvania:
39.8%
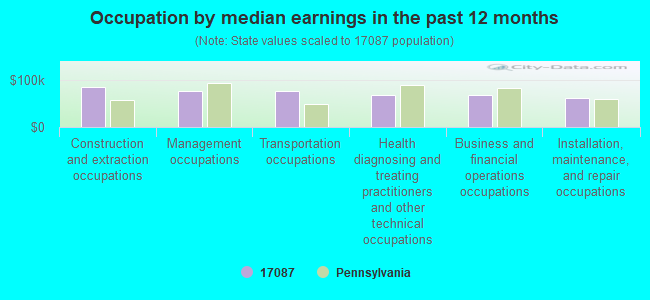
Occupation by median earnings in the past 12 months ($)
83,861Construction and extraction occupations
76,453Management occupations
75,739Transportation occupations
67,326Health diagnosing and treating practitioners and other technical occupations
67,209Business and financial operations occupations
62,411Installation, maintenance, and repair occupations
Companies with federal contracts located in this zip code:
COLUMBIA PETROLEUM CORPORATION (225 MAIN ST in RICHLAND, PA; small business) : $927,903 in 6 contractsfrom 2000 to 2004
Contracts for Fuel Oils, Liquid Propellants and Fuels, Petroleum Base by Bureau of Prisoners/Federal Prison System, Defense Logistics Agency, Army Signed by year:2000: $921,145; 2001: $0; 2002: $0; 2003: $3,312; 2004: $3,446; 2005: $0; 2006: $0.
Biggest contracts:
$439,000 with Bureau of Prisoners/Federal Prison System for Fuel Oils. Signed on 2000-12-15. Completion date: 2001-03-15.
$329,000, same as above.Signed on 2000-12-15. Completion date: 2001-03-15.
$153,145 with Defense Logistics Agency for Liquid Propellants and Fuels, Petroleum Base. Signed on 2000-03-10. Completion date: 2002-07-31.
$3,446 with Army for Fuel Oils. Signed on 2004-12-22. Completion date: 2004-12-30.
RICHLAND PARTNERS, LLC (225 E MAIN ST in RICHLAND, PA; small business)
$6,905 with Army for Fuel Oils. Signed on 2003-02-06. Completion date: 2003-02-07.
Top industries in this zip code by the number of employees in 2005:
Wholesale Trade: Farm and Garden Machinery and Equipment Merchant Wholesalers (20-49 employees: 1 establishment)
Other Services (except Public Administration): Religious Organizations (5-9: 2, 1-4: 4)
Administrative and Support and Waste Management and Remediation Services: Landscaping Services (5-9: 1, 1-4: 3)
Construction: Plumbing, Heating, and Air-Conditioning Contractors (5-9: 1, 1-4: 2)
People in group quarters in 2000:
2 people in other group homes
Home Mortgage Disclosure Act Aggregated Statistics For Year 2009 (Based on 4 partial tracts)
A) FHA, FSA/RHS & VA Home Purchase Loans
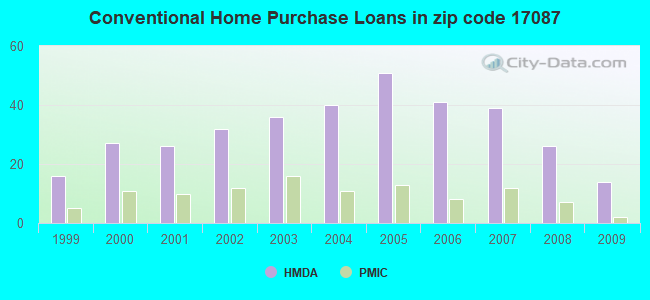
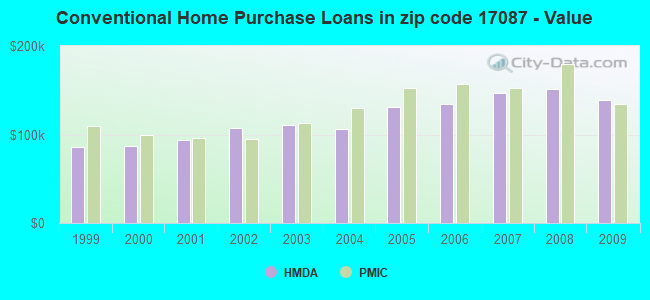
B) Conventional Home Purchase Loans
C) Refinancings
D) Home Improvement Loans
F) Non-occupant Loans on < 5 Family Dwellings (A B C & D)
G) Loans On Manufactured Home Dwelling (A B C & D)
Number
Average Value
Number
Average Value
Number
Average Value
Number
Average Value
Number
Average Value
Number
Average Value
LOANS ORIGINATED
12
$157,178
14
$138,502
62
$142,388
10
$64,076
2
$163,720
1
$82,500
APPLICATIONS APPROVED, NOT ACCEPTED
0
$0
2
$157,345
5
$140,198
1
$24,470
0
$0
1
$27,980
APPLICATIONS DENIED
1
$114,320
0
$0
18
$152,887
3
$29,500
0
$0
0
$0
APPLICATIONS WITHDRAWN
1
$81,390
2
$159,175
13
$151,134
2
$68,675
0
$0
0
$0
FILES CLOSED FOR INCOMPLETENESS
0
$0
0
$0
2
$154,020
0
$0
0
$0
0
$0
Aggregated Statistics For Year 2008 (Based on 4 partial tracts)
A) FHA, FSA/RHS & VA Home Purchase Loans
B) Conventional Home Purchase Loans
C) Refinancings
D) Home Improvement Loans
F) Non-occupant Loans on < 5 Family Dwellings (A B C & D)
G) Loans On Manufactured Home Dwelling (A B C & D)
Number
Average Value
Number
Average Value
Number
Average Value
Number
Average Value
Number
Average Value
Number
Average Value
LOANS ORIGINATED
7
$161,247
26
$151,908
48
$119,009
13
$49,122
6
$129,313
1
$61,040
APPLICATIONS APPROVED, NOT ACCEPTED
0
$0
2
$170,195
9
$121,003
1
$46,540
1
$83,210
1
$28,440
APPLICATIONS DENIED
2
$139,130
3
$125,143
31
$155,984
6
$91,430
1
$127,660
1
$106,320
APPLICATIONS WITHDRAWN
1
$189,180
2
$103,730
10
$143,535
2
$71,340
0
$0
0
$0
FILES CLOSED FOR INCOMPLETENESS
0
$0
0
$0
3
$135,543
0
$0
0
$0
0
$0
Aggregated Statistics For Year 2007 (Based on 4 partial tracts)
A) FHA, FSA/RHS & VA Home Purchase Loans
B) Conventional Home Purchase Loans
C) Refinancings
D) Home Improvement Loans
F) Non-occupant Loans on < 5 Family Dwellings (A B C & D)
G) Loans On Manufactured Home Dwelling (A B C & D)
Number
Average Value
Number
Average Value
Number
Average Value
Number
Average Value
Number
Average Value
Number
Average Value
LOANS ORIGINATED
5
$141,636
39
$146,459
49
$105,453
23
$34,312
5
$131,214
1
$92,630
APPLICATIONS APPROVED, NOT ACCEPTED
0
$0
4
$132,020
12
$108,632
3
$43,443
0
$0
0
$0
APPLICATIONS DENIED
0
$0
8
$132,258
29
$130,629
7
$44,941
1
$180,220
2
$79,845
APPLICATIONS WITHDRAWN
0
$0
4
$148,388
13
$143,045
1
$57,420
1
$177,190
0
$0
FILES CLOSED FOR INCOMPLETENESS
0
$0
2
$167,810
5
$162,910
0
$0
1
$104,170
0
$0
Aggregated Statistics For Year 2006 (Based on 4 partial tracts)
A) FHA, FSA/RHS & VA Home Purchase Loans
B) Conventional Home Purchase Loans
C) Refinancings
D) Home Improvement Loans
F) Non-occupant Loans on < 5 Family Dwellings (A B C & D)
G) Loans On Manufactured Home Dwelling (A B C & D)
Number
Average Value
Number
Average Value
Number
Average Value
Number
Average Value
Number
Average Value
Number
Average Value
LOANS ORIGINATED
5
$147,288
41
$134,039
62
$91,221
24
$35,111
6
$113,472
1
$82,580
APPLICATIONS APPROVED, NOT ACCEPTED
0
$0
3
$146,083
12
$125,738
3
$58,067
1
$70,690
0
$0
APPLICATIONS DENIED
1
$152,260
5
$155,902
42
$127,337
9
$38,117
1
$114,240
2
$76,035
APPLICATIONS WITHDRAWN
0
$0
4
$131,002
24
$134,866
1
$29,260
1
$155,630
0
$0
FILES CLOSED FOR INCOMPLETENESS
0
$0
2
$95,730
4
$181,722
0
$0
0
$0
0
$0
Aggregated Statistics For Year 2005 (Based on 4 partial tracts)
A) FHA, FSA/RHS & VA Home Purchase Loans
B) Conventional Home Purchase Loans
C) Refinancings
D) Home Improvement Loans
F) Non-occupant Loans on < 5 Family Dwellings (A B C & D)
G) Loans On Manufactured Home Dwelling (A B C & D)
Number
Average Value
Number
Average Value
Number
Average Value
Number
Average Value
Number
Average Value
Number
Average Value
LOANS ORIGINATED
3
$115,633
51
$130,759
68
$99,037
17
$34,438
5
$98,004
1
$35,200
APPLICATIONS APPROVED, NOT ACCEPTED
1
$51,750
3
$129,217
16
$101,074
1
$64,010
0
$0
1
$18,590
APPLICATIONS DENIED
0
$0
6
$151,985
44
$119,494
5
$27,092
1
$53,900
1
$47,100
APPLICATIONS WITHDRAWN
0
$0
4
$182,058
29
$126,171
3
$144,703
1
$60,580
0
$0
FILES CLOSED FOR INCOMPLETENESS
0
$0
1
$113,980
8
$151,272
0
$0
0
$0
0
$0
Aggregated Statistics For Year 2004 (Based on 4 partial tracts)
A) FHA, FSA/RHS & VA Home Purchase Loans
B) Conventional Home Purchase Loans
C) Refinancings
D) Home Improvement Loans
F) Non-occupant Loans on < 5 Family Dwellings (A B C & D)
G) Loans On Manufactured Home Dwelling (A B C & D)
Number
Average Value
Number
Average Value
Number
Average Value
Number
Average Value
Number
Average Value
Number
Average Value
LOANS ORIGINATED
3
$108,227
40
$105,926
68
$94,540
18
$31,761
4
$68,492
1
$69,530
APPLICATIONS APPROVED, NOT ACCEPTED
0
$0
4
$81,672
14
$91,062
1
$40,110
0
$0
1
$69,480
APPLICATIONS DENIED
0
$0
6
$73,118
30
$106,707
7
$40,740
1
$55,480
2
$83,770
APPLICATIONS WITHDRAWN
0
$0
2
$107,740
25
$109,176
2
$49,485
0
$0
1
$37,870
FILES CLOSED FOR INCOMPLETENESS
0
$0
1
$137,920
11
$117,935
1
$12,310
0
$0
0
$0
Aggregated Statistics For Year 2003 (Based on 4 partial tracts)
A) FHA, FSA/RHS & VA Home Purchase Loans
B) Conventional Home Purchase Loans
C) Refinancings
D) Home Improvement Loans
F) Non-occupant Loans on < 5 Family Dwellings (A B C & D)
Number
Average Value
Number
Average Value
Number
Average Value
Number
Average Value
Number
Average Value
LOANS ORIGINATED
4
$99,608
36
$111,237
107
$93,635
12
$24,938
4
$81,112
APPLICATIONS APPROVED, NOT ACCEPTED
0
$0
5
$109,176
18
$96,384
2
$21,275
1
$63,660
APPLICATIONS DENIED
0
$0
3
$134,663
39
$105,249
5
$12,780
1
$69,080
APPLICATIONS WITHDRAWN
0
$0
2
$148,645
26
$106,597
1
$23,360
0
$0
FILES CLOSED FOR INCOMPLETENESS
0
$0
1
$60,600
2
$98,025
1
$28,860
0
$0
Aggregated Statistics For Year 2002 (Based on 4 partial tracts)
A) FHA, FSA/RHS & VA Home Purchase Loans
B) Conventional Home Purchase Loans
C) Refinancings
D) Home Improvement Loans
F) Non-occupant Loans on < 5 Family Dwellings (A B C & D)
Number
Average Value
Number
Average Value
Number
Average Value
Number
Average Value
Number
Average Value
LOANS ORIGINATED
5
$105,478
32
$106,791
71
$86,756
14
$23,705
2
$69,770
APPLICATIONS APPROVED, NOT ACCEPTED
0
$0
3
$103,333
13
$75,991
2
$27,240
0
$0
APPLICATIONS DENIED
1
$74,420
4
$61,445
23
$90,072
3
$14,377
1
$39,830
APPLICATIONS WITHDRAWN
1
$76,360
2
$117,955
19
$110,641
1
$38,030
0
$0
FILES CLOSED FOR INCOMPLETENESS
0
$0
1
$189,760
5
$115,158
0
$0
0
$0
Aggregated Statistics For Year 2001 (Based on 4 partial tracts)
A) FHA, FSA/RHS & VA Home Purchase Loans
B) Conventional Home Purchase Loans
C) Refinancings
D) Home Improvement Loans
F) Non-occupant Loans on < 5 Family Dwellings (A B C & D)
Number
Average Value
Number
Average Value
Number
Average Value
Number
Average Value
Number
Average Value
LOANS ORIGINATED
6
$103,232
26
$93,980
50
$91,178
10
$25,869
3
$63,010
APPLICATIONS APPROVED, NOT ACCEPTED
1
$45,720
2
$93,070
9
$89,448
1
$15,920
0
$0
APPLICATIONS DENIED
0
$0
6
$68,348
24
$77,774
3
$11,920
1
$33,080
APPLICATIONS WITHDRAWN
0
$0
2
$96,290
13
$88,441
1
$15,050
0
$0
FILES CLOSED FOR INCOMPLETENESS
0
$0
0
$0
3
$114,517
0
$0
0
$0
Aggregated Statistics For Year 2000 (Based on 4 partial tracts)
A) FHA, FSA/RHS & VA Home Purchase Loans
B) Conventional Home Purchase Loans
C) Refinancings
D) Home Improvement Loans
E) Loans on Dwellings For 5+ Families
F) Non-occupant Loans on < 5 Family Dwellings (A B C & D)
Number
Average Value
Number
Average Value
Number
Average Value
Number
Average Value
Number
Average Value
Number
Average Value
LOANS ORIGINATED
3
$90,733
27
$87,522
25
$66,296
14
$21,412
1
$73,100
2
$73,780
APPLICATIONS APPROVED, NOT ACCEPTED
0
$0
4
$73,312
5
$65,538
2
$30,940
0
$0
0
$0
APPLICATIONS DENIED
1
$75,480
6
$62,123
17
$71,972
5
$20,942
0
$0
1
$45,800
APPLICATIONS WITHDRAWN
0
$0
2
$62,600
9
$76,673
1
$21,470
0
$0
1
$38,580
FILES CLOSED FOR INCOMPLETENESS
0
$0
1
$48,420
1
$81,740
0
$0
0
$0
0
$0
Aggregated Statistics For Year 1999 (Based on 2 partial tracts)
A) FHA, FSA/RHS & VA Home Purchase Loans
B) Conventional Home Purchase Loans
C) Refinancings
D) Home Improvement Loans
F) Non-occupant Loans on < 5 Family Dwellings (A B C & D)
Detailed PMIC statistics for the following Tracts:0030.00
, 0104.00
2003 - 2018 National Fire Incident Reporting System (NFIRS) incidents
Based on the data from the years 2003 - 2018 the average number of fire incidents per year is 7. The highest number of fires - 23 took place in 2006, and the least - 0 in 2009. The data has a growing trend.
When looking into fire subcategories, the most reports belonged to: Structure Fires (78.8%), and Outside Fires (13.3%).
Fire incident types reported to NFIRS in Zip Code 17087


 Nearest zip codes: 19544, 19550, 17067, 19507, 19567, 19559.


 Based on the data from the years 2003 - 2018 the average number of fire incidents per year is 7. The highest number of fires - 23 took place in 2006, and the least - 0 in 2009. The data has a growing trend.
 When looking into fire subcategories, the most reports belonged to: Structure Fires (78.8%), and Outside Fires (13.3%).