Estimated zip code population in 2022: 3,268 Zip code population in 2010: 3,311 Zip code population in 2000: 3,483
Houses and condos: 1,728 Renter-occupied apartments: 205
% of renters here:
16%
State:
31%
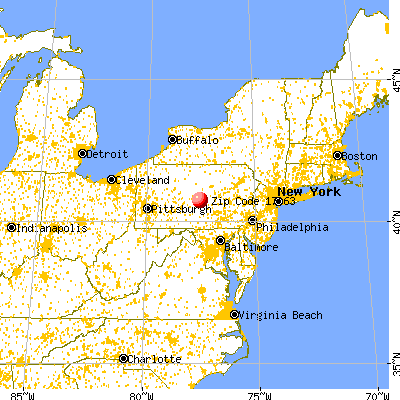
March 2022 cost of living index in zip code 17063: 90.3 (less than average, U.S. average is 100)
Land area: 93.7 sq. mi. Water area: 0.3 sq. mi.
Population density: 35 people per square mile
(very low).
OSM Map
General Map
Google Map
MSN Map
OSM Map
General Map
Google Map
MSN Map
OSM Map
General Map
Google Map
MSN Map
OSM Map
General Map
Google Map
MSN Map
Please wait while loading the map...
Real estate property taxes paid for housing units in 2022:
This zip code:
1.4% ($1,825)
Pennsylvania:
1.3% ($3,094)
Median real estate property taxes paid for housing units with mortgages in 2022: $1,628 (1.3%) Median real estate property taxes paid for housing units with no mortgage in 2022: $2,077 (1.4%)
Business Search- 14 Million verified businesses
Males: 1,616
(49.4%)
Females: 1,652
(50.6%)
For population 25 years and over in 17063:
High school or higher: 84.6%
Bachelor's degree or higher: 12.0%
Graduate or professional degree: 1.9%
Unemployed: 3.6%
Mean travel time to work (commute): 27.5 minutes
For population 15 years and over in 17063:
Never married: 30.1%
Now married: 53.9%
Separated: 1.2%
Widowed: 5.9%
Divorced: 8.9%
Zip code 17063 compared to state average:
Median house value below state average.
Black race population percentage significantly below state average.
Hispanic race population percentage significantly below state average.
Foreign-born population percentage significantly below state average.
Renting percentage below state average.
Length of stay since moving in significantly above state average.
Percentage of population with a bachelor's degree or higher significantly below state average.
Averages for the 2020 tax year for zip code 17063, filed in 2021:
Average Adjusted Gross Income (AGI) in 2020: $47,466 (Individual Income Tax Returns)
Here:
$47,466
State:
$75,707
Salary/wage: $44,296 (reported on 79.7% of returns)
Here:
$44,296
State:
$62,806
(% of AGI for various income ranges: 1143.2% for AGIs below $25k, 4047.1% for AGIs $25k-50k, 6508.8% for AGIs $50k-75k, 8480.0% for AGIs $75k-100k, 15301.7% for AGIs $100k-200k)
Taxable interest for individuals: $644 (reported on 27.2% of returns)
This zip code:
$644
Pennsylvania:
$1,633
(% of AGI for various income ranges: 28.1% for AGIs below $25k, 21.1% for AGIs $25k-50k, 31.9% for AGIs $50k-75k, 20.0% for AGIs $75k-100k, 35.8% for AGIs $100k-200k)
Ordinary dividends: $1,761 (reported on 11.4% of returns)
Here:
$1,761
State:
$7,382
(% of AGI for various income ranges: 11.0% for AGIs below $25k, 27.1% for AGIs $25k-50k, 30.0% for AGIs $50k-75k, 80.0% for AGIs $75k-100k, 43.3% for AGIs $100k-200k)
Net capital gain/loss in AGI: +$4,035 (reported on 10.8% of returns)
Here:
+$4,035
State:
+$23,522
(% of AGI for various income ranges: 11.9% for AGIs below $25k, 26.0% for AGIs $25k-50k, 105.0% for AGIs $50k-75k, 325.0% for AGIs $100k-200k)
Profit/loss from business: +$12,524 (reported on 10.8% of returns)
Here:
+$12,524
State:
+$16,274
(% of AGI for various income ranges: 168.7% for AGIs below $25k, 75.4% for AGIs $25k-50k, 233.8% for AGIs $50k-75k, 880.0% for AGIs $75k-100k)
Taxable individual retirement arrangement distribution: $10,028 (reported on 11.4% of returns)
17063:
$10,028
Pennsylvania:
$18,583
(% of AGI for various income ranges: 89.4% for AGIs below $25k, 120.0% for AGIs $25k-50k, 407.5% for AGIs $50k-75k, 380.0% for AGIs $100k-200k)
Earned income credit: $2,148 (reported on 13.3% of returns)
Here:
$2,148
State:
$2,100
(% of AGI for various income ranges: 72.3% for AGIs below $25k, 64.9% for AGIs $25k-50k)
Percentage of individuals using paid preparers for their 2020 taxes: 96.2%
Here:
96%
State:
92%
(% for various income ranges: 94.4% for AGIs below $25k, 98.0% for AGIs $25k-50k, 95.5% for AGIs $50k-75k, 92.9% for AGIs $75k-100k, 100.0% for AGIs $100k-200k)
Averages for the 2012 tax year for zip code 17063, filed in 2013:
Average Adjusted Gross Income (AGI) in 2012: $36,248 (Individual Income Tax Returns)
Here:
$36,248
State:
$61,346
Salary/wage: $35,108 (reported on 79.9% of returns)
Here:
$35,108
State:
$51,902
(% of AGI for various income ranges: 70.1% for AGIs below $25k, 80.2% for AGIs $25k-50k, 79.4% for AGIs $50k-75k, 81.2% for AGIs $75k-100k, 72.7% for AGIs $100k-200k)
Taxable interest for individuals: $756 (reported on 30.2% of returns)
This zip code:
$756
Pennsylvania:
$1,588
(% of AGI for various income ranges: 1.3% for AGIs below $25k, 0.4% for AGIs $25k-50k, 0.6% for AGIs $50k-75k, 0.8% for AGIs $75k-100k, 0.2% for AGIs $100k-200k)
Ordinary dividends: $1,516 (reported on 12.8% of returns)
Here:
$1,516
State:
$5,827
(% of AGI for various income ranges: 1.5% for AGIs below $25k, 0.3% for AGIs $25k-50k, 0.4% for AGIs $50k-75k, 0.7% for AGIs $75k-100k)
Net capital gain/loss in AGI: +$1,438 (reported on 8.7% of returns)
Here:
+$1,438
State:
+$14,495
(% of AGI for various income ranges: 0.6% for AGIs $25k-50k, 0.1% for AGIs $50k-75k, 0.9% for AGIs $75k-100k)
Profit/loss from business: +$6,850 (reported on 12.1% of returns)
Here:
+$6,850
State:
+$16,268
(% of AGI for various income ranges: 4.6% for AGIs below $25k, 2.9% for AGIs $25k-50k, 3.4% for AGIs $50k-75k)
Taxable individual retirement arrangement distribution: $9,333 (reported on 12.1% of returns)
17063:
$9,333
Pennsylvania:
$14,550
(% of AGI for various income ranges: 3.1% for AGIs below $25k, 2.5% for AGIs $25k-50k, 3.1% for AGIs $50k-75k, 6.8% for AGIs $75k-100k)
Total itemized deductions: $14,817 (19% of AGI, reported on 12.1% of returns)
Here:
$14,817
State:
$23,538
Here:
19.4% of AGI
State:
18.4% of AGI
(% of AGI for various income ranges: 6.3% for AGIs $25k-50k, 3.7% for AGIs $50k-75k, 5.9% for AGIs $75k-100k, 8.2% for AGIs $100k-200k)
Charity contributions: $2,408 (reported on 8.1% of returns)
Here:
$2,408
State:
$4,025
(% of AGI for various income ranges: 0.5% for AGIs $25k-50k, 0.5% for AGIs $50k-75k, 0.7% for AGIs $75k-100k, 0.9% for AGIs $100k-200k)
Taxes paid: $5,183 (reported on 12.1% of returns)
17063:
$5,183
State:
$9,982
(% of AGI for various income ranges: 1.7% for AGIs $25k-50k, 1.3% for AGIs $50k-75k, 2.4% for AGIs $75k-100k, 3.3% for AGIs $100k-200k)
Earned income credit: $2,054 (reported on 16.1% of returns)
Here:
$2,054
State:
$2,106
(% of AGI for various income ranges: 3.7% for AGIs below $25k, 1.2% for AGIs $25k-50k)
Percentage of individuals using paid preparers for their 2012 taxes: 66.4%
Here:
66%
State:
53%
(% for various income ranges: 65.7% for AGIs below $25k, 68.3% for AGIs $25k-50k, 65.0% for AGIs $50k-75k, 66.7% for AGIs $75k-100k, 66.7% for AGIs $100k-200k)
Averages for the 2004 tax year for zip code 17063, filed in 2005:
Average Adjusted Gross Income (AGI) in 2004: $31,515 (Individual Income Tax Returns)
Here:
$31,515
State:
$48,049
Salary/wage: $29,230 (reported on 81.4% of returns)
Here:
$29,230
State:
$42,646
(% of AGI for various income ranges: 71.6% for AGIs below $10k, 74.5% for AGIs $10k-25k, 80.1% for AGIs $25k-50k, 85.0% for AGIs $50k-75k, 72.2% for AGIs $75k-100k, 44.4% for AGIs over 100k)
Taxable interest for individuals: $1,151 (reported on 43.8% of returns)
This zip code:
$1,151
Pennsylvania:
$1,657
(% of AGI for various income ranges: 7.7% for AGIs below $10k, 1.8% for AGIs $10k-25k, 1.3% for AGIs $25k-50k, 0.8% for AGIs $50k-75k, 1.5% for AGIs $75k-100k, 2.8% for AGIs over 100k)
Taxable dividends: $1,212 (reported on 19.0% of returns)
Here:
$1,212
State:
$3,566
(% of AGI for various income ranges: 2.5% for AGIs below $10k, 1.2% for AGIs $10k-25k, 0.6% for AGIs $25k-50k, 0.2% for AGIs $50k-75k, 0.8% for AGIs $75k-100k, 1.2% for AGIs over 100k)
Net capital gain/loss: +$8,192 (reported on 13.5% of returns)
Here:
+$8,192
State:
+$9,716
(% of AGI for various income ranges: 2.1% for AGIs below $10k, 0.5% for AGIs $10k-25k, 0.9% for AGIs $25k-50k, 1.4% for AGIs $50k-75k, 7.5% for AGIs $75k-100k, 17.1% for AGIs over 100k)
Profit/loss from business: +$6,031 (reported on 13.1% of returns)
Here:
+$6,031
State:
+$14,267
(% of AGI for various income ranges: 6.2% for AGIs below $10k, 6.1% for AGIs $10k-25k, 2.5% for AGIs $25k-50k, 2.0% for AGIs $50k-75k, 0.2% for AGIs $75k-100k)
Profit/loss from farming: +$1,029 (reported on 4.7% of returns)
Here:
+$1,029
State:
+$274
IRA payment deduction: $2,067 (reported on 2.0% of returns)
17063:
$2,067
Pennsylvania:
$2,903
Total itemized deductions: $13,532 (22% of AGI, reported on 15.0% of returns)
Here:
$13,532
State:
$18,804
Here:
22.3% of AGI
State:
19.5% of AGI
(% of AGI for various income ranges: 3.9% for AGIs $10k-25k, 6.2% for AGIs $25k-50k, 8.3% for AGIs $50k-75k, 9.2% for AGIs $75k-100k, 5.2% for AGIs over 100k)
Charity contributions deductions: $2,288 (4% of AGI, reported on 11.6% of returns)
Here:
$2,288
State:
$3,337
Here:
3.5% of AGI
State:
3.3% of AGI
(% of AGI for various income ranges: 0.6% for AGIs $10k-25k, 0.7% for AGIs $25k-50k, 1.0% for AGIs $50k-75k, 1.4% for AGIs $75k-100k, 0.6% for AGIs over 100k)
Total tax: $3,687 (reported on 69.4% of returns)
17063:
$3,687
State:
$8,008
(% of AGI for various income ranges: 1.8% for AGIs below $10k, 3.8% for AGIs $10k-25k, 6.3% for AGIs $25k-50k, 8.7% for AGIs $50k-75k, 10.1% for AGIs $75k-100k, 17.9% for AGIs over 100k)
Earned income credit: $1,449 (reported on 16.1% of returns)
Here:
$1,449
State:
$1,643
Percentage of individuals using paid preparers for their 2004 taxes: 66.6%
Here:
67%
State:
56%
(% for various income ranges: 64.9% for AGIs below $10k, 67.3% for AGIs $10k-25k, 65.2% for AGIs $25k-50k, 68.0% for AGIs $50k-75k, 66.1% for AGIs $75k-100k, 87.5% for AGIs over 100k)
Household received Food Stamps/SNAP in the past 12 months: 136 Household did not receive Food Stamps/SNAP in the past 12 months: 1,146
Women who had a birth in the past 12 months: 77 (68 now married, 11 unmarried) Women who did not have a birth in the past 12 months: 745 (328 now married, 415 unmarried)
Housing units in zip code 17063 with a mortgage: 542 (48 second mortgage, 42 both second mortgage and home equity loan) Median monthly owner costs for units with a mortgage: $1,166 Median monthly owner costs for units without a mortgage: $523
Residents with income below the poverty level in 2022:
This zip code:
18.8%
Whole state:
11.8%
Residents with income below 50% of the poverty level in 2022:
This zip code:
11.4%
Whole state:
6.1%
Median number of rooms in houses and condos:
Here:
6.0
State:
6.8
Median number of rooms in apartments:
Here:
5.4
State:
4.3
Notable locations in this zip code not listed on our city pages
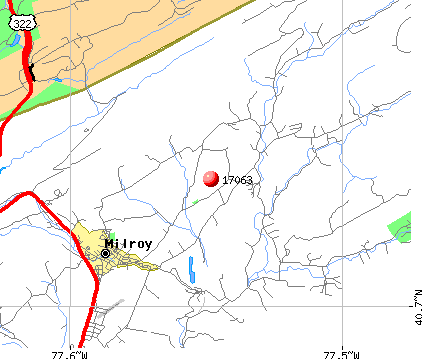
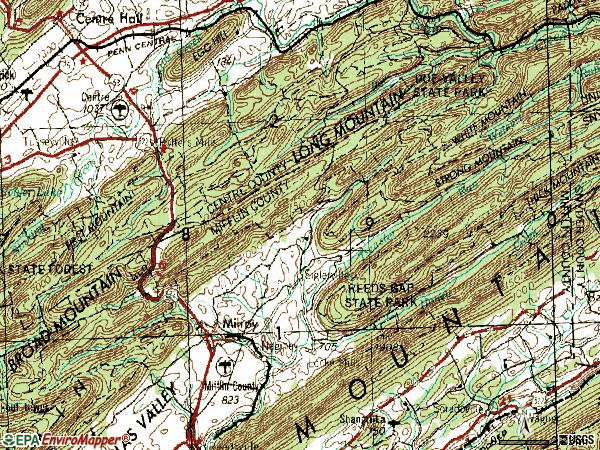
Notable locations in zip code 17063: Camp Juniata (A), CCC Camp (B), Milroy Hose Company (C), New Lancaster Valley Volunteer Fire Company (D). Display/hide their locations on the map
Streams, rivers, and creeks: Treaster Run (A), Swift Run (B), Havice Creek (C), Greens Valley Stream (D), Lingle Creek (E), Laurel Creek (F), Rock Run (G), Panther Run (H). Display/hide their locations on the map
Size of family households: 448 2-persons, 246 3-persons, 96 4-persons, 46 5-persons, 37 6-persons, 55 7-or-more-persons
Size of nonfamily households: 268 1-person, 87 2-persons
339 married couples with children.
269 single-parent households (116 men, 153 women).
85.8% of residents of 17063 zip code speak English at home.
13.5% of residents speak other Indo-European language at home (52% very well, 40% well, 4% not well, 3% not at all).
Foreign born population: 0 (0.0%)
:
0.0%
Whole state:
7.5%
42%German
20%American
14%Pennsylvania German
7%Irish
2%French
1%English
1%European
Facilities with environmental interests located in this zip code:
AUMILLERS AUTO WRECKERS (MECH ST in MILROY, PA)
STATE MASTER (Pennsylvania database) - RCRIS-PAD987366630, HAZARDOUS WASTE PROGRAM, PCS-PAR603515, National Pollutant Discharge Elimination System Permit National Pollutant Discharge Elimination System NON-MAJOR (Tracking pollutant discharge elimination systems) - permit Conditionally Exempt Small Quantity Generators, less than 100 kg/month of hazardous waste (Resource Conservation and Recovery Act (tracking hazardous waste)) - notification Business SIC classification: MOTOR VEHICLE PARTS, USED Organizations: JAMES AUMILLLERS (CONTACT/OWNER)
ARMAGH TWP EL SCH ( in MILROY, PA)
(National Center for Education Statistics) - STATE ID-3185 Organizations: MIFFLIN COUNTY SD (SCHOOL DISTRICT)
BALL CORPORATION UNIMARK PLASTICS DIVISION (U S ROUTE 322 AND PLASTIC AVENUE in MILROY, PA)
Small Quantity Generators, between 100 kg and 1000 kg of hazardous waste/month (Resource Conservation and Recovery Act (tracking hazardous waste)) - notification TRI REPORTER (Tracking of toxic chemicals releasing facilities) Organizations: OPERNAME (CONTACT/OPERATOR)
, ALLTRISTA CORP (CONTACT/OWNER)
Alternative names: UNIMARK PLASTICS CO
Housing units lacking complete plumbing facilities: 11.0% Housing units lacking complete kitchen facilities: 13.6%
56.4%Fuel oil, kerosene, etc.
20.4%Wood
13.4%Electricity
3.6%Other fuel
3.3%Bottled, tank, or LP gas
2.4%Utility gas
1.0%Coal or coke
Population in 1990: 3,627.
Place of birth for U.S.-born residents:
This state: 3,037
Northeast: 50
Midwest: 42
South: 108
78% of the 17063 zip code residents lived in the same house 5 years ago. Out of people who lived in different houses, 84% lived in this county. Out of people who lived in different counties, 50% lived in Pennsylvania.
97% of the 17063 zip code residents lived in the same house 1 year ago. Out of people who lived in different houses, 52% moved from this county. Out of people who lived in different houses, 58% moved from different county within same state.
Private vs. public school enrollment:
Students in private schools in grades 1 to 8 (elementary and middle school): 112
Here:
34.0%
Pennsylvania:
15.7%
Students in private schools in grades 9 to 12 (high school): 28
Here:
26.6%
Pennsylvania:
13.4%
Students in private undergraduate colleges:
Here:
0.0%
Pennsylvania:
39.8%
Occupation by median earnings in the past 12 months ($)
66,791Construction and extraction occupations
62,617Installation, maintenance, and repair occupations
55,152Office and administrative support occupations
48,110Health diagnosing and treating practitioners and other technical occupations
46,313Production occupations
42,136Personal care and service occupations
Top industries in this zip code by the number of employees in 2005:
Administrative and Support and Waste Management and Remediation Services: Security Guards and Patrol Services (100-249 employees: 1 establishment)
Mining: Crushed and Broken Limestone Mining and Quarrying (10-19: 1)
Finance and Insurance: Insurance Agencies and Brokerages (10-19: 1)
Wholesale Trade: Motor Vehicle Supplies and New Parts Merchant Wholesalers (10-19: 1)
Fatal accident statistics in 2012:
Fatal accident count: 1
Vehicles involved in fatal accidents: 2
Fatal accidents caused by drunken drivers: 0
Fatalities: 1
Persons involved in fatal accidents: 3
Pedestrians involved in fatal accidents: 0
Fatal accident statistics in 2011:
Fatal accident count: 1
Vehicles involved in fatal accidents: 1
Fatal accidents caused by drunken drivers: 0
Fatalities: 1
Persons involved in fatal accidents: 1
Pedestrians involved in fatal accidents: 0
2005 - 2018 National Fire Incident Reporting System (NFIRS) incidents
According to the data from the years 2005 - 2018 the average number of fires per year is 14. The highest number of reported fire incidents - 50 took place in 2016, and the least - 0 in 2007. The data has a growing trend.
When looking into fire subcategories, the most incidents belonged to: Structure Fires (52.6%), and Outside Fires (34.0%).
Fire incident types reported to NFIRS in Zip Code 17063


 Nearest zip codes: 16832, 16875, 17841, 16854, 17009, 17099.


 According to the data from the years 2005 - 2018 the average number of fires per year is 14. The highest number of reported fire incidents - 50 took place in 2016, and the least - 0 in 2007. The data has a growing trend.
 When looking into fire subcategories, the most incidents belonged to: Structure Fires (52.6%), and Outside Fires (34.0%).