Estimated zip code population in 2022: 2,705 Zip code population in 2010: 2,414 Zip code population in 2000: 2,746
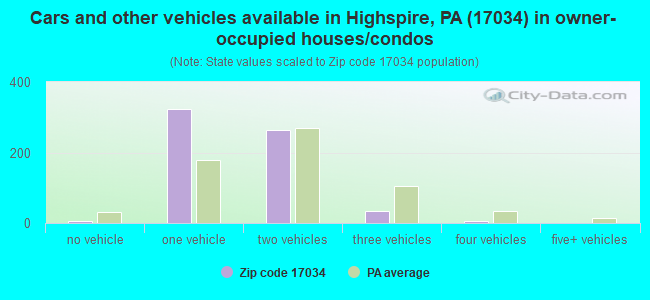
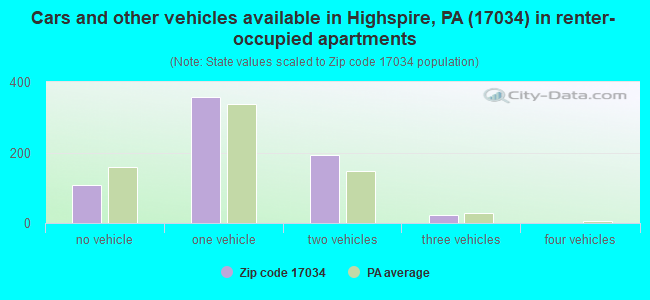
Houses and condos: 1,426 Renter-occupied apartments: 681
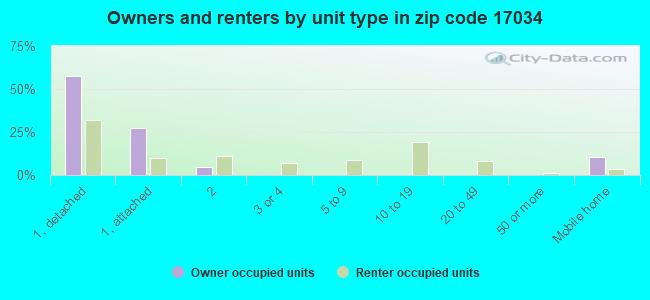
% of renters here:
52%
State:
31%
March 2022 cost of living index in zip code 17034: 94.7 (less than average, U.S. average is 100)
Land area: 0.7 sq. mi. Water area: 0.0 sq. mi.
Population density: 3,637 people per square mile
(average).
OSM Map
General Map
Google Map
MSN Map
OSM Map
General Map
Google Map
MSN Map
OSM Map
General Map
Google Map
MSN Map
OSM Map
General Map
Google Map
MSN Map
Please wait while loading the map...
Real estate property taxes paid for housing units in 2022:
This zip code:
2.6% ($3,108)
Pennsylvania:
1.3% ($3,094)
Median real estate property taxes paid for housing units with mortgages in 2022: $3,224 (2.7%) Median real estate property taxes paid for housing units with no mortgage in 2022: $2,502 (2.2%)
Business Search- 14 Million verified businesses
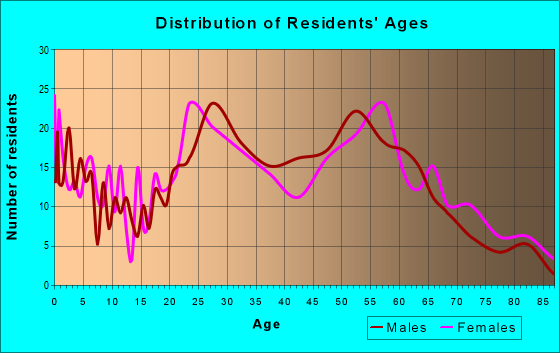
Males: 1,383
(51.1%)
Females: 1,321
(48.9%)
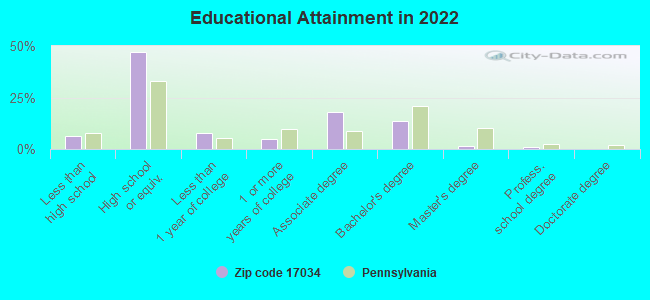
For population 25 years and over in 17034:
High school or higher: 93.3%
Bachelor's degree or higher: 15.9%
Graduate or professional degree: 2.6%
Unemployed: 4.8%
Mean travel time to work (commute): 18.4 minutes
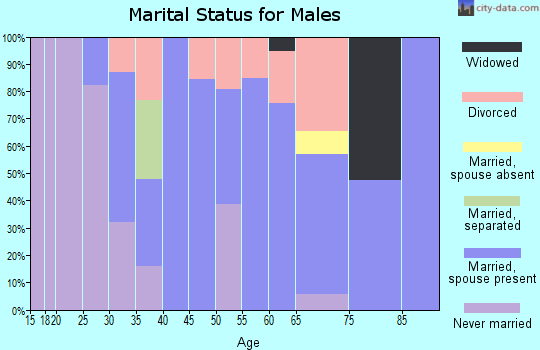
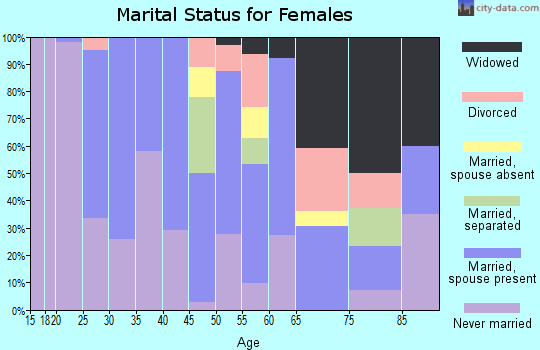
For population 15 years and over in 17034:
Never married: 32.9%
Now married: 43.5%
Separated: 4.6%
Widowed: 4.0%
Divorced: 15.0%
Zip code 17034 compared to state average:
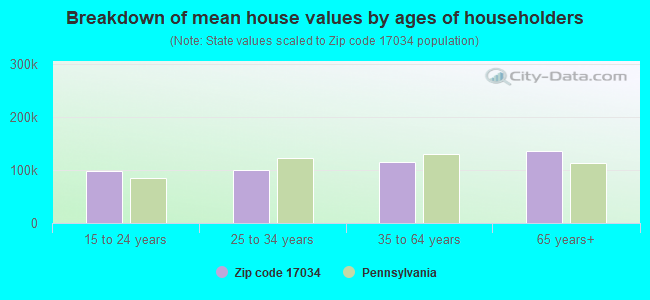
Median house value below state average.
Median age below state average.
Foreign-born population percentage significantly below state average.
Renting percentage above state average.
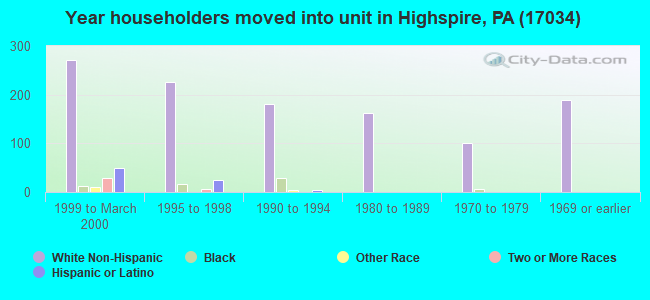
Length of stay since moving in significantly below state average.
Number of college students below state average.
Percentage of population with a bachelor's degree or higher significantly below state average.
Averages for the 2020 tax year for zip code 17034, filed in 2021:
Average Adjusted Gross Income (AGI) in 2020: $40,540 (Individual Income Tax Returns)
Here:
$40,540
State:
$75,707
Salary/wage: $35,507 (reported on 84.6% of returns)
Here:
$35,507
State:
$62,806
(% of AGI for various income ranges: 1074.4% for AGIs below $25k, 3365.8% for AGIs $25k-50k, 5888.9% for AGIs $50k-75k, 8112.5% for AGIs $75k-100k, 16247.5% for AGIs $100k-200k)
Taxable interest for individuals: $365 (reported on 13.4% of returns)
This zip code:
$365
Pennsylvania:
$1,633
(% of AGI for various income ranges: 2.7% for AGIs below $25k, 4.6% for AGIs $25k-50k, 16.3% for AGIs $50k-75k, 6.2% for AGIs $75k-100k, 10.0% for AGIs $100k-200k)
Ordinary dividends: $870 (reported on 6.7% of returns)
Here:
$870
State:
$7,382
(% of AGI for various income ranges: 8.5% for AGIs $25k-50k, 12.1% for AGIs $50k-75k, 57.5% for AGIs $100k-200k)
Net capital gain/loss in AGI: +$3,462 (reported on 5.4% of returns)
Here:
+$3,462
State:
+$23,522
(% of AGI for various income ranges: 8.3% for AGIs below $25k, 9.5% for AGIs $50k-75k, 281.2% for AGIs $75k-100k)
Profit/loss from business: +$10,350 (reported on 8.1% of returns)
Here:
+$10,350
State:
+$16,274
(% of AGI for various income ranges: 57.1% for AGIs below $25k, 94.2% for AGIs $25k-50k, 292.6% for AGIs $50k-75k)
Taxable individual retirement arrangement distribution: $10,375 (reported on 5.4% of returns)
17034:
$10,375
Pennsylvania:
$18,583
(% of AGI for various income ranges: 39.3% for AGIs below $25k, 60.8% for AGIs $25k-50k, 471.3% for AGIs $75k-100k)
Total itemized deductions: $20,150 (reported on 1.3% of returns)
Here:
$20,150
State:
$34,850
(% of AGI for various income ranges: 84.0% for AGIs $25k-50k)
Taxes paid: $7,850 (reported on 1.3% of returns)
17034:
$7,850
State:
$8,200
(% of AGI for various income ranges: 32.7% for AGIs $25k-50k)
Earned income credit: $2,007 (reported on 20.1% of returns)
Here:
$2,007
State:
$2,100
(% of AGI for various income ranges: 77.3% for AGIs below $25k, 59.4% for AGIs $25k-50k)
Percentage of individuals using paid preparers for their 2020 taxes: 92.6%
Here:
93%
State:
92%
(% for various income ranges: 92.3% for AGIs below $25k, 91.2% for AGIs $25k-50k, 91.3% for AGIs $50k-75k, 100.0% for AGIs $75k-100k, 100.0% for AGIs $100k-200k)
Averages for the 2012 tax year for zip code 17034, filed in 2013:
Average Adjusted Gross Income (AGI) in 2012: $34,679 (Individual Income Tax Returns)
Here:
$34,679
State:
$61,346
Salary/wage: $31,955 (reported on 85.0% of returns)
Here:
$31,955
State:
$51,902
(% of AGI for various income ranges: 71.2% for AGIs below $25k, 82.1% for AGIs $25k-50k, 80.6% for AGIs $50k-75k, 78.8% for AGIs $75k-100k, 73.0% for AGIs $100k-200k)
Taxable interest for individuals: $370 (reported on 23.6% of returns)
This zip code:
$370
Pennsylvania:
$1,588
(% of AGI for various income ranges: 0.5% for AGIs below $25k, 0.2% for AGIs $25k-50k, 0.2% for AGIs $50k-75k, 0.5% for AGIs $100k-200k)
Ordinary dividends: $907 (reported on 10.0% of returns)
Here:
$907
State:
$5,827
(% of AGI for various income ranges: 0.2% for AGIs below $25k, 0.4% for AGIs $25k-50k, 0.2% for AGIs $50k-75k, 0.4% for AGIs $75k-100k)
Profit/loss from business: +$6,130 (reported on 7.1% of returns)
Here:
+$6,130
State:
+$16,268
(% of AGI for various income ranges: 4.3% for AGIs below $25k, 1.5% for AGIs $25k-50k, 0.3% for AGIs $50k-75k)
Taxable individual retirement arrangement distribution: $10,560 (reported on 7.1% of returns)
17034:
$10,560
Pennsylvania:
$14,550
(% of AGI for various income ranges: 2.0% for AGIs below $25k, 1.8% for AGIs $25k-50k, 5.6% for AGIs $50k-75k)
Total itemized deductions: $13,897 (23% of AGI, reported on 20.7% of returns)
Here:
$13,897
State:
$23,538
Here:
23.2% of AGI
State:
18.4% of AGI
(% of AGI for various income ranges: 4.2% for AGIs below $25k, 6.9% for AGIs $25k-50k, 9.6% for AGIs $50k-75k, 11.1% for AGIs $75k-100k, 11.7% for AGIs $100k-200k)
Charity contributions: $2,128 (reported on 12.9% of returns)
Here:
$2,128
State:
$4,025
(% of AGI for various income ranges: 0.7% for AGIs $25k-50k, 0.7% for AGIs $50k-75k, 1.5% for AGIs $75k-100k, 1.2% for AGIs $100k-200k)
Taxes paid: $5,666 (reported on 20.7% of returns)
17034:
$5,666
State:
$9,982
(% of AGI for various income ranges: 1.4% for AGIs below $25k, 2.6% for AGIs $25k-50k, 3.9% for AGIs $50k-75k, 5.1% for AGIs $75k-100k, 5.1% for AGIs $100k-200k)
Earned income credit: $2,145 (reported on 23.6% of returns)
Here:
$2,145
State:
$2,106
(% of AGI for various income ranges: 6.8% for AGIs below $25k, 1.0% for AGIs $25k-50k)
Percentage of individuals using paid preparers for their 2012 taxes: 40.0%
Here:
40%
State:
53%
(% for various income ranges: 38.1% for AGIs below $25k, 39.1% for AGIs $25k-50k, 44.4% for AGIs $50k-75k, 37.5% for AGIs $75k-100k, 60.0% for AGIs $100k-200k)
Averages for the 2004 tax year for zip code 17034, filed in 2005:
Average Adjusted Gross Income (AGI) in 2004: $31,561 (Individual Income Tax Returns)
Here:
$31,561
State:
$48,049
Salary/wage: $30,076 (reported on 87.2% of returns)
Here:
$30,076
State:
$42,646
(% of AGI for various income ranges: 81.9% for AGIs below $10k, 77.9% for AGIs $10k-25k, 85.8% for AGIs $25k-50k, 84.4% for AGIs $50k-75k, 81.7% for AGIs $75k-100k, 78.5% for AGIs over 100k)
Taxable interest for individuals: $895 (reported on 32.3% of returns)
This zip code:
$895
Pennsylvania:
$1,657
(% of AGI for various income ranges: 3.8% for AGIs below $10k, 1.2% for AGIs $10k-25k, 0.8% for AGIs $25k-50k, 0.7% for AGIs $50k-75k, 1.1% for AGIs $75k-100k, 0.2% for AGIs over 100k)
Taxable dividends: $727 (reported on 12.1% of returns)
Here:
$727
State:
$3,566
(% of AGI for various income ranges: 1.3% for AGIs below $10k, 0.9% for AGIs $10k-25k, 0.1% for AGIs $25k-50k, 0.2% for AGIs $50k-75k, 0.1% for AGIs $75k-100k, 0.1% for AGIs over 100k)
Net capital gain/loss: +$607 (reported on 6.3% of returns)
Here:
+$607
State:
+$9,716
(% of AGI for various income ranges: -1.3% for AGIs below $10k, -0.1% for AGIs $10k-25k, 0.1% for AGIs $25k-50k, 0.1% for AGIs $50k-75k, -0.2% for AGIs $75k-100k, 1.9% for AGIs over 100k)
Profit/loss from business: +$5,115 (reported on 7.3% of returns)
Here:
+$5,115
State:
+$14,267
(% of AGI for various income ranges: 1.9% for AGIs below $10k, 3.1% for AGIs $10k-25k, 1.1% for AGIs $25k-50k, 1.0% for AGIs $50k-75k)
IRA payment deduction: $1,600 (reported on 0.7% of returns)
17034:
$1,600
Pennsylvania:
$2,903
Total itemized deductions: $12,818 (23% of AGI, reported on 20.9% of returns)
Here:
$12,818
State:
$18,804
Here:
22.9% of AGI
State:
19.5% of AGI
(% of AGI for various income ranges: 5.2% for AGIs $10k-25k, 6.8% for AGIs $25k-50k, 10.8% for AGIs $50k-75k, 12.5% for AGIs $75k-100k, 12.3% for AGIs over 100k)
Charity contributions deductions: $1,763 (3% of AGI, reported on 17.3% of returns)
Here:
$1,763
State:
$3,337
Here:
3.0% of AGI
State:
3.3% of AGI
(% of AGI for various income ranges: 0.5% for AGIs $10k-25k, 0.8% for AGIs $25k-50k, 1.1% for AGIs $50k-75k, 1.8% for AGIs $75k-100k, 1.3% for AGIs over 100k)
Total tax: $3,501 (reported on 75.5% of returns)
17034:
$3,501
State:
$8,008
(% of AGI for various income ranges: 1.7% for AGIs below $10k, 4.0% for AGIs $10k-25k, 7.5% for AGIs $25k-50k, 9.7% for AGIs $50k-75k, 11.5% for AGIs $75k-100k, 15.0% for AGIs over 100k)
Earned income credit: $1,672 (reported on 17.8% of returns)
Here:
$1,672
State:
$1,643
Percentage of individuals using paid preparers for their 2004 taxes: 46.4%
Here:
46%
State:
56%
(% for various income ranges: 39.8% for AGIs below $10k, 49.9% for AGIs $10k-25k, 44.0% for AGIs $25k-50k, 51.6% for AGIs $50k-75k, 49.3% for AGIs $75k-100k, 56.5% for AGIs over 100k)
Household received Food Stamps/SNAP in the past 12 months: 180 Household did not receive Food Stamps/SNAP in the past 12 months: 1,125
Women who had a birth in the past 12 months: 38 (19 now married, 17 unmarried) Women who did not have a birth in the past 12 months: 644 (278 now married, 365 unmarried)
Housing units in zip code 17034 with a mortgage: 401 (8 second mortgage, 8 both second mortgage and home equity loan) Houses without a mortgage: 40
Median monthly owner costs for units with a mortgage: $1,243 Median monthly owner costs for units without a mortgage: $744
Residents with income below the poverty level in 2022:
This zip code:
10.9%
Whole state:
11.8%
Residents with income below 50% of the poverty level in 2022:
This zip code:
2.5%
Whole state:
6.1%
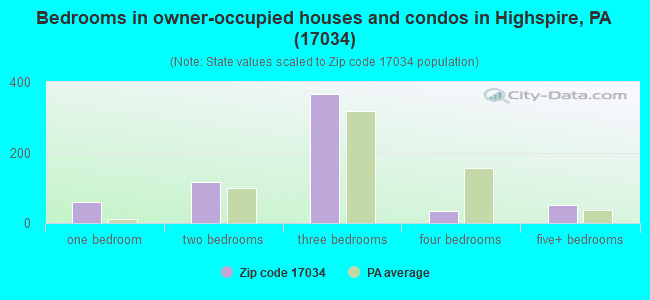
Median number of rooms in houses and condos:
Here:
6.1
State:
6.8
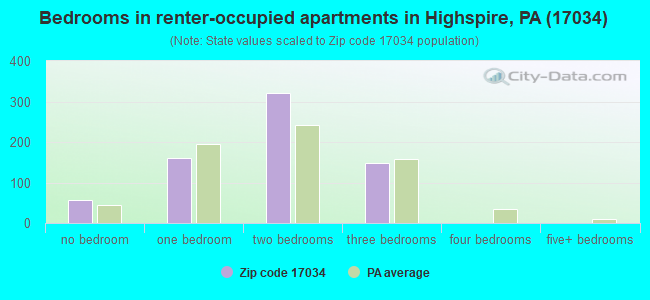
Median number of rooms in apartments:
Here:
4.0
State:
4.3
Notable locations in this zip code not listed on our city pages
Size of family households: 377 2-persons, 67 3-persons, 77 4-persons, 73 5-persons, 47 7-or-more-persons
Size of nonfamily households: 545 1-person, 130 2-persons
196 married couples with children.
302 single-parent households (101 men, 201 women).
93.5% of residents of 17034 zip code speak English at home.
4.4% of residents speak Spanish at home (58% very well, 42% not well).
1.1% of residents speak other Indo-European language at home (57% very well, 23% well, 20% not well).
0.5% of residents speak Asian or Pacific Island language at home (50% very well, 50% well).
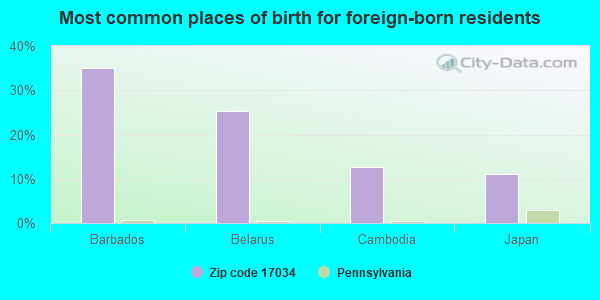
Foreign born population: 63 (2.3%) (45.3% of them are naturalized citizens)
This zip code:
2.3%
Whole state:
7.5%
35%Barbados
25%Belarus
13%Cambodia
11%Japan
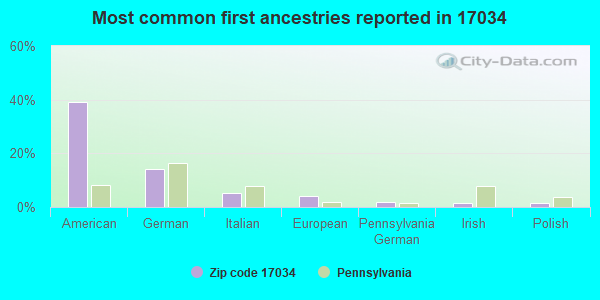
39%American
14%German
5%Italian
4%European
2%Pennsylvania German
2%Irish
2%Polish
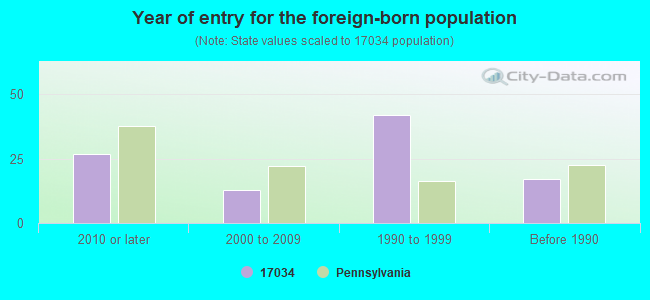
Year of entry for the foreign-born population
272010 or later
132000 to 2009
421990 to 1999
17Before 1990
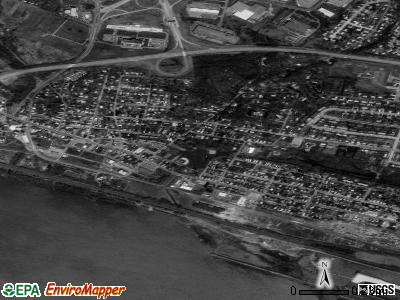
Facilities with environmental interests located in this zip code:
AMERICAN HOME FOODS (210 RACE STREET in HIGHSPIRE, PA)
National Pollutant Discharge Elimination System NON-MAJOR (Tracking pollutant discharge elimination systems) - permit Business SIC classification: CEREAL BREAKFAST FOODS
Housing units lacking complete kitchen facilities: 2.1%
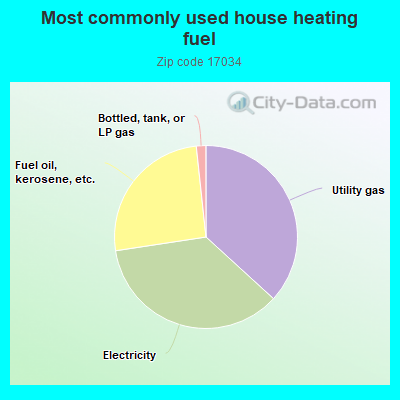
36.8%Utility gas
35.8%Electricity
25.7%Fuel oil, kerosene, etc.
1.7%Bottled, tank, or LP gas
Population in 1990: 2,670. Population change in the 1990s: +76 (+2.8%).
Place of birth for U.S.-born residents:
This state: 2,156
Northeast: 128
Midwest: 36
South: 227
West: 43
59% of the 17034 zip code residents lived in the same house 5 years ago. Out of people who lived in different houses, 66% lived in this county. Out of people who lived in different counties, 50% lived in Pennsylvania.
79% of the 17034 zip code residents lived in the same house 1 year ago. Out of people who lived in different houses, 59% moved from this county. Out of people who lived in different houses, 31% moved from different county within same state. Out of people who lived in different houses, 6% moved from different state.
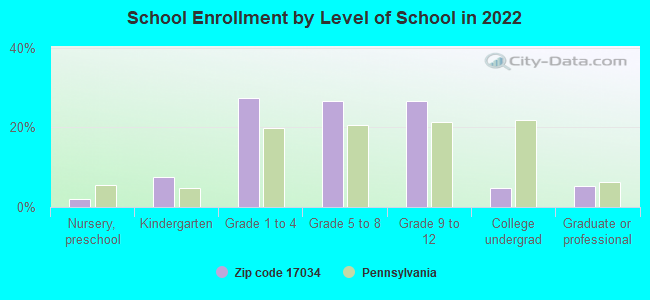
Private vs. public school enrollment:
Students in private schools in grades 1 to 8 (elementary and middle school): 171
Here:
46.9%
Pennsylvania:
15.7%
Students in private schools in grades 9 to 12 (high school):
Here:
0.0%
Pennsylvania:
13.4%
Students in private undergraduate colleges:
Here:
0.0%
Pennsylvania:
39.8%
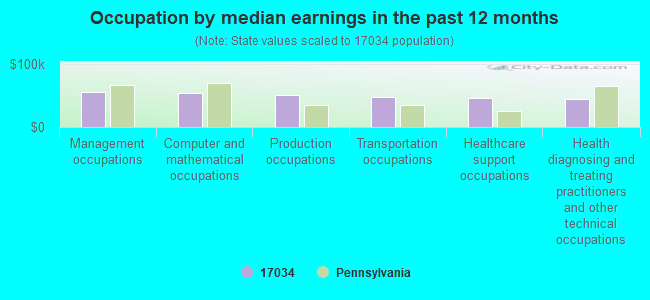
Occupation by median earnings in the past 12 months ($)
54,884Management occupations
53,990Computer and mathematical occupations
49,656Production occupations
47,071Transportation occupations
44,992Healthcare support occupations
43,479Health diagnosing and treating practitioners and other technical occupations
Companies with federal contracts located in this zip code:
SHIELDS, NANCY M (478 2ND ST in HIGHSPIRE, PA; small business) : $100,265 in 5 contractsfrom 2004 to 2005
Contracts for Other Management Support Services by Army Signed by year:2000: $0; 2001: $0; 2002: $0; 2003: $0; 2004: $95,000; 2005: $5,265; 2006: $0.
Biggest contracts:
$50,000 with Army for Other Management Support Services. Signed on 2004-06-22. Completion date: 2004-12-31.
$45,000, same as above.Signed on 2004-12-15. Completion date: 2005-06-30.
$20,000, same as above.Signed on 2005-06-01. Completion date: 2005-12-31.
$10,500, same as above.Signed on 2005-06-20. Completion date: 2005-12-31.
ALL AMERICAN TERMITE & PEST CO (128 2ND ST in HIGHSPIRE, PA; small business) : $175 in 2 contractsin 2003
$175 with Navy for Insect and Rodent Control Services. Signed on 2003-09-23. Completion date: 2003-09-19.
$0, same as above.Signed on 2003-09-23. Completion date: 2003-09-19.
Top industries in this zip code by the number of employees in 2005:
Professional, Scientific, and Technical Services: Direct Mail Advertising (50-99 employees: 1 establishment)
Other Services (except Public Administration): Linen Supply (20-49: 1)
Health Care and Social Assistance: Offices of Physicians (except Mental Health Specialists) (10-19: 1, 5-9: 1)
Accommodation and Food Services: Full-Service Restaurants (5-9: 2, 1-4: 2)
Accommodation and Food Services: Limited-Service Restaurants (5-9: 2, 1-4: 1)
Wholesale Trade: Construction and Mining (except Oil Well) Machinery and Equipment Merchant Wholesalers (10-19: 1)
Educational Services: Fine Arts Schools (10-19: 1)
Fatal accident statistics in 2013:
Fatal accident count: 1
Vehicles involved in fatal accidents: 1
Fatal accidents caused by drunken drivers: 0
Fatalities: 1
Persons involved in fatal accidents: 1
Pedestrians involved in fatal accidents: 0
Home Mortgage Disclosure Act Aggregated Statistics For Year 2009 (Based on 2 full tracts)
A) FHA, FSA/RHS & VA Home Purchase Loans
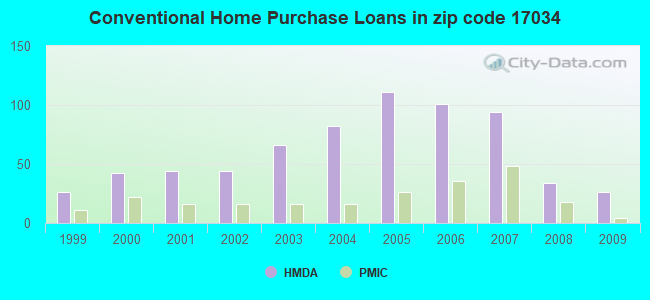
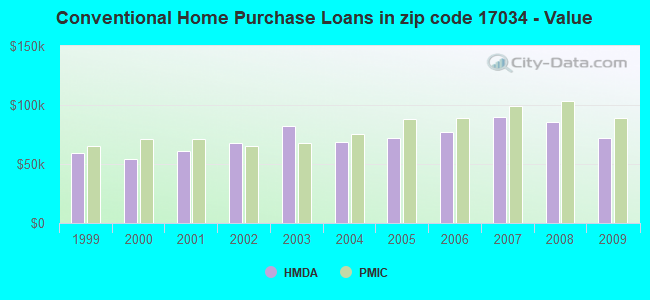
B) Conventional Home Purchase Loans
C) Refinancings
D) Home Improvement Loans
E) Loans on Dwellings For 5+ Families
F) Non-occupant Loans on < 5 Family Dwellings (A B C & D)
G) Loans On Manufactured Home Dwelling (A B C & D)
Number
Average Value
Number
Average Value
Number
Average Value
Number
Average Value
Number
Average Value
Number
Average Value
Number
Average Value
LOANS ORIGINATED
50
$103,321
26
$71,946
62
$85,955
14
$16,204
2
$310,440
14
$63,111
2
$30,845
APPLICATIONS APPROVED, NOT ACCEPTED
0
$0
0
$0
6
$37,810
2
$4,975
0
$0
0
$0
2
$34,825
APPLICATIONS DENIED
4
$85,072
18
$42,122
42
$118,500
12
$16,583
0
$0
12
$82,585
12
$25,372
APPLICATIONS WITHDRAWN
6
$134,325
2
$45,770
34
$110,035
0
$0
0
$0
6
$68,323
0
$0
FILES CLOSED FOR INCOMPLETENESS
0
$0
0
$0
4
$113,928
0
$0
0
$0
0
$0
0
$0
Aggregated Statistics For Year 2008 (Based on 2 full tracts)
A) FHA, FSA/RHS & VA Home Purchase Loans
B) Conventional Home Purchase Loans
C) Refinancings
D) Home Improvement Loans
F) Non-occupant Loans on < 5 Family Dwellings (A B C & D)
G) Loans On Manufactured Home Dwelling (A B C & D)
Number
Average Value
Number
Average Value
Number
Average Value
Number
Average Value
Number
Average Value
Number
Average Value
LOANS ORIGINATED
48
$105,926
34
$85,980
50
$82,505
42
$32,219
16
$63,804
6
$24,875
APPLICATIONS APPROVED, NOT ACCEPTED
0
$0
2
$39,800
2
$273,625
2
$20,895
0
$0
2
$39,800
APPLICATIONS DENIED
4
$112,435
18
$65,781
100
$102,803
44
$49,524
12
$63,514
2
$24,875
APPLICATIONS WITHDRAWN
4
$90,048
2
$81,590
22
$133,511
2
$84,575
2
$81,590
0
$0
FILES CLOSED FOR INCOMPLETENESS
2
$68,655
2
$110,445
8
$58,954
2
$9,950
0
$0
0
$0
Aggregated Statistics For Year 2007 (Based on 2 full tracts)
A) FHA, FSA/RHS & VA Home Purchase Loans
B) Conventional Home Purchase Loans
C) Refinancings
D) Home Improvement Loans
E) Loans on Dwellings For 5+ Families
F) Non-occupant Loans on < 5 Family Dwellings (A B C & D)
G) Loans On Manufactured Home Dwelling (A B C & D)
Number
Average Value
Number
Average Value
Number
Average Value
Number
Average Value
Number
Average Value
Number
Average Value
Number
Average Value
LOANS ORIGINATED
16
$107,211
94
$90,037
80
$78,182
22
$17,277
2
$5,273,500
26
$77,610
6
$27,860
APPLICATIONS APPROVED, NOT ACCEPTED
2
$135,320
18
$70,203
12
$78,771
8
$30,845
0
$0
8
$51,740
4
$42,288
APPLICATIONS DENIED
4
$135,818
18
$99,611
105
$96,164
32
$44,899
0
$0
6
$91,540
2
$19,900
APPLICATIONS WITHDRAWN
4
$107,958
16
$114,425
24
$96,764
6
$84,575
0
$0
4
$128,355
0
$0
FILES CLOSED FOR INCOMPLETENESS
0
$0
4
$92,535
4
$96,515
0
$0
0
$0
2
$85,570
0
$0
Aggregated Statistics For Year 2006 (Based on 2 full tracts)
A) FHA, FSA/RHS & VA Home Purchase Loans
B) Conventional Home Purchase Loans
C) Refinancings
D) Home Improvement Loans
E) Loans on Dwellings For 5+ Families
F) Non-occupant Loans on < 5 Family Dwellings (A B C & D)
G) Loans On Manufactured Home Dwelling (A B C & D)
Number
Average Value
Number
Average Value
Number
Average Value
Number
Average Value
Number
Average Value
Number
Average Value
Number
Average Value
LOANS ORIGINATED
18
$96,404
101
$77,039
88
$67,864
54
$24,875
2
$983,060
24
$89,633
4
$38,805
APPLICATIONS APPROVED, NOT ACCEPTED
2
$81,590
22
$74,263
20
$94,226
14
$25,159
2
$212,930
8
$59,949
2
$81,590
APPLICATIONS DENIED
0
$0
28
$56,146
119
$97,510
60
$23,913
0
$0
24
$44,858
6
$53,398
APPLICATIONS WITHDRAWN
0
$0
16
$92,162
68
$99,939
4
$45,770
0
$0
6
$99,168
0
$0
FILES CLOSED FOR INCOMPLETENESS
0
$0
6
$85,570
8
$80,844
4
$15,422
0
$0
4
$63,182
0
$0
Aggregated Statistics For Year 2005 (Based on 2 full tracts)
A) FHA, FSA/RHS & VA Home Purchase Loans
B) Conventional Home Purchase Loans
C) Refinancings
D) Home Improvement Loans
F) Non-occupant Loans on < 5 Family Dwellings (A B C & D)
G) Loans On Manufactured Home Dwelling (A B C & D)
Number
Average Value
Number
Average Value
Number
Average Value
Number
Average Value
Number
Average Value
Number
Average Value
LOANS ORIGINATED
12
$88,223
111
$71,963
103
$76,122
30
$38,407
24
$72,967
4
$62,685
APPLICATIONS APPROVED, NOT ACCEPTED
4
$86,068
12
$52,238
26
$67,813
2
$8,955
0
$0
4
$18,905
APPLICATIONS DENIED
4
$71,142
16
$51,616
131
$79,509
44
$32,654
16
$24,626
8
$27,114
APPLICATIONS WITHDRAWN
0
$0
4
$80,098
86
$87,143
8
$163,926
0
$0
0
$0
FILES CLOSED FOR INCOMPLETENESS
0
$0
0
$0
6
$90,213
0
$0
0
$0
0
$0
Aggregated Statistics For Year 2004 (Based on 2 full tracts)
A) FHA, FSA/RHS & VA Home Purchase Loans
B) Conventional Home Purchase Loans
C) Refinancings
D) Home Improvement Loans
E) Loans on Dwellings For 5+ Families
F) Non-occupant Loans on < 5 Family Dwellings (A B C & D)
G) Loans On Manufactured Home Dwelling (A B C & D)
Number
Average Value
Number
Average Value
Number
Average Value
Number
Average Value
Number
Average Value
Number
Average Value
Number
Average Value
LOANS ORIGINATED
16
$91,789
82
$68,364
105
$84,736
22
$26,232
0
$0
24
$108,621
6
$39,800
APPLICATIONS APPROVED, NOT ACCEPTED
6
$122,385
8
$61,939
24
$78,107
6
$25,538
0
$0
0
$0
6
$39,468
APPLICATIONS DENIED
0
$0
14
$51,456
127
$71,154
48
$13,806
2
$4,975
24
$33,747
4
$34,825
APPLICATIONS WITHDRAWN
2
$98,505
14
$80,169
70
$85,115
0
$0
0
$0
12
$59,700
0
$0
FILES CLOSED FOR INCOMPLETENESS
0
$0
2
$99,500
22
$80,776
2
$24,875
0
$0
0
$0
0
$0
Aggregated Statistics For Year 2003 (Based on 2 full tracts)
A) FHA, FSA/RHS & VA Home Purchase Loans
B) Conventional Home Purchase Loans
C) Refinancings
D) Home Improvement Loans
F) Non-occupant Loans on < 5 Family Dwellings (A B C & D)
Number
Average Value
Number
Average Value
Number
Average Value
Number
Average Value
Number
Average Value
LOANS ORIGINATED
38
$80,857
66
$81,982
221
$72,721
26
$16,226
28
$63,396
APPLICATIONS APPROVED, NOT ACCEPTED
0
$0
8
$82,585
26
$70,492
6
$11,277
4
$59,700
APPLICATIONS DENIED
2
$58,705
20
$95,420
117
$85,468
24
$21,973
4
$104,972
APPLICATIONS WITHDRAWN
0
$0
8
$97,012
58
$85,330
0
$0
2
$131,340
FILES CLOSED FOR INCOMPLETENESS
0
$0
2
$108,455
14
$49,892
0
$0
2
$58,705
Aggregated Statistics For Year 2002 (Based on 2 full tracts)
A) FHA, FSA/RHS & VA Home Purchase Loans
B) Conventional Home Purchase Loans
C) Refinancings
D) Home Improvement Loans
F) Non-occupant Loans on < 5 Family Dwellings (A B C & D)
Number
Average Value
Number
Average Value
Number
Average Value
Number
Average Value
Number
Average Value
LOANS ORIGINATED
38
$80,543
44
$67,796
121
$62,118
14
$22,459
16
$50,745
APPLICATIONS APPROVED, NOT ACCEPTED
2
$60,695
6
$26,865
36
$64,951
4
$4,975
2
$33,830
APPLICATIONS DENIED
2
$64,675
6
$63,017
133
$71,356
28
$14,783
2
$49,750
APPLICATIONS WITHDRAWN
2
$104,475
0
$0
68
$80,800
2
$13,930
2
$76,615
FILES CLOSED FOR INCOMPLETENESS
0
$0
0
$0
16
$84,326
0
$0
0
$0
Aggregated Statistics For Year 2001 (Based on 2 full tracts)
A) FHA, FSA/RHS & VA Home Purchase Loans
B) Conventional Home Purchase Loans
C) Refinancings
D) Home Improvement Loans
E) Loans on Dwellings For 5+ Families
F) Non-occupant Loans on < 5 Family Dwellings (A B C & D)
Number
Average Value
Number
Average Value
Number
Average Value
Number
Average Value
Number
Average Value
Number
Average Value
LOANS ORIGINATED
34
$74,274
44
$61,057
109
$72,297
28
$11,229
2
$221,885
8
$100,495
APPLICATIONS APPROVED, NOT ACCEPTED
2
$64,675
2
$23,880
32
$63,245
6
$16,915
0
$0
4
$107,958
APPLICATIONS DENIED
2
$60,695
26
$48,372
94
$62,325
24
$23,300
0
$0
8
$48,506
APPLICATIONS WITHDRAWN
4
$61,192
4
$70,645
46
$68,525
0
$0
0
$0
0
$0
FILES CLOSED FOR INCOMPLETENESS
0
$0
2
$71,640
22
$74,625
0
$0
0
$0
0
$0
Aggregated Statistics For Year 2000 (Based on 2 full tracts)
A) FHA, FSA/RHS & VA Home Purchase Loans
B) Conventional Home Purchase Loans
C) Refinancings
D) Home Improvement Loans
E) Loans on Dwellings For 5+ Families
F) Non-occupant Loans on < 5 Family Dwellings (A B C & D)
Number
Average Value
Number
Average Value
Number
Average Value
Number
Average Value
Number
Average Value
Number
Average Value
LOANS ORIGINATED
38
$77,296
42
$53,872
48
$47,967
34
$21,714
2
$328,350
10
$62,884
APPLICATIONS APPROVED, NOT ACCEPTED
0
$0
8
$45,770
24
$50,248
6
$14,593
0
$0
0
$0
APPLICATIONS DENIED
2
$57,710
48
$27,031
48
$58,166
14
$21,890
0
$0
12
$20,563
APPLICATIONS WITHDRAWN
6
$84,907
18
$57,821
40
$72,983
6
$71,308
0
$0
8
$46,765
FILES CLOSED FOR INCOMPLETENESS
0
$0
0
$0
16
$62,063
0
$0
0
$0
0
$0
Aggregated Statistics For Year 1999 (Based on 1 full tract)
A) FHA, FSA/RHS & VA Home Purchase Loans
B) Conventional Home Purchase Loans
C) Refinancings
D) Home Improvement Loans
E) Loans on Dwellings For 5+ Families
F) Non-occupant Loans on < 5 Family Dwellings (A B C & D)
Detailed PMIC statistics for the following Tracts:0235.00
2005 - 2018 National Fire Incident Reporting System (NFIRS) incidents
According to the data from the years 2005 - 2018 the average number of fire incidents per year is 13. The highest number of reported fire incidents - 29 took place in 2010, and the least - 4 in 2013. The data has a constant trend.
When looking into fire subcategories, the most incidents belonged to: Structure Fires (74.5%), and Other (10.1%).
Fire incident types reported to NFIRS in Zip Code 17034


 Nearest zip codes: 17113, 17319, 17111, 17057, 17070, 17370.
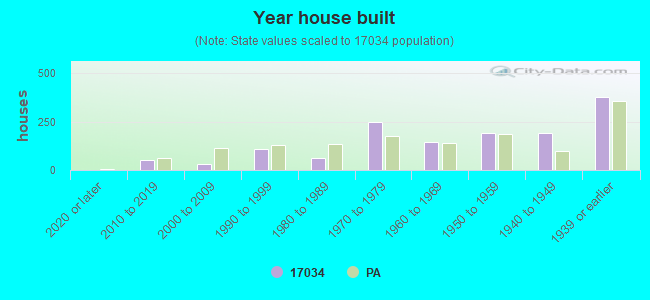


 According to the data from the years 2005 - 2018 the average number of fire incidents per year is 13. The highest number of reported fire incidents - 29 took place in 2010, and the least - 4 in 2013. The data has a constant trend.
 When looking into fire subcategories, the most incidents belonged to: Structure Fires (74.5%), and Other (10.1%).