Estimated zip code population in 2022: 5,368 Zip code population in 2010: 5,000 Zip code population in 2000: 4,841
Houses and condos: 1,795 Renter-occupied apartments: 495
% of renters here:
30%
State:
31%
March 2022 cost of living index in zip code 17004: 92.3 (less than average, U.S. average is 100)
Land area: 48.8 sq. mi. Water area: 0.1 sq. mi.
Population density: 110 people per square mile
(very low).
OSM Map
General Map
Google Map
MSN Map
OSM Map
General Map
Google Map
MSN Map
OSM Map
General Map
Google Map
MSN Map
OSM Map
General Map
Google Map
MSN Map
Please wait while loading the map...
Real estate property taxes paid for housing units in 2022:
This zip code:
1.4% ($2,941)
Pennsylvania:
1.3% ($3,094)
Median real estate property taxes paid for housing units with mortgages in 2022: $3,016 (1.5%) Median real estate property taxes paid for housing units with no mortgage in 2022: $2,828 (1.2%)
Business Search- 14 Million verified businesses
Males: 2,673
(49.8%)
Females: 2,695
(50.2%)
For population 25 years and over in 17004:
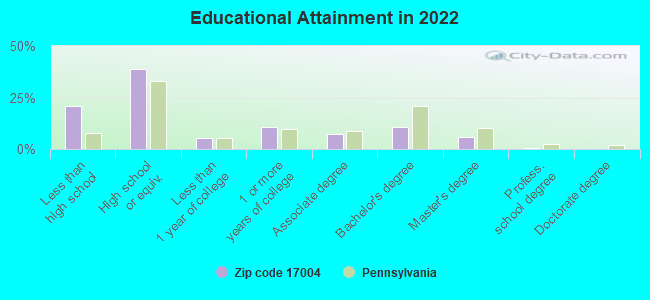
High school or higher: 76.0%
Bachelor's degree or higher: 16.0%
Graduate or professional degree: 5.8%
Unemployed: 3.8%
Mean travel time to work (commute): 23.6 minutes
For population 15 years and over in 17004:
Never married: 20.9%
Now married: 62.8%
Separated: 0.3%
Widowed: 9.1%
Divorced: 6.9%
Zip code 17004 compared to state average:
Black race population percentage significantly below state average.
Hispanic race population percentage significantly below state average.
Median age below state average.
Foreign-born population percentage significantly below state average.
Length of stay since moving in significantly above state average.
Number of college students significantly below state average.
Percentage of population with a bachelor's degree or higher significantly below state average.
Averages for the 2020 tax year for zip code 17004, filed in 2021:
Average Adjusted Gross Income (AGI) in 2020: $52,157 (Individual Income Tax Returns)
Here:
$52,157
State:
$75,707
Salary/wage: $42,755 (reported on 64.0% of returns)
Here:
$42,755
State:
$62,806
(% of AGI for various income ranges: 1252.7% for AGIs below $25k, 4771.0% for AGIs $25k-50k, 7635.0% for AGIs $50k-75k, 8991.5% for AGIs $75k-100k, 18048.9% for AGIs $100k-200k)
Taxable interest for individuals: $1,490 (reported on 48.3% of returns)
This zip code:
$1,490
Pennsylvania:
$1,633
(% of AGI for various income ranges: 121.2% for AGIs below $25k, 109.7% for AGIs $25k-50k, 124.4% for AGIs $50k-75k, 132.3% for AGIs $75k-100k, 237.8% for AGIs $100k-200k)
Ordinary dividends: $3,961 (reported on 18.0% of returns)
Here:
$3,961
State:
$7,382
(% of AGI for various income ranges: 52.7% for AGIs below $25k, 83.7% for AGIs $25k-50k, 141.9% for AGIs $50k-75k, 204.6% for AGIs $75k-100k, 693.3% for AGIs $100k-200k)
Net capital gain/loss in AGI: +$16,449 (reported on 18.5% of returns)
Here:
+$16,449
State:
+$23,522
(% of AGI for various income ranges: 56.2% for AGIs below $25k, 125.0% for AGIs $25k-50k, 306.2% for AGIs $50k-75k, 629.2% for AGIs $75k-100k, 2318.9% for AGIs $100k-200k)
Profit/loss from business: +$28,637 (reported on 28.0% of returns)
Here:
+$28,637
State:
+$16,274
(% of AGI for various income ranges: 571.5% for AGIs below $25k, 790.3% for AGIs $25k-50k, 1638.8% for AGIs $50k-75k, 1766.2% for AGIs $75k-100k, 3478.9% for AGIs $100k-200k)
Taxable individual retirement arrangement distribution: $11,078 (reported on 15.2% of returns)
17004:
$11,078
Pennsylvania:
$18,583
(% of AGI for various income ranges: 194.2% for AGIs below $25k, 280.0% for AGIs $25k-50k, 300.0% for AGIs $50k-75k, 483.1% for AGIs $75k-100k, 1213.3% for AGIs $100k-200k)
Total itemized deductions: $41,786 (reported on 3.3% of returns)
Here:
$41,786
State:
$34,850
(% of AGI for various income ranges: 320.7% for AGIs $25k-50k, 2181.1% for AGIs $100k-200k)
Charity contributions: $25,550 (reported on 2.8% of returns)
Here:
$25,550
State:
$12,392
(% of AGI for various income ranges: 1703.3% for AGIs $100k-200k)
Taxes paid: $6,329 (reported on 3.3% of returns)
17004:
$6,329
State:
$8,200
(% of AGI for various income ranges: 42.0% for AGIs $25k-50k, 352.2% for AGIs $100k-200k)
Earned income credit: $2,246 (reported on 6.2% of returns)
Here:
$2,246
State:
$2,100
(% of AGI for various income ranges: 42.7% for AGIs below $25k, 60.3% for AGIs $25k-50k)
Percentage of individuals using paid preparers for their 2020 taxes: 93.4%
Here:
93%
State:
92%
(% for various income ranges: 91.3% for AGIs below $25k, 93.5% for AGIs $25k-50k, 94.1% for AGIs $50k-75k, 95.5% for AGIs $75k-100k, 95.0% for AGIs $100k-200k, 100.0% for AGIs over 200k)
Averages for the 2012 tax year for zip code 17004, filed in 2013:
Average Adjusted Gross Income (AGI) in 2012: $40,304 (Individual Income Tax Returns)
Here:
$40,304
State:
$61,346
Salary/wage: $33,285 (reported on 65.6% of returns)
Here:
$33,285
State:
$51,902
(% of AGI for various income ranges: 51.6% for AGIs below $25k, 56.6% for AGIs $25k-50k, 64.2% for AGIs $50k-75k, 55.9% for AGIs $75k-100k, 65.8% for AGIs $100k-200k)
Taxable interest for individuals: $1,509 (reported on 52.6% of returns)
This zip code:
$1,509
Pennsylvania:
$1,588
(% of AGI for various income ranges: 4.6% for AGIs below $25k, 1.8% for AGIs $25k-50k, 1.3% for AGIs $50k-75k, 1.3% for AGIs $75k-100k, 3.1% for AGIs $100k-200k)
Ordinary dividends: $3,487 (reported on 20.3% of returns)
Here:
$3,487
State:
$5,827
(% of AGI for various income ranges: 1.9% for AGIs below $25k, 1.2% for AGIs $25k-50k, 1.0% for AGIs $50k-75k, 2.5% for AGIs $75k-100k, 4.1% for AGIs $100k-200k)
Net capital gain/loss in AGI: +$12,991 (reported on 18.2% of returns)
Here:
+$12,991
State:
+$14,495
(% of AGI for various income ranges: 3.3% for AGIs below $25k, 3.6% for AGIs $25k-50k, 3.7% for AGIs $50k-75k, 2.8% for AGIs $75k-100k, 20.4% for AGIs $100k-200k)
Profit/loss from business: +$17,814 (reported on 25.5% of returns)
Here:
+$17,814
State:
+$16,268
(% of AGI for various income ranges: 11.5% for AGIs below $25k, 11.9% for AGIs $25k-50k, 8.2% for AGIs $50k-75k, 11.0% for AGIs $75k-100k, 21.1% for AGIs $100k-200k)
Taxable individual retirement arrangement distribution: $9,457 (reported on 15.6% of returns)
17004:
$9,457
Pennsylvania:
$14,550
(% of AGI for various income ranges: 5.8% for AGIs below $25k, 2.8% for AGIs $25k-50k, 2.4% for AGIs $50k-75k, 7.5% for AGIs $75k-100k, 4.2% for AGIs $100k-200k)
Total itemized deductions: $19,065 (25% of AGI, reported on 19.3% of returns)
Here:
$19,065
State:
$23,538
Here:
24.8% of AGI
State:
18.4% of AGI
(% of AGI for various income ranges: 8.4% for AGIs below $25k, 7.6% for AGIs $25k-50k, 8.7% for AGIs $50k-75k, 10.4% for AGIs $75k-100k, 16.6% for AGIs $100k-200k)
Charity contributions: $6,677 (reported on 16.1% of returns)
Here:
$6,677
State:
$4,025
(% of AGI for various income ranges: 1.6% for AGIs below $25k, 1.8% for AGIs $25k-50k, 2.9% for AGIs $50k-75k, 2.6% for AGIs $75k-100k, 5.9% for AGIs $100k-200k)
Taxes paid: $5,297 (reported on 19.3% of returns)
17004:
$5,297
State:
$9,982
(% of AGI for various income ranges: 1.3% for AGIs below $25k, 1.5% for AGIs $25k-50k, 2.1% for AGIs $50k-75k, 2.7% for AGIs $75k-100k, 6.9% for AGIs $100k-200k)
Earned income credit: $1,848 (reported on 10.9% of returns)
Here:
$1,848
State:
$2,106
(% of AGI for various income ranges: 2.2% for AGIs below $25k, 0.9% for AGIs $25k-50k)
Percentage of individuals using paid preparers for their 2012 taxes: 79.7%
Here:
80%
State:
53%
(% for various income ranges: 77.8% for AGIs below $25k, 82.1% for AGIs $25k-50k, 80.6% for AGIs $50k-75k, 75.0% for AGIs $75k-100k, 100.0% for AGIs $100k-200k)
Averages for the 2004 tax year for zip code 17004, filed in 2005:
Average Adjusted Gross Income (AGI) in 2004: $32,846 (Individual Income Tax Returns)
Here:
$32,846
State:
$48,049
Salary/wage: $27,861 (reported on 67.5% of returns)
Here:
$27,861
State:
$42,646
(% of AGI for various income ranges: 103.2% for AGIs below $10k, 54.2% for AGIs $10k-25k, 63.7% for AGIs $25k-50k, 62.8% for AGIs $50k-75k, 61.1% for AGIs $75k-100k, 32.7% for AGIs over 100k)
Taxable interest for individuals: $1,708 (reported on 63.2% of returns)
This zip code:
$1,708
Pennsylvania:
$1,657
(% of AGI for various income ranges: 15.8% for AGIs below $10k, 5.5% for AGIs $10k-25k, 2.8% for AGIs $25k-50k, 1.8% for AGIs $50k-75k, 1.9% for AGIs $75k-100k, 3.7% for AGIs over 100k)
Taxable dividends: $2,388 (reported on 24.3% of returns)
Here:
$2,388
State:
$3,566
(% of AGI for various income ranges: 3.9% for AGIs below $10k, 2.0% for AGIs $10k-25k, 1.2% for AGIs $25k-50k, 0.8% for AGIs $50k-75k, 1.9% for AGIs $75k-100k, 3.6% for AGIs over 100k)
Net capital gain/loss: +$8,410 (reported on 21.0% of returns)
Here:
+$8,410
State:
+$9,716
(% of AGI for various income ranges: 9.9% for AGIs below $10k, 3.5% for AGIs $10k-25k, 2.7% for AGIs $25k-50k, 3.5% for AGIs $50k-75k, 4.6% for AGIs $75k-100k, 14.8% for AGIs over 100k)
Profit/loss from business: +$15,422 (reported on 26.2% of returns)
Here:
+$15,422
State:
+$14,267
(% of AGI for various income ranges: 17.3% for AGIs below $10k, 13.5% for AGIs $10k-25k, 10.7% for AGIs $25k-50k, 11.5% for AGIs $50k-75k, 8.4% for AGIs $75k-100k, 17.3% for AGIs over 100k)
Profit/loss from farming: +$11,142 (reported on 11.4% of returns)
Here:
+$11,142
State:
+$274
(% of AGI for various income ranges: -32.4% for AGIs below $10k, 4.3% for AGIs $10k-25k, 6.0% for AGIs $25k-50k, 6.2% for AGIs $50k-75k, 4.9% for AGIs $75k-100k)
IRA payment deduction: $3,226 (reported on 3.3% of returns)
17004:
$3,226
Pennsylvania:
$2,903
Self-employed pension: $10,909 (reported on 0.6% of returns)
Here:
$10,909
Pennsylvania:
$14,674
Total itemized deductions: $15,861 (24% of AGI, reported on 18.3% of returns)
Here:
$15,861
State:
$18,804
Here:
24.0% of AGI
State:
19.5% of AGI
(% of AGI for various income ranges: 17.1% for AGIs below $10k, 6.0% for AGIs $10k-25k, 6.9% for AGIs $25k-50k, 9.6% for AGIs $50k-75k, 11.5% for AGIs $75k-100k, 11.3% for AGIs over 100k)
Charity contributions deductions: $5,519 (8% of AGI, reported on 15.8% of returns)
Here:
$5,519
State:
$3,337
Here:
8.0% of AGI
State:
3.3% of AGI
(% of AGI for various income ranges: 1.2% for AGIs $10k-25k, 1.9% for AGIs $25k-50k, 3.1% for AGIs $50k-75k, 3.9% for AGIs $75k-100k, 4.2% for AGIs over 100k)
Total tax: $4,207 (reported on 67.6% of returns)
17004:
$4,207
State:
$8,008
(% of AGI for various income ranges: 3.2% for AGIs below $10k, 4.1% for AGIs $10k-25k, 6.3% for AGIs $25k-50k, 8.5% for AGIs $50k-75k, 10.9% for AGIs $75k-100k, 16.6% for AGIs over 100k)
Earned income credit: $1,500 (reported on 10.6% of returns)
Here:
$1,500
State:
$1,643
Percentage of individuals using paid preparers for their 2004 taxes: 80.8%
Here:
81%
State:
56%
(% for various income ranges: 76.9% for AGIs below $10k, 81.8% for AGIs $10k-25k, 83.2% for AGIs $25k-50k, 79.4% for AGIs $50k-75k, 75.6% for AGIs $75k-100k, 86.8% for AGIs over 100k)
Likely homosexual households (counted as self-reported same-sex unmarried-partner households)
Lesbian couples: 0.2% of all households
Gay men: 0.0% of all households
Household received Food Stamps/SNAP in the past 12 months: 97 Household did not receive Food Stamps/SNAP in the past 12 months: 1,547
Women who had a birth in the past 12 months: 146 (157 now married, 0 unmarried) Women who did not have a birth in the past 12 months: 710 (387 now married, 318 unmarried)
Housing units in zip code 17004 with a mortgage: 605 (79 second mortgage, 7 home equity loan, 69 both second mortgage and home equity loan) Houses without a mortgage: 92
Median monthly owner costs for units with a mortgage: $1,353 Median monthly owner costs for units without a mortgage: $568
Residents with income below the poverty level in 2022:
This zip code:
15.1%
Whole state:
11.8%
Residents with income below 50% of the poverty level in 2022:
This zip code:
13.0%
Whole state:
6.1%
Median number of rooms in houses and condos:
Here:
7.0
State:
6.8
Median number of rooms in apartments:
Here:
4.9
State:
4.3
Notable locations in this zip code not listed on our city pages
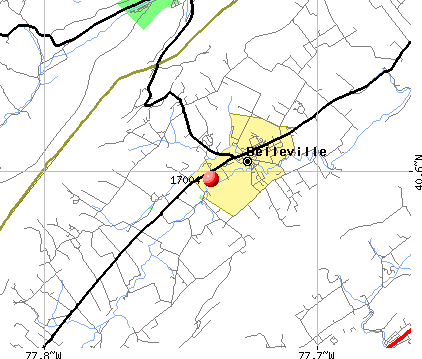
Churches in zip code 17004 include: Valley Church (A), Locust Grove Church (B), Maple Grove Church (C), Saint Johns Church (D), Big Valley Church (E). Display/hide their locations on the map
In group quarters: 157 (-1 institutionalized population)
Size of family households: 571 2-persons, 296 3-persons, 115 4-persons, 96 5-persons, 28 6-persons, 179 7-or-more-persons
Size of nonfamily households: 294 1-person, 73 2-persons
1,860 married couples with children.
67 single-parent households (15 men, 52 women).
66.9% of residents of 17004 zip code speak English at home.
2.2% of residents speak Spanish at home (33% very well, 67% not well).
31.8% of residents speak other Indo-European language at home (68% very well, 28% well, 4% not well).
Foreign born population: 4 (0.1%) (51.0% of them are naturalized citizens)
This zip code:
0.1%
Whole state:
7.5%
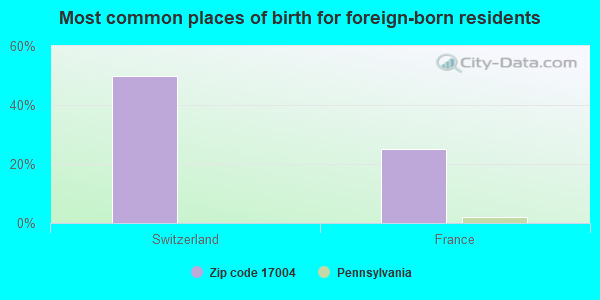
50%Switzerland
25%France
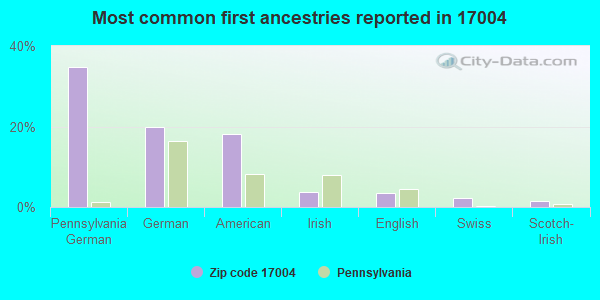
35%Pennsylvania German
20%German
18%American
4%Irish
3%English
2%Swiss
2%Scotch-Irish
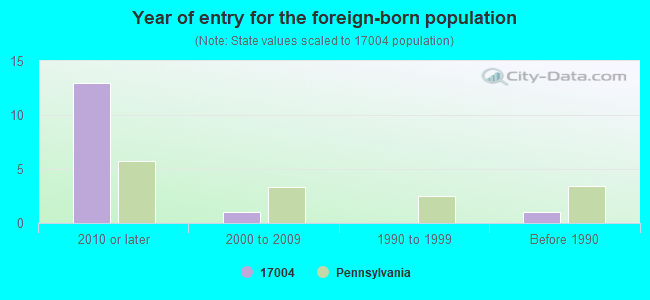
Year of entry for the foreign-born population
132010 or later
12000 to 2009
01990 to 1999
1Before 1990
Facilities with environmental interests located in this zip code:
AGWAY INC (4408 EAST MAIN STREET in BELLEVILLE, PA)
AIR MINOR (AIRS/AFS)
Housing units lacking complete plumbing facilities: 3.9% Housing units lacking complete kitchen facilities: 11.6%
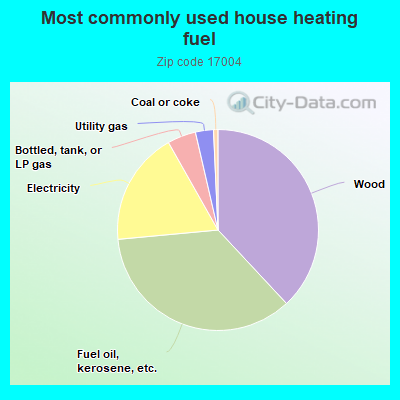
38.1%Wood
35.5%Fuel oil, kerosene, etc.
18.3%Electricity
4.6%Bottled, tank, or LP gas
2.9%Utility gas
0.7%Coal or coke
Population in 1990: 4,203. Population change in the 1990s: +638 (+15.2%).
Place of birth for U.S.-born residents:
This state: 4,699
Northeast: 110
Midwest: 172
South: 285
West: 48
67% of the 17004 zip code residents lived in the same house 5 years ago. Out of people who lived in different houses, 79% lived in this county. Out of people who lived in different counties, 50% lived in Pennsylvania.
96% of the 17004 zip code residents lived in the same house 1 year ago. Out of people who lived in different houses, 43% moved from this county. Out of people who lived in different houses, 41% moved from different county within same state. Out of people who lived in different houses, 20% moved from different state.
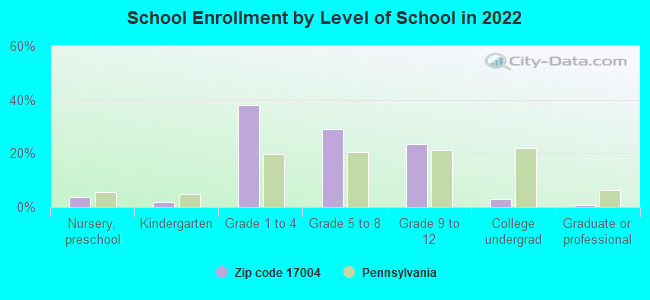
Private vs. public school enrollment:
Students in private schools in grades 1 to 8 (elementary and middle school): 445
Here:
61.2%
Pennsylvania:
15.7%
Students in private schools in grades 9 to 12 (high school): 102
Here:
41.9%
Pennsylvania:
13.4%
Students in private undergraduate colleges: 24
Here:
76.2%
Pennsylvania:
39.8%
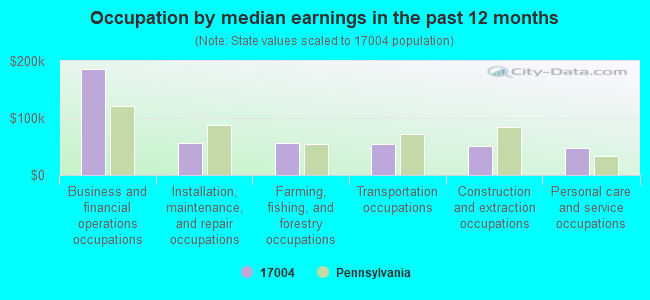
Occupation by median earnings in the past 12 months ($)
186,149Business and financial operations occupations
56,232Installation, maintenance, and repair occupations
56,055Farming, fishing, and forestry occupations
55,186Transportation occupations
50,774Construction and extraction occupations
47,816Personal care and service occupations
Companies with federal contracts located in this zip code:
THOMAS R MILLER CO INC (149 STONEWOOD DRIVE in BELLEVILLE, PA; small business) : $652,215 in 32 contractsfrom 2001 to 2006
Contracts for Motors, Electrical, Bearings, Antifriction, Unmounted, Miscellaneous Electrical and Electronic Components, Electrical and Electronic assemblies, Boards, Cards, and Associated Hardware, and moreby Defense Logistics Agency, Navy, U.S. Coast Guard Signed by year:2000: $0; 2001: $35,844; 2002: $55,156; 2003: $0; 2004: $216,049; 2005: $261,800; 2006: $83,366.
Biggest contracts:
$80,935 with Defense Logistics Agency for Motors, Electrical. Signed on 2005-08-12. Completion date: 2006-01-19.
$55,156, same as above.Signed on 2002-08-31. Completion date: 2003-02-27.
$50,151, same as above.Signed on 2004-04-01. Completion date: 2004-09-16.
$42,255, same as above.Signed on 2006-02-06. Completion date: 2006-07-24.
Top industries in this zip code by the number of employees in 2005:
Health Care and Social Assistance: Continuing Care Retirement Communities (250-499 employees: 1 establishment)
Educational Services: Elementary and Secondary Schools (20-49: 1, 5-9: 2)

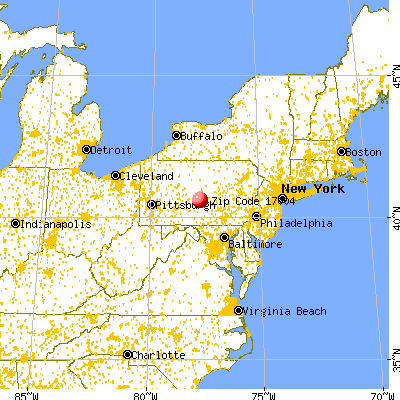


 Nearest zip codes: 17029, 17084, 17044, 17051, 17002, 17099.