Estimated zip code population in 2022: 3,215 Zip code population in 2010: 3,378 Zip code population in 2000: 2,987
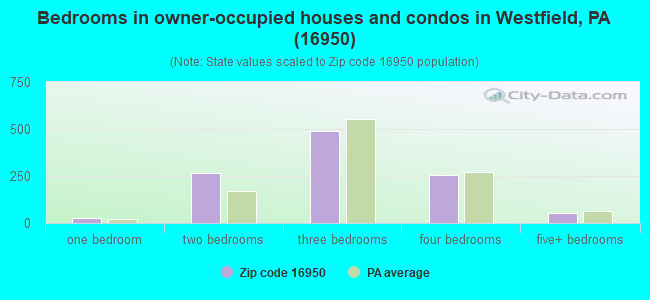
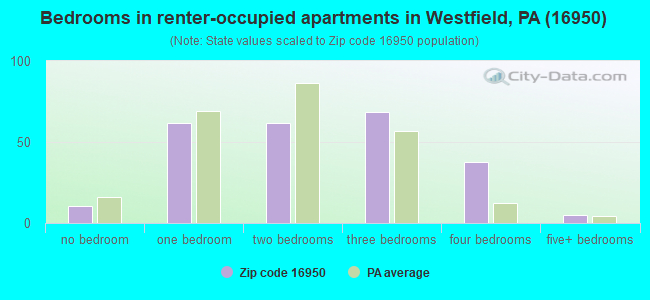
Houses and condos: 1,937 Renter-occupied apartments: 247
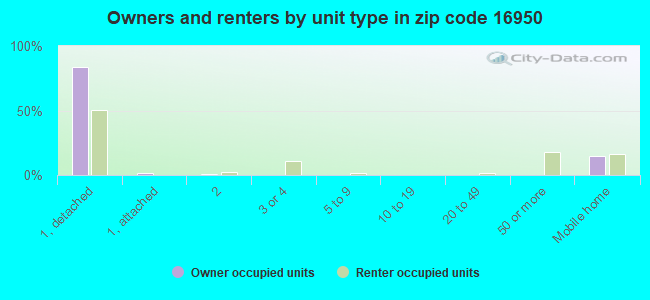
% of renters here:
19%
State:
31%
March 2022 cost of living index in zip code 16950: 90.9 (less than average, U.S. average is 100)
Land area: 114.6 sq. mi. Water area: 0.2 sq. mi.
Population density: 28 people per square mile
(very low).
OSM Map
General Map
Google Map
MSN Map
OSM Map
General Map
Google Map
MSN Map
OSM Map
General Map
Google Map
MSN Map
OSM Map
General Map
Google Map
MSN Map
Please wait while loading the map...
Real estate property taxes paid for housing units in 2022:
This zip code:
1.2% ($1,540)
Pennsylvania:
1.3% ($3,094)
Median real estate property taxes paid for housing units with mortgages in 2022: $1,913 (1.2%) Median real estate property taxes paid for housing units with no mortgage in 2022: $1,380 (1.1%)
Business Search- 14 Million verified businesses
Males: 1,650
(51.3%)
Females: 1,565
(48.7%)
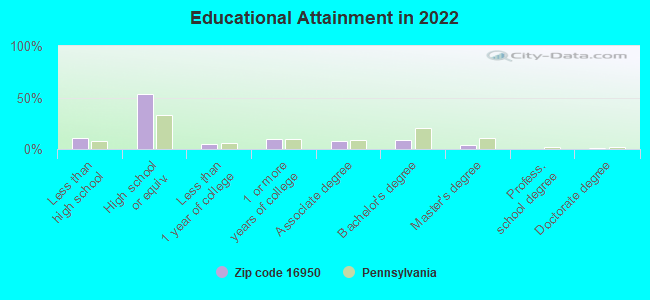
For population 25 years and over in 16950:
High school or higher: 87.1%
Bachelor's degree or higher: 13.0%
Graduate or professional degree: 4.3%
Unemployed: 4.6%
Mean travel time to work (commute): 27.9 minutes
For population 15 years and over in 16950:
Never married: 24.9%
Now married: 52.9%
Separated: 2.7%
Widowed: 7.6%
Divorced: 12.0%
Zip code 16950 compared to state average:
Median house value below state average.
Black race population percentage significantly below state average.
Hispanic race population percentage significantly below state average.
Median age above state average.
Foreign-born population percentage significantly below state average.
Renting percentage below state average.
Length of stay since moving in above state average.
Number of college students significantly below state average.
Percentage of population with a bachelor's degree or higher significantly below state average.
Averages for the 2020 tax year for zip code 16950, filed in 2021:
Average Adjusted Gross Income (AGI) in 2020: $48,030 (Individual Income Tax Returns)
Here:
$48,030
State:
$75,707
Salary/wage: $41,339 (reported on 73.7% of returns)
Here:
$41,339
State:
$62,806
(% of AGI for various income ranges: 999.4% for AGIs below $25k, 3101.0% for AGIs $25k-50k, 5501.0% for AGIs $50k-75k, 8058.0% for AGIs $75k-100k, 14339.0% for AGIs $100k-200k)
Taxable interest for individuals: $810 (reported on 32.2% of returns)
This zip code:
$810
Pennsylvania:
$1,633
(% of AGI for various income ranges: 25.8% for AGIs below $25k, 18.0% for AGIs $25k-50k, 23.5% for AGIs $50k-75k, 97.0% for AGIs $75k-100k, 106.0% for AGIs $100k-200k)
Ordinary dividends: $2,771 (reported on 18.4% of returns)
Here:
$2,771
State:
$7,382
(% of AGI for various income ranges: 30.8% for AGIs below $25k, 22.3% for AGIs $25k-50k, 49.0% for AGIs $50k-75k, 211.0% for AGIs $75k-100k, 289.0% for AGIs $100k-200k)
Net capital gain/loss in AGI: +$5,536 (reported on 14.5% of returns)
Here:
+$5,536
State:
+$23,522
(% of AGI for various income ranges: 7.8% for AGIs below $25k, 35.7% for AGIs $25k-50k, 129.0% for AGIs $50k-75k, 277.0% for AGIs $75k-100k, 548.0% for AGIs $100k-200k)
Profit/loss from business: +$6,775 (reported on 13.2% of returns)
Here:
+$6,775
State:
+$16,274
(% of AGI for various income ranges: 73.3% for AGIs below $25k, 139.3% for AGIs $25k-50k, 149.0% for AGIs $50k-75k, 80.0% for AGIs $75k-100k, 295.0% for AGIs $100k-200k)
Taxable individual retirement arrangement distribution: $11,176 (reported on 11.2% of returns)
16950:
$11,176
Pennsylvania:
$18,583
(% of AGI for various income ranges: 91.4% for AGIs below $25k, 94.3% for AGIs $25k-50k, 159.5% for AGIs $50k-75k, 375.0% for AGIs $75k-100k, 594.0% for AGIs $100k-200k)
Total itemized deductions: $35,850 (reported on 1.3% of returns)
Here:
$35,850
State:
$34,850
(% of AGI for various income ranges: 358.5% for AGIs $50k-75k)
Taxes paid: $6,067 (reported on 2.0% of returns)
16950:
$6,067
State:
$8,200
(% of AGI for various income ranges: 182.0% for AGIs $75k-100k)
Earned income credit: $2,164 (reported on 16.4% of returns)
Here:
$2,164
State:
$2,100
(% of AGI for various income ranges: 101.9% for AGIs below $25k, 58.0% for AGIs $25k-50k)
Percentage of individuals using paid preparers for their 2020 taxes: 93.4%
Here:
93%
State:
92%
(% for various income ranges: 91.2% for AGIs below $25k, 94.7% for AGIs $25k-50k, 96.2% for AGIs $50k-75k, 93.3% for AGIs $75k-100k, 93.8% for AGIs $100k-200k)
Averages for the 2012 tax year for zip code 16950, filed in 2013:
Average Adjusted Gross Income (AGI) in 2012: $40,337 (Individual Income Tax Returns)
Here:
$40,337
State:
$61,346
Salary/wage: $35,197 (reported on 79.6% of returns)
Here:
$35,197
State:
$51,902
(% of AGI for various income ranges: 68.5% for AGIs below $25k, 72.0% for AGIs $25k-50k, 75.9% for AGIs $50k-75k, 76.1% for AGIs $75k-100k, 55.9% for AGIs $100k-200k)
Taxable interest for individuals: $1,012 (reported on 32.7% of returns)
This zip code:
$1,012
Pennsylvania:
$1,588
(% of AGI for various income ranges: 1.8% for AGIs below $25k, 0.6% for AGIs $25k-50k, 0.7% for AGIs $50k-75k, 0.5% for AGIs $75k-100k, 0.8% for AGIs $100k-200k)
Ordinary dividends: $2,910 (reported on 19.7% of returns)
Here:
$2,910
State:
$5,827
(% of AGI for various income ranges: 1.4% for AGIs below $25k, 1.0% for AGIs $25k-50k, 1.3% for AGIs $50k-75k, 0.6% for AGIs $75k-100k, 2.6% for AGIs $100k-200k)
Net capital gain/loss in AGI: +$4,894 (reported on 10.9% of returns)
Here:
+$4,894
State:
+$14,495
(% of AGI for various income ranges: 0.2% for AGIs below $25k, 1.6% for AGIs $25k-50k, 1.5% for AGIs $50k-75k, 0.4% for AGIs $75k-100k, 3.8% for AGIs $100k-200k)
Profit/loss from business: +$8,471 (reported on 14.3% of returns)
Here:
+$8,471
State:
+$16,268
(% of AGI for various income ranges: 6.7% for AGIs below $25k, 4.5% for AGIs $25k-50k, 1.4% for AGIs $50k-75k, 4.3% for AGIs $75k-100k)
Taxable individual retirement arrangement distribution: $8,338 (reported on 10.9% of returns)
16950:
$8,338
Pennsylvania:
$14,550
(% of AGI for various income ranges: 2.9% for AGIs below $25k, 2.4% for AGIs $25k-50k, 2.1% for AGIs $50k-75k, 5.0% for AGIs $75k-100k)
Total itemized deductions: $18,067 (21% of AGI, reported on 14.3% of returns)
Here:
$18,067
State:
$23,538
Here:
20.6% of AGI
State:
18.4% of AGI
(% of AGI for various income ranges: 5.4% for AGIs below $25k, 3.9% for AGIs $25k-50k, 6.0% for AGIs $50k-75k, 7.4% for AGIs $75k-100k, 9.2% for AGIs $100k-200k)
Charity contributions: $3,415 (reported on 8.8% of returns)
Here:
$3,415
State:
$4,025
(% of AGI for various income ranges: 0.5% for AGIs $25k-50k, 0.7% for AGIs $50k-75k, 1.0% for AGIs $75k-100k, 1.3% for AGIs $100k-200k)
Taxes paid: $5,824 (reported on 14.3% of returns)
16950:
$5,824
State:
$9,982
(% of AGI for various income ranges: 1.1% for AGIs below $25k, 1.1% for AGIs $25k-50k, 1.4% for AGIs $50k-75k, 2.8% for AGIs $75k-100k, 3.7% for AGIs $100k-200k)
Earned income credit: $2,126 (reported on 21.1% of returns)
Here:
$2,126
State:
$2,106
(% of AGI for various income ranges: 6.5% for AGIs below $25k, 1.1% for AGIs $25k-50k)
Percentage of individuals using paid preparers for their 2012 taxes: 68.7%
Here:
69%
State:
53%
(% for various income ranges: 64.6% for AGIs below $25k, 66.7% for AGIs $25k-50k, 73.9% for AGIs $50k-75k, 72.7% for AGIs $75k-100k, 88.9% for AGIs $100k-200k)
Averages for the 2004 tax year for zip code 16950, filed in 2005:
Average Adjusted Gross Income (AGI) in 2004: $28,432 (Individual Income Tax Returns)
Here:
$28,432
State:
$48,049
Salary/wage: $26,319 (reported on 81.8% of returns)
Here:
$26,319
State:
$42,646
(% of AGI for various income ranges: 119.0% for AGIs below $10k, 74.3% for AGIs $10k-25k, 78.5% for AGIs $25k-50k, 76.4% for AGIs $50k-75k, 74.2% for AGIs $75k-100k, 51.6% for AGIs over 100k)
Taxable interest for individuals: $1,559 (reported on 42.5% of returns)
This zip code:
$1,559
Pennsylvania:
$1,657
(% of AGI for various income ranges: 6.8% for AGIs below $10k, 2.7% for AGIs $10k-25k, 1.7% for AGIs $25k-50k, 3.0% for AGIs $50k-75k, 1.0% for AGIs $75k-100k, 2.1% for AGIs over 100k)
Taxable dividends: $1,259 (reported on 21.6% of returns)
Here:
$1,259
State:
$3,566
(% of AGI for various income ranges: 3.5% for AGIs below $10k, 0.9% for AGIs $10k-25k, 1.1% for AGIs $25k-50k, 0.7% for AGIs $50k-75k, 0.5% for AGIs $75k-100k, 1.0% for AGIs over 100k)
Net capital gain/loss: +$3,707 (reported on 15.3% of returns)
Here:
+$3,707
State:
+$9,716
(% of AGI for various income ranges: 12.9% for AGIs below $10k, 1.5% for AGIs $10k-25k, 0.7% for AGIs $25k-50k, 2.0% for AGIs $50k-75k, 5.3% for AGIs $75k-100k)
Profit/loss from business: +$3,793 (reported on 14.6% of returns)
Here:
+$3,793
State:
+$14,267
(% of AGI for various income ranges: 5.9% for AGIs below $10k, 3.3% for AGIs $10k-25k, 2.5% for AGIs $25k-50k, 0.9% for AGIs $50k-75k, 0.5% for AGIs $75k-100k)
IRA payment deduction: $2,455 (reported on 2.4% of returns)
16950:
$2,455
Pennsylvania:
$2,903
Total itemized deductions: $14,603 (26% of AGI, reported on 10.4% of returns)
Here:
$14,603
State:
$18,804
Here:
25.9% of AGI
State:
19.5% of AGI
(% of AGI for various income ranges: 2.9% for AGIs $10k-25k, 4.4% for AGIs $25k-50k, 7.0% for AGIs $50k-75k, 8.6% for AGIs $75k-100k, 7.8% for AGIs over 100k)
Charity contributions deductions: $2,879 (5% of AGI, reported on 7.9% of returns)
Here:
$2,879
State:
$3,337
Here:
4.9% of AGI
State:
3.3% of AGI
(% of AGI for various income ranges: 0.3% for AGIs $10k-25k, 0.6% for AGIs $25k-50k, 0.9% for AGIs $50k-75k, 2.7% for AGIs $75k-100k)
Total tax: $3,015 (reported on 68.4% of returns)
16950:
$3,015
State:
$8,008
(% of AGI for various income ranges: 3.7% for AGIs below $10k, 3.7% for AGIs $10k-25k, 5.9% for AGIs $25k-50k, 8.7% for AGIs $50k-75k, 10.6% for AGIs $75k-100k, 15.3% for AGIs over 100k)
Earned income credit: $1,800 (reported on 22.1% of returns)
Here:
$1,800
State:
$1,643
Percentage of individuals using paid preparers for their 2004 taxes: 70.5%
Here:
70%
State:
56%
(% for various income ranges: 61.5% for AGIs below $10k, 72.4% for AGIs $10k-25k, 70.6% for AGIs $25k-50k, 75.9% for AGIs $50k-75k, 83.0% for AGIs $75k-100k, 81.0% for AGIs over 100k)
Likely homosexual households (counted as self-reported same-sex unmarried-partner households)
Lesbian couples: 0.1% of all households
Gay men: 0.0% of all households
Household received Food Stamps/SNAP in the past 12 months: 198 Household did not receive Food Stamps/SNAP in the past 12 months: 1,138
Women who had a birth in the past 12 months: 29 (20 now married, 8 unmarried) Women who did not have a birth in the past 12 months: 616 (250 now married, 366 unmarried)
Housing units in zip code 16950 with a mortgage: 399 (26 second mortgage, 24 both second mortgage and home equity loan) Houses without a mortgage: 37
Median monthly owner costs for units with a mortgage: $1,232 Median monthly owner costs for units without a mortgage: $480
Residents with income below the poverty level in 2022:
This zip code:
17.4%
Whole state:
11.8%
Residents with income below 50% of the poverty level in 2022:
This zip code:
5.7%
Whole state:
6.1%
Median number of rooms in houses and condos:
Here:
6.6
State:
6.8
Median number of rooms in apartments:
Here:
5.1
State:
4.3
Notable locations in this zip code not listed on our city pages
Notable locations in zip code 16950: Boom Corners (A), Crary Hose Company (B), Chatham Volunteer Fire Company (C), Clymer Township Volunteer Hose Company (D). Display/hide their locations on the map
Cemeteries: Krusen Cemetery (1), Ackley Cemetery (2), Baker Cemetery (3), Swimley Cemetery (4), Champlin Cemetery (5), River View Cemetery (6), Mount Pleasant Cemetery (7). Display/hide their locations on the map
Streams, rivers, and creeks: Closes Creek (A), Dodge Hollow Run (B), Crance Brook (C), Wattles Run (D), Jemison Creek (E), Mill Creek (F), Crippen Run (G), California Brook (H), North Fork Cowanesque River (I). Display/hide their locations on the map
354 married couples with children.
227 single-parent households (34 men, 193 women).
99.2% of residents of 16950 zip code speak English at home.
0.3% of residents speak Spanish at home (89% very well, 11% well).
0.1% of residents speak other Indo-European language at home (100% very well).
0.1% of residents speak other language at home (100% very well).
Foreign born population: 16 (0.5%) (69.6% of them are naturalized citizens)
This zip code:
0.5%
Whole state:
7.5%
56%Philippines
19%Algeria
12%Denmark
12%France
6%Thailand
6%Guyana
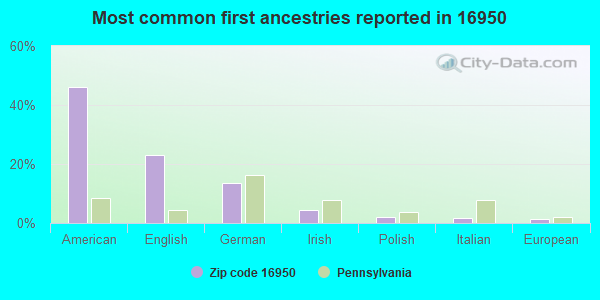
46%American
23%English
14%German
5%Irish
2%Polish
2%Italian
2%European
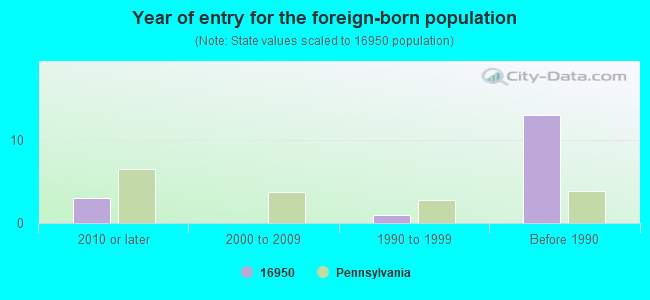
Year of entry for the foreign-born population
32010 or later
02000 to 2009
11990 to 1999
13Before 1990
Housing units lacking complete plumbing facilities: 5.8% Housing units lacking complete kitchen facilities: 2.7%
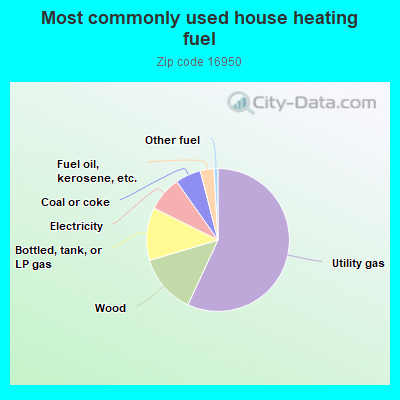
57.1%Utility gas
13.5%Wood
12.0%Bottled, tank, or LP gas
7.9%Electricity
5.8%Coal or coke
3.1%Fuel oil, kerosene, etc.
0.9%Other fuel
Population in 1990: 2,844. Population change in the 1990s: +143 (+5.0%).
Place of birth for U.S.-born residents:
This state: 2,355
Northeast: 633
Midwest: 36
South: 149
West: 14
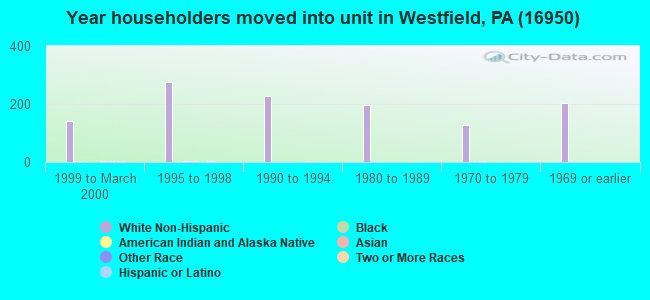
66% of the 16950 zip code residents lived in the same house 5 years ago. Out of people who lived in different houses, 57% lived in this county. Out of people who lived in different counties, 50% lived in Pennsylvania.
94% of the 16950 zip code residents lived in the same house 1 year ago. Out of people who lived in different houses, 73% moved from this county. Out of people who lived in different houses, 9% moved from different county within same state. Out of people who lived in different houses, 18% moved from different state.
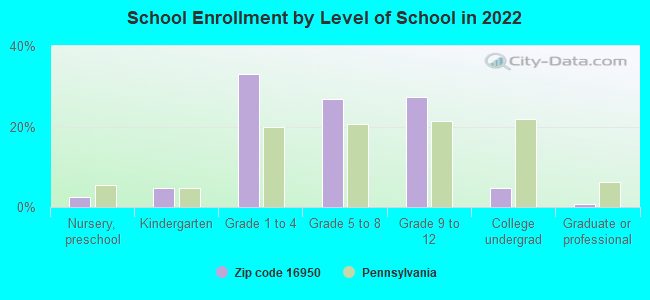
Private vs. public school enrollment:
Students in private schools in grades 1 to 8 (elementary and middle school): 63
Here:
17.9%
Pennsylvania:
15.7%
Students in private schools in grades 9 to 12 (high school): 38
Here:
24.1%
Pennsylvania:
13.4%
Students in private undergraduate colleges:
Here:
3.4%
Pennsylvania:
39.8%
Occupation by median earnings in the past 12 months ($)
76,470Computer and mathematical occupations
65,791Education, training, and library occupations
58,714Architecture and engineering occupations
49,562Office and administrative support occupations
49,544Farming, fishing, and forestry occupations
48,344Health diagnosing and treating practitioners and other technical occupations
Companies with federal contracts located in this zip code:
MOUNTAIN HOME SERVICES (RR #4 BOX 1109 in WESTFIELD, PA; small business) : $1,138,678 in 43 contractsfrom 2000 to 2006
Contracts for Custodial Janitorial Services, Landscaping/Groundskeeping Services, Trash/Garbage Collection Services - Including Portable Sanitation Services, Land Treatment Practices Services (plowing/clearing, etc.), and moreby U.S. Army Corps of Engineers - civil program financing only, Army Signed by year:2000: $38,363; 2001: $99,418; 2002: $200,171; 2003: $91,766; 2004: $295,764; 2005: $412,535; 2006: $661.
Biggest contracts:
$71,467 with U.S. Army Corps of Engineers - civil program financing only for Custodial Janitorial Services. Signed on 2004-05-26. Completion date: 2004-04-19.
$71,467 with Army for Custodial Janitorial Services. Signed on 2004-05-26. Completion date: 2004-04-19.
$70,604 with U.S. Army Corps of Engineers - civil program financing only for Landscaping/Groundskeeping Services. Signed on 2002-04-16. Completion date: 2002-09-30.
$58,823, same as above.Signed on 2003-04-11. Completion date: 2003-09-30.
JOYCE MCCAWLEY (2060 STATE ROUTE 49 in WESTFIELD, PA; small business) : $71,730 in 3 contractsfrom 2005 to 2006
$23,940 with Army for Guard Services. Signed on 2006-05-10. Completion date: 2005-09-30.
$23,895, same as above.Signed on 2005-03-25. Completion date: 2005-09-30.
$23,895 with U.S. Army Corps of Engineers - civil program financing only for Guard Services. Signed on 2005-03-25. Completion date: 2005-09-30.
Top industries in this zip code by the number of employees in 2005:
Health Care and Social Assistance: Other Residential Care Facilities (20-49 employees: 1 establishment)
Accommodation and Food Services: Limited-Service Restaurants (10-19: 1, 5-9: 2)
Utilities: Electric Power Distribution (10-19: 1, 1-4: 1)
Health Care and Social Assistance: Child Day Care Services (10-19: 1)
People in group quarters in 2010:
9 people in nursing facilities/skilled-nursing facilities
9 people in residential treatment centers for adults
People in group quarters in 2000:
18 people in training schools for juvenile delinquents
6 people in nursing homes
2 people in other nonhousehold living situations
Fatal accident statistics in 2011:
Fatal accident count: 1
Vehicles involved in fatal accidents: 2
Fatal accidents caused by drunken drivers: 0
Fatalities: 1
Persons involved in fatal accidents: 2
Pedestrians involved in fatal accidents: 0
Fatal accident statistics in 2010:
Fatal accident count: 1
Vehicles involved in fatal accidents: 2
Fatal accidents caused by drunken drivers: 1
Fatalities: 1
Persons involved in fatal accidents: 2
Pedestrians involved in fatal accidents: 0
Most common first names in zip code 16950 among deceased individuals
Name
Count
Lived (average)
Mary
24
81.5 years
Robert
24
71.4 years
John
21
71.2 years
William
20
71.1 years
Charles
20
78.2 years
George
18
75.7 years
James
16
75.7 years
Harold
15
80.2 years
Helen
12
83.3 years
Arthur
12
79.2 years
Most common last names in zip code 16950 among deceased individuals
Last name
Count
Lived (average)
King
14
78.4 years
Davis
12
79.9 years
Houghtaling
12
73.6 years
Clark
12
73.8 years
Baker
11
76.8 years
Metcalf
11
71.3 years
Taft
11
70.4 years
Abbott
9
78.8 years
English
9
72.4 years
Robbins
9
74.6 years
Businesses in zip code 16950
Subway: 1
True Value: 1
Discuss Westfield, Pennsylvania (PA) on our hugely popular Pennsylvania forum.

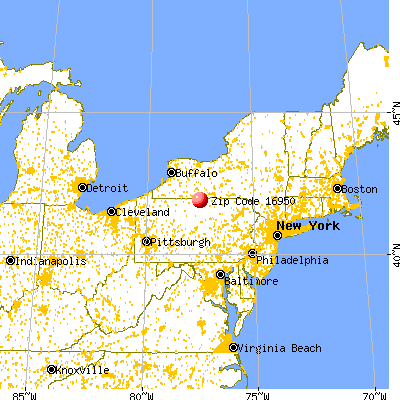


 Nearest zip codes: 16943, 16928, 16927, 14885, 16921, 14898.


 : $1,138,678 in 43 contracts from 2000 to 2006