Estimated zip code population in 2022: 4,610 Zip code population in 2010: 4,818 Zip code population in 2000: 5,037
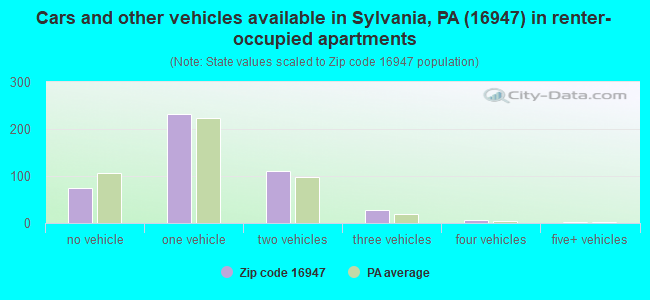
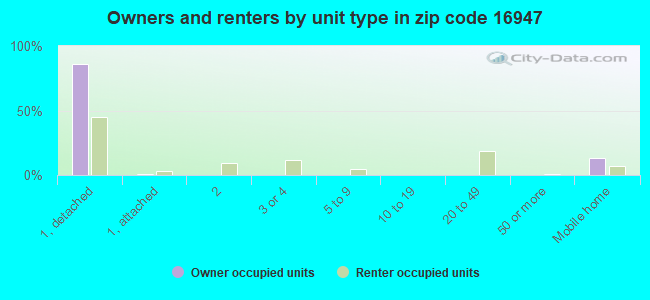
Houses and condos: 2,272 Renter-occupied apartments: 453
% of renters here:
26%
State:
31%
March 2022 cost of living index in zip code 16947: 91.2 (less than average, U.S. average is 100)
Land area: 115.3 sq. mi. Water area: 0.5 sq. mi.
Population density: 40 people per square mile
(very low).
OSM Map
General Map
Google Map
MSN Map
OSM Map
General Map
Google Map
MSN Map
OSM Map
General Map
Google Map
MSN Map
OSM Map
General Map
Google Map
MSN Map
Please wait while loading the map...
Real estate property taxes paid for housing units in 2022:
This zip code:
1.0% ($1,722)
Pennsylvania:
1.3% ($3,094)
Median real estate property taxes paid for housing units with mortgages in 2022: $1,968 (1.1%) Median real estate property taxes paid for housing units with no mortgage in 2022: $1,583 (0.9%)
Business Search- 14 Million verified businesses
Males: 2,260
(49.0%)
Females: 2,350
(51.0%)
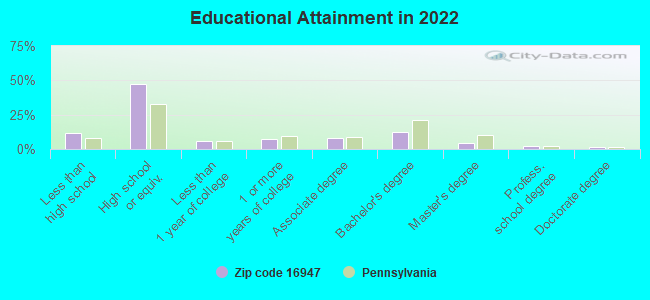
For population 25 years and over in 16947:
High school or higher: 87.6%
Bachelor's degree or higher: 19.4%
Graduate or professional degree: 7.4%
Unemployed: 1.7%
Mean travel time to work (commute): 21.9 minutes
For population 15 years and over in 16947:
Never married: 25.6%
Now married: 51.1%
Separated: 0.9%
Widowed: 9.2%
Divorced: 13.2%
Zip code 16947 compared to state average:
Unemployed percentage below state average.
Black race population percentage significantly below state average.
Hispanic race population percentage below state average.
Median age above state average.
Foreign-born population percentage below state average.
Length of stay since moving in significantly above state average.
Number of college students below state average.
Percentage of population with a bachelor's degree or higher below state average.
Averages for the 2020 tax year for zip code 16947, filed in 2021:
Average Adjusted Gross Income (AGI) in 2020: $58,879 (Individual Income Tax Returns)
Here:
$58,879
State:
$75,707
Salary/wage: $46,257 (reported on 73.8% of returns)
Here:
$46,257
State:
$62,806
(% of AGI for various income ranges: 1112.8% for AGIs below $25k, 3273.7% for AGIs $25k-50k, 5860.0% for AGIs $50k-75k, 9377.9% for AGIs $75k-100k, 12978.7% for AGIs $100k-200k)
Taxable interest for individuals: $1,170 (reported on 38.1% of returns)
This zip code:
$1,170
Pennsylvania:
$1,633
(% of AGI for various income ranges: 24.0% for AGIs below $25k, 20.5% for AGIs $25k-50k, 50.8% for AGIs $50k-75k, 73.6% for AGIs $75k-100k, 165.3% for AGIs $100k-200k)
Ordinary dividends: $6,556 (reported on 21.4% of returns)
Here:
$6,556
State:
$7,382
(% of AGI for various income ranges: 34.7% for AGIs below $25k, 39.8% for AGIs $25k-50k, 123.2% for AGIs $50k-75k, 197.1% for AGIs $75k-100k, 598.7% for AGIs $100k-200k)
Net capital gain/loss in AGI: +$10,969 (reported on 17.1% of returns)
Here:
+$10,969
State:
+$23,522
(% of AGI for various income ranges: 15.3% for AGIs below $25k, 27.3% for AGIs $25k-50k, 146.4% for AGIs $50k-75k, 187.1% for AGIs $75k-100k, 646.0% for AGIs $100k-200k)
Profit/loss from business: +$10,920 (reported on 11.9% of returns)
Here:
+$10,920
State:
+$16,274
(% of AGI for various income ranges: 114.4% for AGIs below $25k, 114.9% for AGIs $25k-50k, 62.8% for AGIs $50k-75k, 522.1% for AGIs $75k-100k, 586.0% for AGIs $100k-200k)
Taxable individual retirement arrangement distribution: $14,554 (reported on 13.3% of returns)
16947:
$14,554
Pennsylvania:
$18,583
(% of AGI for various income ranges: 101.4% for AGIs below $25k, 126.3% for AGIs $25k-50k, 256.4% for AGIs $50k-75k, 274.3% for AGIs $75k-100k, 1397.3% for AGIs $100k-200k)
Total itemized deductions: $34,225 (reported on 3.8% of returns)
Here:
$34,225
State:
$34,850
(% of AGI for various income ranges: 398.8% for AGIs $50k-75k, 1160.7% for AGIs $100k-200k)
Charity contributions: $20,120 (reported on 2.4% of returns)
Here:
$20,120
State:
$12,392
(% of AGI for various income ranges: 19.0% for AGIs $25k-50k, 618.7% for AGIs $100k-200k)
Taxes paid: $6,438 (reported on 3.8% of returns)
16947:
$6,438
State:
$8,200
(% of AGI for various income ranges: 69.6% for AGIs $50k-75k, 227.3% for AGIs $100k-200k)
Earned income credit: $2,177 (reported on 14.3% of returns)
Here:
$2,177
State:
$2,100
(% of AGI for various income ranges: 88.4% for AGIs below $25k, 66.6% for AGIs $25k-50k)
Percentage of individuals using paid preparers for their 2020 taxes: 95.7%
Here:
96%
State:
92%
(% for various income ranges: 92.9% for AGIs below $25k, 98.1% for AGIs $25k-50k, 97.1% for AGIs $50k-75k, 100.0% for AGIs $75k-100k, 96.0% for AGIs $100k-200k, 83.3% for AGIs over 200k)
Averages for the 2012 tax year for zip code 16947, filed in 2013:
Average Adjusted Gross Income (AGI) in 2012: $54,192 (Individual Income Tax Returns)
Here:
$54,192
State:
$61,346
Salary/wage: $37,555 (reported on 78.5% of returns)
Here:
$37,555
State:
$51,902
(% of AGI for various income ranges: 68.3% for AGIs below $25k, 76.3% for AGIs $25k-50k, 72.4% for AGIs $50k-75k, 66.7% for AGIs $75k-100k, 46.8% for AGIs $100k-200k, 17.4% for AGIs over 200k)
Taxable interest for individuals: $1,168 (reported on 38.8% of returns)
This zip code:
$1,168
Pennsylvania:
$1,588
(% of AGI for various income ranges: 2.2% for AGIs below $25k, 0.8% for AGIs $25k-50k, 0.7% for AGIs $50k-75k, 0.5% for AGIs $75k-100k, 0.6% for AGIs $100k-200k, 0.8% for AGIs over 200k)
Ordinary dividends: $4,037 (reported on 21.9% of returns)
Here:
$4,037
State:
$5,827
(% of AGI for various income ranges: 1.5% for AGIs below $25k, 1.8% for AGIs $25k-50k, 1.0% for AGIs $50k-75k, 0.9% for AGIs $75k-100k, 1.5% for AGIs $100k-200k, 2.7% for AGIs over 200k)
Net capital gain/loss in AGI: +$11,797 (reported on 15.5% of returns)
Here:
+$11,797
State:
+$14,495
(% of AGI for various income ranges: 1.9% for AGIs below $25k, 0.6% for AGIs $25k-50k, 0.2% for AGIs $50k-75k, 1.6% for AGIs $75k-100k, 2.0% for AGIs $100k-200k, 11.2% for AGIs over 200k)
Profit/loss from business: +$15,328 (reported on 14.6% of returns)
Here:
+$15,328
State:
+$16,268
(% of AGI for various income ranges: 5.0% for AGIs below $25k, 4.3% for AGIs $25k-50k, 3.4% for AGIs $50k-75k, 2.8% for AGIs $75k-100k, 9.2% for AGIs $100k-200k)
Taxable individual retirement arrangement distribution: $9,700 (reported on 13.2% of returns)
16947:
$9,700
Pennsylvania:
$14,550
(% of AGI for various income ranges: 4.8% for AGIs below $25k, 2.4% for AGIs $25k-50k, 1.8% for AGIs $50k-75k, 1.9% for AGIs $75k-100k, 4.5% for AGIs $100k-200k)
Total itemized deductions: $22,560 (18% of AGI, reported on 18.3% of returns)
Here:
$22,560
State:
$23,538
Here:
17.6% of AGI
State:
18.4% of AGI
(% of AGI for various income ranges: 5.0% for AGIs below $25k, 5.2% for AGIs $25k-50k, 5.5% for AGIs $50k-75k, 6.9% for AGIs $75k-100k, 8.7% for AGIs $100k-200k, 11.6% for AGIs over 200k)
Charity contributions: $7,538 (reported on 11.9% of returns)
Here:
$7,538
State:
$4,025
(% of AGI for various income ranges: 0.7% for AGIs $25k-50k, 0.8% for AGIs $50k-75k, 0.8% for AGIs $75k-100k, 1.8% for AGIs $100k-200k, 4.1% for AGIs over 200k)
Taxes paid: $8,505 (reported on 18.3% of returns)
16947:
$8,505
State:
$9,982
(% of AGI for various income ranges: 1.1% for AGIs below $25k, 1.4% for AGIs $25k-50k, 1.7% for AGIs $50k-75k, 2.4% for AGIs $75k-100k, 3.4% for AGIs $100k-200k, 5.4% for AGIs over 200k)
Earned income credit: $1,984 (reported on 14.2% of returns)
Here:
$1,984
State:
$2,106
(% of AGI for various income ranges: 4.5% for AGIs below $25k, 0.8% for AGIs $25k-50k)
Percentage of individuals using paid preparers for their 2012 taxes: 72.1%
Here:
72%
State:
53%
(% for various income ranges: 67.4% for AGIs below $25k, 66.0% for AGIs $25k-50k, 75.8% for AGIs $50k-75k, 85.0% for AGIs $75k-100k, 85.0% for AGIs $100k-200k, 85.7% for AGIs over 200k)
Averages for the 2004 tax year for zip code 16947, filed in 2005:
Average Adjusted Gross Income (AGI) in 2004: $34,860 (Individual Income Tax Returns)
Here:
$34,860
State:
$48,049
Salary/wage: $29,515 (reported on 81.2% of returns)
Here:
$29,515
State:
$42,646
(% of AGI for various income ranges: 167.7% for AGIs below $10k, 70.9% for AGIs $10k-25k, 77.0% for AGIs $25k-50k, 74.8% for AGIs $50k-75k, 70.2% for AGIs $75k-100k, 42.2% for AGIs over 100k)
Taxable interest for individuals: $1,322 (reported on 50.6% of returns)
This zip code:
$1,322
Pennsylvania:
$1,657
(% of AGI for various income ranges: 13.8% for AGIs below $10k, 3.0% for AGIs $10k-25k, 1.3% for AGIs $25k-50k, 1.6% for AGIs $50k-75k, 1.6% for AGIs $75k-100k, 1.6% for AGIs over 100k)
Taxable dividends: $3,255 (reported on 27.4% of returns)
Here:
$3,255
State:
$3,566
(% of AGI for various income ranges: 11.0% for AGIs below $10k, 3.1% for AGIs $10k-25k, 1.1% for AGIs $25k-50k, 1.2% for AGIs $50k-75k, 2.6% for AGIs $75k-100k, 4.7% for AGIs over 100k)
Net capital gain/loss: +$4,332 (reported on 21.4% of returns)
Here:
+$4,332
State:
+$9,716
(% of AGI for various income ranges: 18.3% for AGIs below $10k, 1.8% for AGIs $10k-25k, 1.7% for AGIs $25k-50k, 1.6% for AGIs $50k-75k, 2.2% for AGIs $75k-100k, 4.5% for AGIs over 100k)
Profit/loss from business: +$10,402 (reported on 17.9% of returns)
Here:
+$10,402
State:
+$14,267
(% of AGI for various income ranges: -1.0% for AGIs below $10k, 5.8% for AGIs $10k-25k, 5.7% for AGIs $25k-50k, 3.6% for AGIs $50k-75k, 6.4% for AGIs $75k-100k, 6.3% for AGIs over 100k)
IRA payment deduction: $2,854 (reported on 4.4% of returns)
16947:
$2,854
Pennsylvania:
$2,903
(% of AGI for various income ranges: 0.3% for AGIs $10k-25k, 0.7% for AGIs $25k-50k, 0.3% for AGIs $50k-75k, 0.5% for AGIs $75k-100k)
Total itemized deductions: $16,475 (20% of AGI, reported on 16.6% of returns)
Here:
$16,475
State:
$18,804
Here:
20.3% of AGI
State:
19.5% of AGI
(% of AGI for various income ranges: 5.4% for AGIs $10k-25k, 5.8% for AGIs $25k-50k, 8.6% for AGIs $50k-75k, 7.4% for AGIs $75k-100k, 12.1% for AGIs over 100k)
Charity contributions deductions: $3,039 (4% of AGI, reported on 12.8% of returns)
Here:
$3,039
State:
$3,337
Here:
3.9% of AGI
State:
3.3% of AGI
(% of AGI for various income ranges: 0.6% for AGIs $10k-25k, 1.1% for AGIs $25k-50k, 1.0% for AGIs $50k-75k, 1.0% for AGIs $75k-100k, 1.8% for AGIs over 100k)
Total tax: $4,910 (reported on 72.2% of returns)
16947:
$4,910
State:
$8,008
(% of AGI for various income ranges: 5.3% for AGIs below $10k, 4.1% for AGIs $10k-25k, 7.0% for AGIs $25k-50k, 8.8% for AGIs $50k-75k, 11.9% for AGIs $75k-100k, 18.8% for AGIs over 100k)
Earned income credit: $1,627 (reported on 18.2% of returns)
Here:
$1,627
State:
$1,643
Percentage of individuals using paid preparers for their 2004 taxes: 74.4%
Here:
74%
State:
56%
(% for various income ranges: 67.5% for AGIs below $10k, 75.1% for AGIs $10k-25k, 77.7% for AGIs $25k-50k, 76.2% for AGIs $50k-75k, 73.5% for AGIs $75k-100k, 83.3% for AGIs over 100k)
Household received Food Stamps/SNAP in the past 12 months: 269 Household did not receive Food Stamps/SNAP in the past 12 months: 1,471
Women who had a birth in the past 12 months: 37 (29 now married, 8 unmarried) Women who did not have a birth in the past 12 months: 891 (325 now married, 566 unmarried)
Housing units in zip code 16947 with a mortgage: 518 (34 second mortgage, 32 both second mortgage and home equity loan) Houses without a mortgage: 65
Median monthly owner costs for units with a mortgage: $1,188 Median monthly owner costs for units without a mortgage: $493
Residents with income below the poverty level in 2022:
This zip code:
18.5%
Whole state:
11.8%
Residents with income below 50% of the poverty level in 2022:
This zip code:
8.7%
Whole state:
6.1%
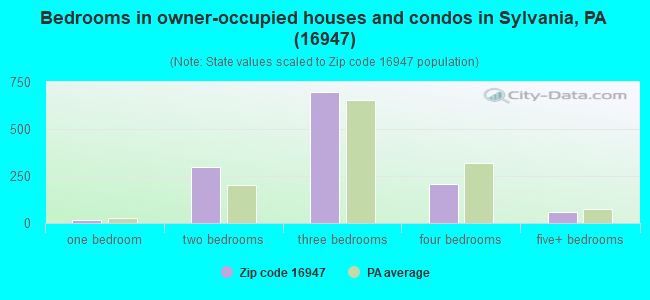
Median number of rooms in houses and condos:
Here:
6.6
State:
6.8
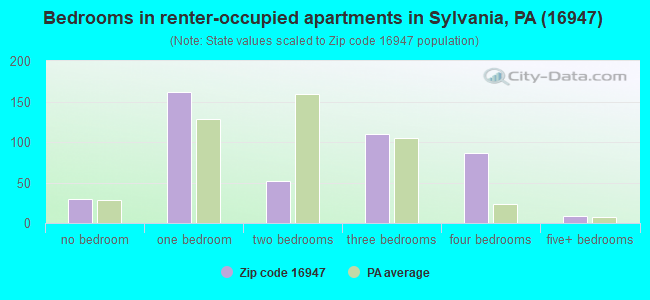
Median number of rooms in apartments:
Here:
4.3
State:
4.3
Notable locations in this zip code not listed on our city pages
Notable locations in zip code 16947: Lambs Hill Picnic Area (A), Bradford County Home (B), Oscoluwa Engine and Hose Company Station 1 (C), Oscoluwa Engine and Hose Company Station 2 (D). Display/hide their locations on the map
Cemeteries: Ballard Cemetery (1), Oak Hill Cemetery (2), Sylvania Cemetery (3), East Troy Cemetery (4), Hilton Cemetery (5), Glenwood Cemetery (6), Hunt Cemetery (7). Display/hide their locations on the map
Streams, rivers, and creeks: Spring Creek (A), West Branch Sugar Creek (B), North Branch Sugar Creek (C), Rundall Creek (D), Mud Creek (E), Morgan Creek (F), Mill Creek (G), Webier Creek (H), Fellows Creek (I). Display/hide their locations on the map
In group quarters: 467 (-1 institutionalized population)
Size of family households: 567 2-persons, 209 3-persons, 240 4-persons, 62 5-persons, 32 6-persons, 4 7-or-more-persons
Size of nonfamily households: 547 1-person, 63 2-persons, 7 3-persons
399 married couples with children.
312 single-parent households (173 men, 139 women).
94.9% of residents of 16947 zip code speak English at home.
4.8% of residents speak Spanish at home (26% very well, 23% well, 50% not well).
0.2% of residents speak other Indo-European language at home (73% very well, 27% well).
0.3% of residents speak Asian or Pacific Island language at home (67% very well, 33% well).
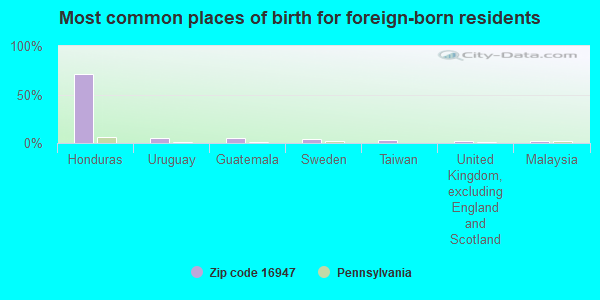
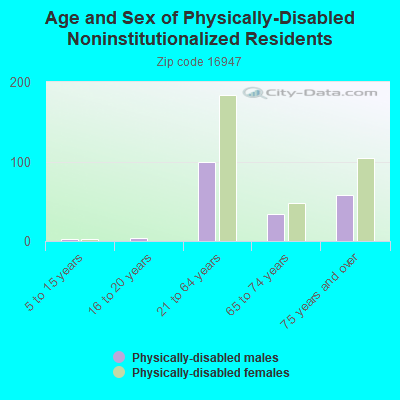
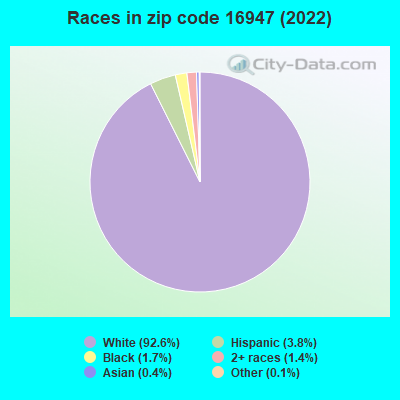
Foreign born population: 182 (4.0%) (91.1% of them are naturalized citizens)
This zip code:
4.0%
Whole state:
7.5%
72%Honduras
6%Uruguay
5%Guatemala
4%Sweden
3%Taiwan
2%United Kingdom, excluding England and Scotland
2%Malaysia
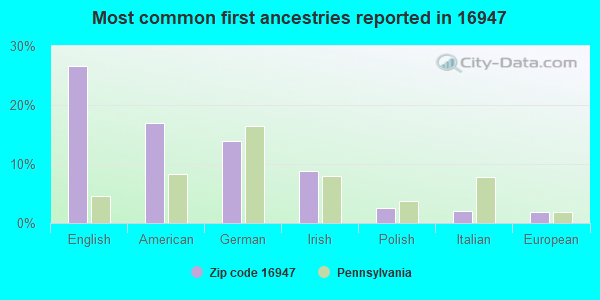
27%English
17%American
14%German
9%Irish
2%Polish
2%Italian
2%European
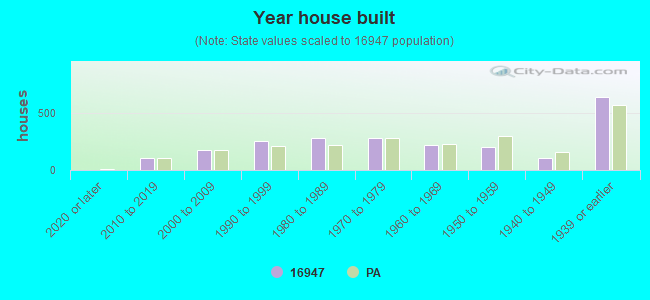
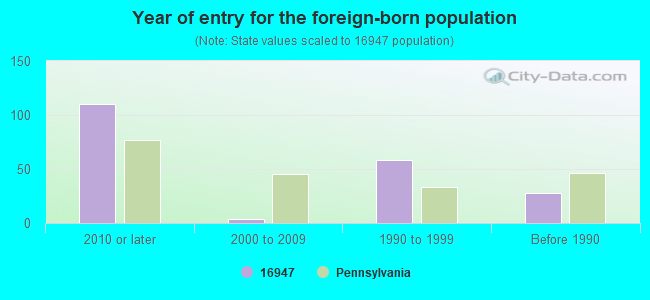
Year of entry for the foreign-born population
1102010 or later
42000 to 2009
581990 to 1999
28Before 1990
Facilities with environmental interests located in this zip code:
A S L INDUSTRIES INC (430 CANTON ST in TROY, PA)
(Resource Conservation and Recovery Act (tracking hazardous waste))
Housing units lacking complete plumbing facilities: 4.4% Housing units lacking complete kitchen facilities: 4.1%
60.3%Utility gas
14.1%Electricity
9.9%Wood
9.2%Fuel oil, kerosene, etc.
5.0%Bottled, tank, or LP gas
0.8%Coal or coke
0.6%No fuel used
Population in 1990: 3,476. Population change in the 1990s: +1,561 (+44.9%).
Place of birth for U.S.-born residents:
This state: 3,259
Northeast: 778
Midwest: 112
South: 206
West: 58
63% of the 16947 zip code residents lived in the same house 5 years ago. Out of people who lived in different houses, 71% lived in this county. Out of people who lived in different counties, 50% lived in Pennsylvania.
85% of the 16947 zip code residents lived in the same house 1 year ago. Out of people who lived in different houses, 59% moved from this county. Out of people who lived in different houses, 21% moved from different county within same state. Out of people who lived in different houses, 5% moved from different state. Out of people who lived in different houses, 13% moved from abroad.
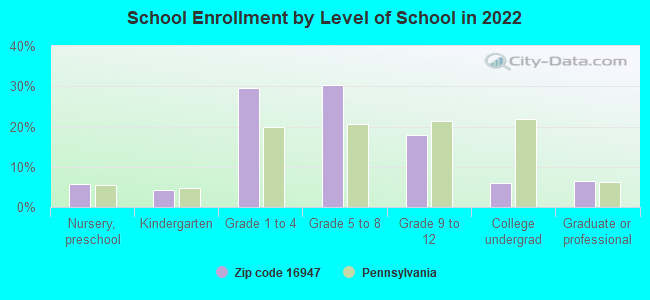
Private vs. public school enrollment:
Students in private schools in grades 1 to 8 (elementary and middle school): 3
Here:
0.7%
Pennsylvania:
15.7%
Students in private schools in grades 9 to 12 (high school): 3
Here:
3.1%
Pennsylvania:
13.4%
Students in private undergraduate colleges:
Here:
0.0%
Pennsylvania:
39.8%
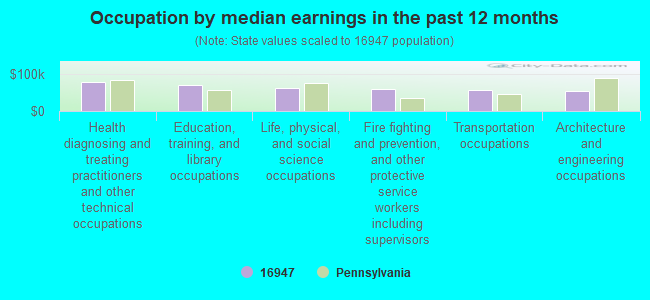
Occupation by median earnings in the past 12 months ($)
79,220Health diagnosing and treating practitioners and other technical occupations
71,089Education, training, and library occupations
62,739Life, physical, and social science occupations
60,021Fire fighting and prevention, and other protective service workers including supervisors
57,815Transportation occupations
55,326Architecture and engineering occupations
Companies with federal contracts located in this zip code:
R&D PRECISION TOOLING (RR 1 BOX 245 in TROY, PA; small business) : $39,802 in 2 contractsfrom 2002 to 2003
$35,802 with Army for Hardware, Commercial. Signed on 2002-03-14. Completion date: 2002-05-13.
$4,000 with Army for Nuts and Washers. Signed on 2003-01-07. Completion date: 2003-01-28.
Top industries in this zip code by the number of employees in 2005:
Health Care and Social Assistance: Residential Mental Retardation Facilities (100-249 employees: 1 establishment, 50-99 employees: 1 establishment, 20-49 employees: 2 establishments)
Health Care and Social Assistance: General Medical and Surgical Hospitals (100-249: 1)
Health Care and Social Assistance: Offices of Physicians (except Mental Health Specialists) (20-49: 1, 10-19: 1, 5-9: 2, 1-4: 1)
Accommodation and Food Services: Limited-Service Restaurants (10-19: 3)
People in group quarters in 2010:
159 people in nursing facilities/skilled-nursing facilities
86 people in local jails and other municipal confinement facilities
73 people in group homes intended for adults
People in group quarters in 2000:
206 people in nursing homes
160 people in homes for the mentally retarded
116 people in local jails and other confinement facilities (including police lockups)
13 people in wards in general hospitals for patients who have no usual home elsewhere
8 people in other nonhousehold living situations
Fatal accident statistics in 2014:
Fatal accident count: 3
Vehicles involved in fatal accidents: 5
Fatal accidents caused by drunken drivers: 1
Fatalities: 3
Persons involved in fatal accidents: 6
Pedestrians involved in fatal accidents: 3
Fatal accident statistics in 2013:
Fatal accident count: 1
Vehicles involved in fatal accidents: 2
Fatal accidents caused by drunken drivers: 0
Fatalities: 2
Persons involved in fatal accidents: 3
Pedestrians involved in fatal accidents: 0
Most common first names in zip code 16947 among deceased individuals
Name
Count
Lived (average)
Mary
57
80.7 years
John
49
76.7 years
William
46
80.6 years
Robert
44
73.0 years
James
38
76.8 years
George
36
80.1 years
Helen
36
84.9 years
Charles
30
75.5 years
Florence
29
82.8 years
Dorothy
29
80.2 years
Most common last names in zip code 16947 among deceased individuals
Last name
Count
Lived (average)
Brown
29
81.4 years
Smith
25
80.5 years
Dunbar
21
81.5 years
Case
20
77.5 years
Spencer
18
75.7 years
Rockwell
16
78.9 years
Wood
16
81.3 years
Ward
13
75.5 years
Thomas
13
79.9 years
Hulslander
13
67.8 years
Businesses in zip code 16947
Name
Count
Name
Count
Chevrolet
1
McDonald's
1
Curves
1
Subway
1
Decora Cabinetry
2
Tim Hortons
1
Domino's Pizza
1
True Value
1
FedEx
1
U-Haul
1
H&R Block
1
UPS
1
MasterBrand Cabinets
4
Discuss Sylvania, Pennsylvania (PA) on our hugely popular Pennsylvania forum.


 Nearest zip codes: 16914, 16926, 17724, 16932, 16925, 18814.