Estimated zip code population in 2022: 6,237 Zip code population in 2010: 7,488 Zip code population in 2000: 7,295
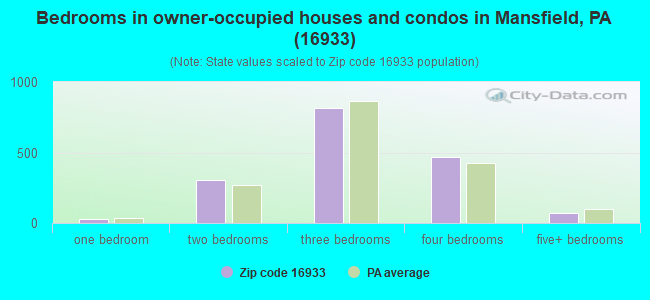
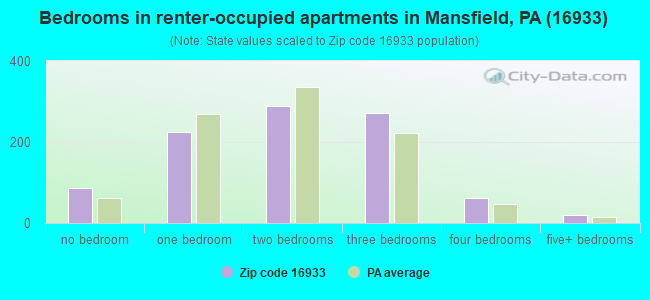
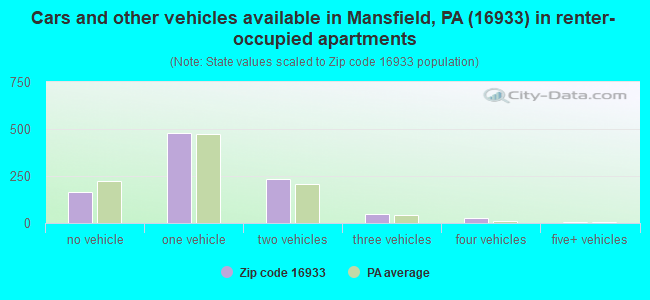
Houses and condos: 3,037 Renter-occupied apartments: 953
% of renters here:
36%
State:
31%
March 2022 cost of living index in zip code 16933: 86.6 (less than average, U.S. average is 100)
Land area: 97.5 sq. mi. Water area: 0.1 sq. mi.
Population density: 64 people per square mile
(very low).
OSM Map
General Map
Google Map
MSN Map
OSM Map
General Map
Google Map
MSN Map
OSM Map
General Map
Google Map
MSN Map
OSM Map
General Map
Google Map
MSN Map
Please wait while loading the map...
Real estate property taxes paid for housing units in 2022:
This zip code:
1.2% ($2,489)
Pennsylvania:
1.3% ($3,094)
Median real estate property taxes paid for housing units with mortgages in 2022: $2,659 (1.3%) Median real estate property taxes paid for housing units with no mortgage in 2022: $2,289 (1.1%)
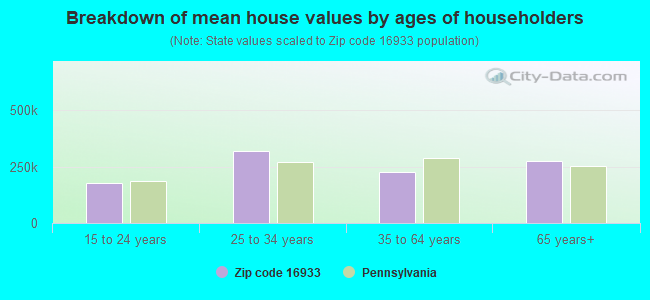
Estimated median house/condo value in 2022: $205,560
16933:
$205,560
Pennsylvania:
$245,500
According to our research of Pennsylvania and other state lists, there were 5 registered sex offenders living in 16933 zip code as of May 26, 2024. The ratio of all residents to sex offenders in zip code 16933 is 1,445 to 1. The ratio of registered sex offenders to all residents in this zip code is lower than the state average.
Median resident age:
This zip code:
38.7 years
Pennsylvania median age:
40.9 years
Average household size:
This zip code:
2.2 people
Pennsylvania:
2.4 people
Averages for the 2020 tax year for zip code 16933, filed in 2021:
Average Adjusted Gross Income (AGI) in 2020: $54,801 (Individual Income Tax Returns)
Here:
$54,801
State:
$75,707
Salary/wage: $45,031 (reported on 76.2% of returns)
Here:
$45,031
State:
$62,806
(% of AGI for various income ranges: 1081.2% for AGIs below $25k, 3111.7% for AGIs $25k-50k, 6061.7% for AGIs $50k-75k, 7779.5% for AGIs $75k-100k, 15447.2% for AGIs $100k-200k)
Taxable interest for individuals: $1,265 (reported on 38.1% of returns)
This zip code:
$1,265
Pennsylvania:
$1,633
(% of AGI for various income ranges: 24.0% for AGIs below $25k, 33.0% for AGIs $25k-50k, 68.3% for AGIs $50k-75k, 69.5% for AGIs $75k-100k, 205.0% for AGIs $100k-200k)
Ordinary dividends: $4,193 (reported on 22.0% of returns)
Here:
$4,193
State:
$7,382
(% of AGI for various income ranges: 29.0% for AGIs below $25k, 41.9% for AGIs $25k-50k, 124.0% for AGIs $50k-75k, 218.9% for AGIs $75k-100k, 342.2% for AGIs $100k-200k)
Net capital gain/loss in AGI: +$9,394 (reported on 17.2% of returns)
Here:
+$9,394
State:
+$23,522
(% of AGI for various income ranges: 17.2% for AGIs below $25k, 46.0% for AGIs $25k-50k, 77.0% for AGIs $50k-75k, 251.6% for AGIs $75k-100k, 928.3% for AGIs $100k-200k)
Profit/loss from business: +$14,832 (reported on 13.6% of returns)
Here:
+$14,832
State:
+$16,274
(% of AGI for various income ranges: 57.8% for AGIs below $25k, 118.9% for AGIs $25k-50k, 262.0% for AGIs $50k-75k, 205.3% for AGIs $75k-100k, 1093.9% for AGIs $100k-200k)
Taxable individual retirement arrangement distribution: $13,497 (reported on 11.0% of returns)
16933:
$13,497
Pennsylvania:
$18,583
(% of AGI for various income ranges: 54.0% for AGIs below $25k, 101.3% for AGIs $25k-50k, 264.3% for AGIs $50k-75k, 371.6% for AGIs $75k-100k, 917.2% for AGIs $100k-200k)
Total itemized deductions: $25,490 (reported on 3.7% of returns)
Here:
$25,490
State:
$34,850
(% of AGI for various income ranges: 445.0% for AGIs $50k-75k, 674.4% for AGIs $100k-200k)
Charity contributions: $11,043 (reported on 2.6% of returns)
Here:
$11,043
State:
$12,392
(% of AGI for various income ranges: 74.7% for AGIs $50k-75k, 305.0% for AGIs $100k-200k)
Taxes paid: $6,280 (reported on 3.7% of returns)
16933:
$6,280
State:
$8,200
(% of AGI for various income ranges: 90.7% for AGIs $50k-75k, 197.8% for AGIs $100k-200k)
Earned income credit: $1,940 (reported on 15.8% of returns)
Here:
$1,940
State:
$2,100
(% of AGI for various income ranges: 73.0% for AGIs below $25k, 65.1% for AGIs $25k-50k)
Percentage of individuals using paid preparers for their 2020 taxes: 94.9%
Here:
95%
State:
92%
(% for various income ranges: 93.7% for AGIs below $25k, 95.5% for AGIs $25k-50k, 97.7% for AGIs $50k-75k, 96.3% for AGIs $75k-100k, 93.9% for AGIs $100k-200k, 85.7% for AGIs over 200k)
Averages for the 2012 tax year for zip code 16933, filed in 2013:
Average Adjusted Gross Income (AGI) in 2012: $53,256 (Individual Income Tax Returns)
Here:
$53,256
State:
$61,346
Salary/wage: $39,238 (reported on 80.1% of returns)
Here:
$39,238
State:
$51,902
(% of AGI for various income ranges: 73.8% for AGIs below $25k, 73.4% for AGIs $25k-50k, 71.3% for AGIs $50k-75k, 65.5% for AGIs $75k-100k, 58.4% for AGIs $100k-200k, 20.1% for AGIs over 200k)
Taxable interest for individuals: $1,152 (reported on 40.8% of returns)
This zip code:
$1,152
Pennsylvania:
$1,588
(% of AGI for various income ranges: 1.3% for AGIs below $25k, 0.9% for AGIs $25k-50k, 0.9% for AGIs $50k-75k, 1.1% for AGIs $75k-100k, 0.8% for AGIs $100k-200k, 0.7% for AGIs over 200k)
Ordinary dividends: $3,031 (reported on 23.1% of returns)
Here:
$3,031
State:
$5,827
(% of AGI for various income ranges: 1.3% for AGIs below $25k, 0.9% for AGIs $25k-50k, 1.1% for AGIs $50k-75k, 1.3% for AGIs $75k-100k, 1.9% for AGIs $100k-200k, 1.0% for AGIs over 200k)
Net capital gain/loss in AGI: +$8,900 (reported on 14.1% of returns)
Here:
+$8,900
State:
+$14,495
(% of AGI for various income ranges: 0.9% for AGIs below $25k, 0.6% for AGIs $25k-50k, 0.9% for AGIs $50k-75k, 0.8% for AGIs $75k-100k, 2.2% for AGIs $100k-200k, 7.9% for AGIs over 200k)
Profit/loss from business: +$13,365 (reported on 15.5% of returns)
Here:
+$13,365
State:
+$16,268
(% of AGI for various income ranges: 5.6% for AGIs below $25k, 3.4% for AGIs $25k-50k, 3.0% for AGIs $50k-75k, 2.9% for AGIs $75k-100k, 7.6% for AGIs $100k-200k)
Taxable individual retirement arrangement distribution: $11,234 (reported on 10.5% of returns)
16933:
$11,234
Pennsylvania:
$14,550
(% of AGI for various income ranges: 2.3% for AGIs below $25k, 1.9% for AGIs $25k-50k, 2.0% for AGIs $50k-75k, 3.3% for AGIs $75k-100k, 3.2% for AGIs $100k-200k)
Total itemized deductions: $19,167 (18% of AGI, reported on 23.1% of returns)
Here:
$19,167
State:
$23,538
Here:
17.6% of AGI
State:
18.4% of AGI
(% of AGI for various income ranges: 7.0% for AGIs below $25k, 7.3% for AGIs $25k-50k, 7.4% for AGIs $50k-75k, 8.8% for AGIs $75k-100k, 9.8% for AGIs $100k-200k, 8.1% for AGIs over 200k)
Charity contributions: $4,100 (reported on 17.0% of returns)
Here:
$4,100
State:
$4,025
(% of AGI for various income ranges: 0.4% for AGIs below $25k, 0.8% for AGIs $25k-50k, 1.2% for AGIs $50k-75k, 1.2% for AGIs $75k-100k, 1.5% for AGIs $100k-200k, 2.0% for AGIs over 200k)
Taxes paid: $8,032 (reported on 22.7% of returns)
16933:
$8,032
State:
$9,982
(% of AGI for various income ranges: 1.3% for AGIs below $25k, 2.2% for AGIs $25k-50k, 2.4% for AGIs $50k-75k, 3.7% for AGIs $75k-100k, 4.7% for AGIs $100k-200k, 4.5% for AGIs over 200k)
Earned income credit: $1,975 (reported on 14.4% of returns)
Here:
$1,975
State:
$2,106
(% of AGI for various income ranges: 5.0% for AGIs below $25k, 0.7% for AGIs $25k-50k)
Percentage of individuals using paid preparers for their 2012 taxes: 67.5%
Here:
68%
State:
53%
(% for various income ranges: 61.1% for AGIs below $25k, 67.2% for AGIs $25k-50k, 72.1% for AGIs $50k-75k, 72.4% for AGIs $75k-100k, 78.6% for AGIs $100k-200k, 83.3% for AGIs over 200k)
Averages for the 2004 tax year for zip code 16933, filed in 2005:
Average Adjusted Gross Income (AGI) in 2004: $34,476 (Individual Income Tax Returns)
Here:
$34,476
State:
$48,049
Salary/wage: $29,841 (reported on 82.3% of returns)
Here:
$29,841
State:
$42,646
(% of AGI for various income ranges: 147.5% for AGIs below $10k, 77.1% for AGIs $10k-25k, 77.4% for AGIs $25k-50k, 74.0% for AGIs $50k-75k, 67.5% for AGIs $75k-100k, 52.7% for AGIs over 100k)
Taxable interest for individuals: $1,378 (reported on 50.7% of returns)
This zip code:
$1,378
Pennsylvania:
$1,657
(% of AGI for various income ranges: 8.3% for AGIs below $10k, 2.6% for AGIs $10k-25k, 1.5% for AGIs $25k-50k, 1.7% for AGIs $50k-75k, 1.3% for AGIs $75k-100k, 2.6% for AGIs over 100k)
Taxable dividends: $2,200 (reported on 27.0% of returns)
Here:
$2,200
State:
$3,566
(% of AGI for various income ranges: 5.5% for AGIs below $10k, 0.9% for AGIs $10k-25k, 1.0% for AGIs $25k-50k, 0.8% for AGIs $50k-75k, 2.0% for AGIs $75k-100k, 3.6% for AGIs over 100k)
Net capital gain/loss: +$5,898 (reported on 17.8% of returns)
Here:
+$5,898
State:
+$9,716
(% of AGI for various income ranges: 1.0% for AGIs below $10k, 1.1% for AGIs $10k-25k, 1.4% for AGIs $25k-50k, 1.8% for AGIs $50k-75k, 2.7% for AGIs $75k-100k, 8.0% for AGIs over 100k)
Profit/loss from business: +$8,869 (reported on 16.2% of returns)
Here:
+$8,869
State:
+$14,267
(% of AGI for various income ranges: 10.2% for AGIs below $10k, 6.0% for AGIs $10k-25k, 3.2% for AGIs $25k-50k, 4.2% for AGIs $50k-75k, 3.5% for AGIs $75k-100k, 4.2% for AGIs over 100k)
IRA payment deduction: $2,494 (reported on 3.1% of returns)
16933:
$2,494
Pennsylvania:
$2,903
(% of AGI for various income ranges: 0.4% for AGIs $10k-25k, 0.3% for AGIs $25k-50k, 0.2% for AGIs $50k-75k, 0.3% for AGIs $75k-100k)
Total itemized deductions: $14,769 (21% of AGI, reported on 23.4% of returns)
Here:
$14,769
State:
$18,804
Here:
20.9% of AGI
State:
19.5% of AGI
(% of AGI for various income ranges: 11.6% for AGIs below $10k, 6.0% for AGIs $10k-25k, 7.9% for AGIs $25k-50k, 12.6% for AGIs $50k-75k, 12.5% for AGIs $75k-100k, 10.3% for AGIs over 100k)
Charity contributions deductions: $2,583 (3% of AGI, reported on 19.1% of returns)
Here:
$2,583
State:
$3,337
Here:
3.3% of AGI
State:
3.3% of AGI
(% of AGI for various income ranges: 0.7% for AGIs $10k-25k, 1.0% for AGIs $25k-50k, 1.6% for AGIs $50k-75k, 1.9% for AGIs $75k-100k, 1.9% for AGIs over 100k)
Total tax: $4,899 (reported on 68.7% of returns)
16933:
$4,899
State:
$8,008
(% of AGI for various income ranges: 3.7% for AGIs below $10k, 4.0% for AGIs $10k-25k, 6.2% for AGIs $25k-50k, 8.8% for AGIs $50k-75k, 10.9% for AGIs $75k-100k, 18.1% for AGIs over 100k)
Earned income credit: $1,634 (reported on 17.7% of returns)
Here:
$1,634
State:
$1,643
Percentage of individuals using paid preparers for their 2004 taxes: 66.4%
Here:
66%
State:
56%
(% for various income ranges: 63.0% for AGIs below $10k, 66.6% for AGIs $10k-25k, 66.4% for AGIs $25k-50k, 72.1% for AGIs $50k-75k, 64.7% for AGIs $75k-100k, 71.3% for AGIs over 100k)
Likely homosexual households (counted as self-reported same-sex unmarried-partner households)
Lesbian couples: 0.5% of all households
Gay men: 0.2% of all households
Household received Food Stamps/SNAP in the past 12 months: 456 Household did not receive Food Stamps/SNAP in the past 12 months: 2,197
Women who had a birth in the past 12 months: 81 (48 now married, 31 unmarried) Women who did not have a birth in the past 12 months: 1,273 (447 now married, 827 unmarried)
Housing units in zip code 16933 with a mortgage: 759 (49 second mortgage, 42 both second mortgage and home equity loan) Houses without a mortgage: 234
Median monthly owner costs for units with a mortgage: $1,387 Median monthly owner costs for units without a mortgage: $520
Residents with income below the poverty level in 2022:
This zip code:
19.8%
Whole state:
11.8%
Residents with income below 50% of the poverty level in 2022:
This zip code:
11.5%
Whole state:
6.1%
Median number of rooms in houses and condos:
Here:
6.9
State:
6.8
Median number of rooms in apartments:
Here:
4.6
State:
4.3
Notable locations in this zip code not listed on our city pages
Notable locations in zip code 16933: Corey Creek Golf Course (A), Canoe Camp (B), Mansfield Hose Company (C), Alumni Hall Student Center (D), Beecher House (E), Belknap Hall (F), Cedarcrest Manor (G), Decker Gymnasium (H), Grace Steadman Theatre (I), Grant Science Center (J), Hemlock Manor (K), Manser Dining Hall (L), North Hall Library (M), Pinecrest Manor (N), Retam Center (O), Rod Kelchner Fitness Center (P), The Hut (Q), Will George Bulter Music Center (R), William R Straughn Hall (S). Display/hide their locations on the map
Cemeteries: Van Ness Hill Cemetery (1), Tower Hill Cemetery (2), Bullock Cemetery (3), Oakwood Cemetery (4), Ripley Cemetery (5), Pumpkin Hill Cemetery (6), Elk Run Cemetery (7). Display/hide their locations on the map
Streams, rivers, and creeks: Hibbards Run (A), Mill Creek (B), Ellen Run (C), Manns Creek (D), Slate Creek (E), Corey Creek (F), Canoe Camp Creek (G), Lambs Creek (H), Kelly Creek (I). Display/hide their locations on the map
Parks in zip code 16933 include: Russell Practice Football Field (1), Robert T Maxson Track (2), Myers Soccer Field (3), Karl Van Norman Football Field (4), Hills Creek State Park (5). Display/hide their locations on the map
560 married couples with children.
371 single-parent households (96 men, 275 women).
97.5% of residents of 16933 zip code speak English at home.
1.0% of residents speak Spanish at home (60% very well, 40% well).
0.7% of residents speak other Indo-European language at home (100% very well).
0.4% of residents speak Asian or Pacific Island language at home (81% very well, 19% well).
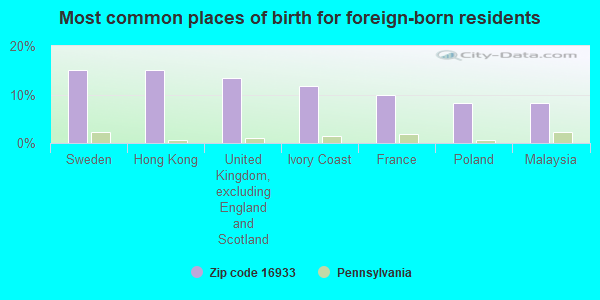
Foreign born population: 60 (1.0%) (64.7% of them are naturalized citizens)
This zip code:
1.0%
Whole state:
7.5%
15%Sweden
15%Hong Kong
13%United Kingdom, excluding England and Scotland
12%Ivory Coast
10%France
8%Poland
8%Malaysia
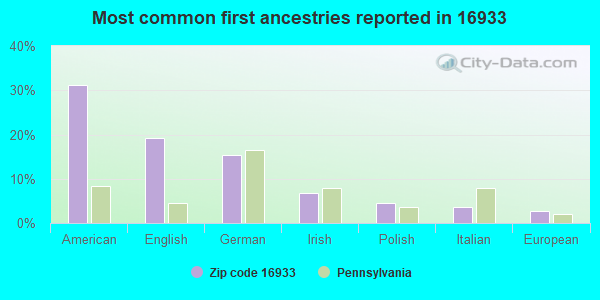
31%American
19%English
15%German
7%Irish
4%Polish
4%Italian
3%European
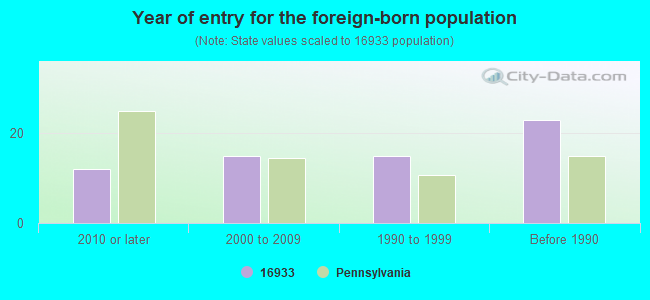
Year of entry for the foreign-born population
122010 or later
152000 to 2009
151990 to 1999
23Before 1990
Housing units lacking complete plumbing facilities: 2.0% Housing units lacking complete kitchen facilities: 2.3%
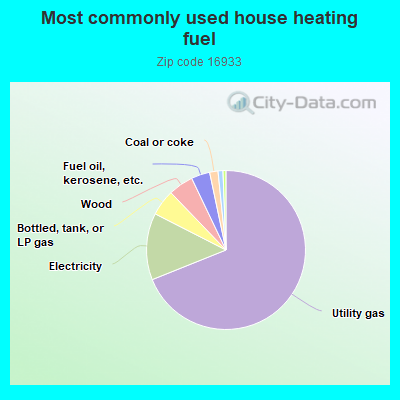
69.0%Utility gas
13.6%Electricity
5.3%Bottled, tank, or LP gas
5.1%Wood
3.8%Fuel oil, kerosene, etc.
1.7%Coal or coke
1.0%Other fuel
0.6%No fuel used
Population in 1990: 7,111. Population change in the 1990s: +184 (+2.6%).
Place of birth for U.S.-born residents:
This state: 4,411
Northeast: 1,242
Midwest: 145
South: 261
West: 108
51% of the 16933 zip code residents lived in the same house 5 years ago. Out of people who lived in different houses, 45% lived in this county. Out of people who lived in different counties, 50% lived in Pennsylvania.
92% of the 16933 zip code residents lived in the same house 1 year ago. Out of people who lived in different houses, 47% moved from this county. Out of people who lived in different houses, 33% moved from different county within same state. Out of people who lived in different houses, 18% moved from different state. Out of people who lived in different houses, 1% moved from abroad.
Private vs. public school enrollment:
Students in private schools in grades 1 to 8 (elementary and middle school): 22
Here:
5.8%
Pennsylvania:
15.7%
Students in private schools in grades 9 to 12 (high school): 28
Here:
9.7%
Pennsylvania:
13.4%
Students in private undergraduate colleges: 30
Here:
5.4%
Pennsylvania:
39.8%
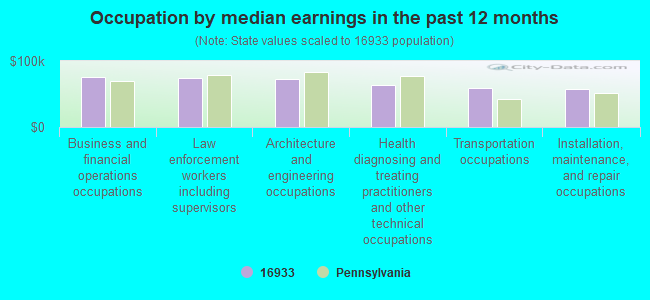
Occupation by median earnings in the past 12 months ($)
76,484Business and financial operations occupations
74,348Law enforcement workers including supervisors
72,467Architecture and engineering occupations
63,230Health diagnosing and treating practitioners and other technical occupations
58,341Transportation occupations
58,203Installation, maintenance, and repair occupations
Companies with federal contracts located in this zip code:
CLEANING BUSINESS (RR2 BOX 2169 in MANSFIELD, PA; small business) : $74,247 in 4 contractsfrom 2004 to 2005
$27,564 with Army for Custodial Janitorial Services. Signed on 2005-04-13. Completion date: 2005-09-30.
$27,564 with U.S. Army Corps of Engineers - civil program financing only for Custodial Janitorial Services. Signed on 2005-04-13. Completion date: 2005-09-30.
$21,170 with Army for Custodial Janitorial Services. Signed on 2004-03-16. Completion date: 2004-09-30.
-$2,051, same as above.Signed on 2005-10-17. Completion date: 2005-10-17.
MAPLE MOUNTAIN EQUIPMENT (5028 N ELK RUN RD in MANSFIELD, PA; small business) : $11,438 in 2 contractsin 2004
$11,100 with Army for Tractors, Full Tracked, Low Speed. Signed on 2004-01-22. Completion date: 2004-03-24.
$338, same as above.Signed on 2004-05-28. Completion date: 2004-03-24.
KINGDOM, INC (719 LAMBS CREEK ROAD in MANSFIELD, PA; small business)
$3,965 with Air Force for Video Recording and Reproducing Equipment. Signed on 2005-05-03. Completion date: 2005-06-07.
Top industries in this zip code by the number of employees in 2005:
Health Care and Social Assistance: Vocational Rehabilitation Services (100-249 employees: 1 establishment)


 Nearest zip codes: 16917, 16946, 16932, 16912, 16939, 16929.
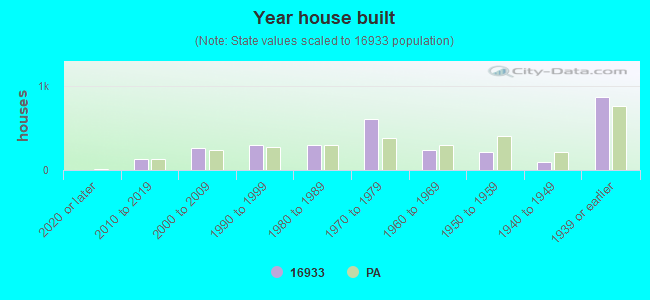


 : $74,247 in 4 contracts from 2004 to 2005