Estimated zip code population in 2022: 4,717 Zip code population in 2010: 3,991 Zip code population in 2000: 4,055
Houses and condos: 2,206 Renter-occupied apartments: 329
% of renters here:
17%
State:
31%
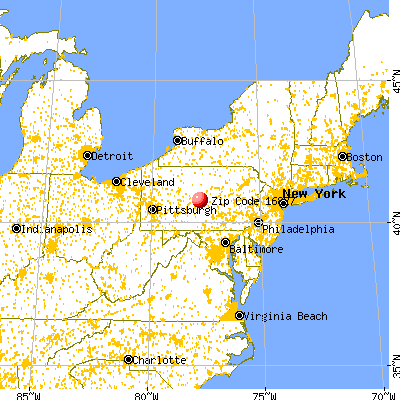
March 2022 cost of living index in zip code 16827: 98.3 (near average, U.S. average is 100)
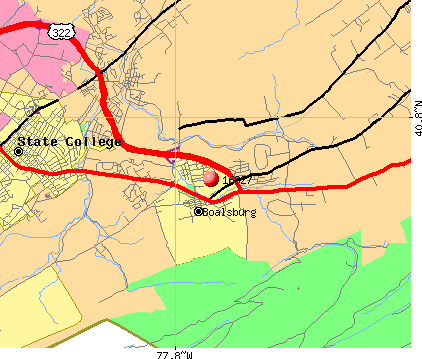
Land area: 17.5 sq. mi. Water area: 0.0 sq. mi.
Population density: 269 people per square mile
(very low).
OSM Map
General Map
Google Map
MSN Map
OSM Map
General Map
Google Map
MSN Map
OSM Map
General Map
Google Map
MSN Map
OSM Map
General Map
Google Map
MSN Map
Please wait while loading the map...
Real estate property taxes paid for housing units in 2022:
This zip code:
1.1% ($4,663)
Pennsylvania:
1.3% ($3,094)
Median real estate property taxes paid for housing units with mortgages in 2022: $4,101 (1.0%) Median real estate property taxes paid for housing units with no mortgage in 2022: $5,509 (1.1%)
Business Search- 14 Million verified businesses
Males: 2,304
(48.8%)
Females: 2,413
(51.2%)
For population 25 years and over in 16827:
High school or higher: 101.7%
Bachelor's degree or higher: 70.2%
Graduate or professional degree: 28.8%
Unemployed: 3.0%
Mean travel time to work (commute): 17.2 minutes
For population 15 years and over in 16827:
Never married: 21.2%
Now married: 64.4%
Separated: 0.4%
Widowed: 9.2%
Divorced: 4.8%
Zip code 16827 compared to state average:
Median household income above state average.
Median house value above state average.
Black race population percentage significantly below state average.
Hispanic race population percentage below state average.
Median age above state average.
Renting percentage below state average.
Length of stay since moving in significantly below state average.
House age significantly below state average.
Percentage of population with a bachelor's degree or higher above state average.
Estimated median house/condo value in 2022: $431,633
16827:
$431,633
Pennsylvania:
$245,500
Median resident age:
This zip code:
45.2 years
Pennsylvania median age:
40.9 years
Average household size:
This zip code:
2.4 people
Pennsylvania:
2.4 people
Averages for the 2020 tax year for zip code 16827, filed in 2021:
Average Adjusted Gross Income (AGI) in 2020: $111,294 (Individual Income Tax Returns)
Here:
$111,294
State:
$75,707
Salary/wage: $80,913 (reported on 75.4% of returns)
Here:
$80,913
State:
$62,806
(% of AGI for various income ranges: 1126.0% for AGIs below $25k, 3190.0% for AGIs $25k-50k, 5530.4% for AGIs $50k-75k, 7389.5% for AGIs $75k-100k, 15292.7% for AGIs $100k-200k, 79035.6% for AGIs over 200k)
Taxable interest for individuals: $2,111 (reported on 46.7% of returns)
This zip code:
$2,111
Pennsylvania:
$1,633
(% of AGI for various income ranges: 24.0% for AGIs below $25k, 35.1% for AGIs $25k-50k, 72.0% for AGIs $50k-75k, 92.5% for AGIs $75k-100k, 193.6% for AGIs $100k-200k, 1620.0% for AGIs over 200k)
Ordinary dividends: $7,944 (reported on 39.3% of returns)
Here:
$7,944
State:
$7,382
(% of AGI for various income ranges: 57.8% for AGIs below $25k, 78.9% for AGIs $25k-50k, 197.2% for AGIs $50k-75k, 391.0% for AGIs $75k-100k, 586.4% for AGIs $100k-200k, 5314.4% for AGIs over 200k)
Net capital gain/loss in AGI: +$28,685 (reported on 34.2% of returns)
Here:
+$28,685
State:
+$23,522
(% of AGI for various income ranges: 25.0% for AGIs below $25k, 41.1% for AGIs $25k-50k, 178.0% for AGIs $50k-75k, 353.5% for AGIs $75k-100k, 961.8% for AGIs $100k-200k, 24563.3% for AGIs over 200k)
Profit/loss from business: +$22,083 (reported on 19.9% of returns)
Here:
+$22,083
State:
+$16,274
(% of AGI for various income ranges: 158.5% for AGIs below $25k, 276.9% for AGIs $25k-50k, 326.8% for AGIs $50k-75k, 385.5% for AGIs $75k-100k, 762.4% for AGIs $100k-200k, 6908.9% for AGIs over 200k)
Taxable individual retirement arrangement distribution: $24,566 (reported on 17.3% of returns)
16827:
$24,566
Pennsylvania:
$18,583
(% of AGI for various income ranges: 76.8% for AGIs below $25k, 222.9% for AGIs $25k-50k, 390.4% for AGIs $50k-75k, 759.5% for AGIs $75k-100k, 1380.6% for AGIs $100k-200k, 3786.7% for AGIs over 200k)
Self-employed (Keogh) retirement plans: $22,950 (reported on 1.5% of returns)
16827:
$22,950
Pennsylvania:
$25,407
(% of AGI for various income ranges: 1020.0% for AGIs over 200k)
Total itemized deductions: $35,671 (reported on 14.0% of returns)
Here:
$35,671
State:
$34,850
(% of AGI for various income ranges: 277.1% for AGIs $25k-50k, 435.6% for AGIs $50k-75k, 609.5% for AGIs $75k-100k, 1134.2% for AGIs $100k-200k, 7260.0% for AGIs over 200k)
Charity contributions: $12,810 (reported on 11.4% of returns)
Here:
$12,810
State:
$12,392
(% of AGI for various income ranges: 14.8% for AGIs below $25k, 47.6% for AGIs $50k-75k, 107.5% for AGIs $75k-100k, 321.5% for AGIs $100k-200k, 2796.7% for AGIs over 200k)
Taxes paid: $8,424 (reported on 14.0% of returns)
16827:
$8,424
State:
$8,200
(% of AGI for various income ranges: 38.6% for AGIs $25k-50k, 109.2% for AGIs $50k-75k, 174.0% for AGIs $75k-100k, 330.0% for AGIs $100k-200k, 1506.7% for AGIs over 200k)
Earned income credit: $2,135 (reported on 8.5% of returns)
Here:
$2,135
State:
$2,100
(% of AGI for various income ranges: 78.5% for AGIs below $25k, 50.6% for AGIs $25k-50k)
Percentage of individuals using paid preparers for their 2020 taxes: 91.9%
Here:
92%
State:
92%
(% for various income ranges: 87.9% for AGIs below $25k, 91.5% for AGIs $25k-50k, 94.6% for AGIs $50k-75k, 93.3% for AGIs $75k-100k, 91.8% for AGIs $100k-200k, 96.8% for AGIs over 200k)
Averages for the 2012 tax year for zip code 16827, filed in 2013:
Average Adjusted Gross Income (AGI) in 2012: $87,417 (Individual Income Tax Returns)
Here:
$87,417
State:
$61,346
Salary/wage: $63,022 (reported on 80.2% of returns)
Here:
$63,022
State:
$51,902
(% of AGI for various income ranges: 73.6% for AGIs below $25k, 73.1% for AGIs $25k-50k, 66.2% for AGIs $50k-75k, 61.7% for AGIs $75k-100k, 61.8% for AGIs $100k-200k, 47.8% for AGIs over 200k)
Taxable interest for individuals: $1,687 (reported on 48.3% of returns)
This zip code:
$1,687
Pennsylvania:
$1,588
(% of AGI for various income ranges: 1.2% for AGIs below $25k, 1.0% for AGIs $25k-50k, 0.7% for AGIs $50k-75k, 0.9% for AGIs $75k-100k, 0.9% for AGIs $100k-200k, 1.0% for AGIs over 200k)
Ordinary dividends: $9,822 (reported on 37.5% of returns)
Here:
$9,822
State:
$5,827
(% of AGI for various income ranges: 3.5% for AGIs below $25k, 2.3% for AGIs $25k-50k, 2.4% for AGIs $50k-75k, 2.2% for AGIs $75k-100k, 2.3% for AGIs $100k-200k, 6.9% for AGIs over 200k)
Net capital gain/loss in AGI: +$10,017 (reported on 28.4% of returns)
Here:
+$10,017
State:
+$14,495
(% of AGI for various income ranges: 0.4% for AGIs $25k-50k, 1.3% for AGIs $50k-75k, 0.9% for AGIs $75k-100k, 1.6% for AGIs $100k-200k, 6.3% for AGIs over 200k)
Profit/loss from business: +$25,262 (reported on 20.7% of returns)
Here:
+$25,262
State:
+$16,268
(% of AGI for various income ranges: 6.0% for AGIs below $25k, 5.4% for AGIs $25k-50k, 3.0% for AGIs $50k-75k, 2.3% for AGIs $75k-100k, 6.0% for AGIs $100k-200k, 7.6% for AGIs over 200k)
Taxable individual retirement arrangement distribution: $18,363 (reported on 16.4% of returns)
16827:
$18,363
Pennsylvania:
$14,550
(% of AGI for various income ranges: 3.7% for AGIs below $25k, 3.0% for AGIs $25k-50k, 3.6% for AGIs $50k-75k, 6.4% for AGIs $75k-100k, 4.0% for AGIs $100k-200k, 2.4% for AGIs over 200k)
Self-employment retirement plans: $12,580 (reported on 2.2% of returns)
16827:
$12,580
Pennsylvania:
$20,922
(% of AGI for various income ranges: 1.4% for AGIs $75k-100k, 0.4% for AGIs over 200k)
Total itemized deductions: $27,331 (17% of AGI, reported on 40.9% of returns)
Here:
$27,331
State:
$23,538
Here:
16.7% of AGI
State:
18.4% of AGI
(% of AGI for various income ranges: 10.4% for AGIs below $25k, 10.4% for AGIs $25k-50k, 12.9% for AGIs $50k-75k, 13.8% for AGIs $75k-100k, 14.2% for AGIs $100k-200k, 12.2% for AGIs over 200k)
Charity contributions: $6,114 (reported on 35.8% of returns)
Here:
$6,114
State:
$4,025
(% of AGI for various income ranges: 0.7% for AGIs below $25k, 1.0% for AGIs $25k-50k, 1.5% for AGIs $50k-75k, 2.4% for AGIs $75k-100k, 2.6% for AGIs $100k-200k, 3.2% for AGIs over 200k)
Taxes paid: $12,047 (reported on 40.9% of returns)
16827:
$12,047
State:
$9,982
(% of AGI for various income ranges: 2.9% for AGIs below $25k, 3.0% for AGIs $25k-50k, 4.5% for AGIs $50k-75k, 4.9% for AGIs $75k-100k, 6.5% for AGIs $100k-200k, 6.3% for AGIs over 200k)
Earned income credit: $2,040 (reported on 10.8% of returns)
Here:
$2,040
State:
$2,106
(% of AGI for various income ranges: 4.3% for AGIs below $25k, 0.9% for AGIs $25k-50k)
Percentage of individuals using paid preparers for their 2012 taxes: 50.4%
Here:
50%
State:
53%
(% for various income ranges: 40.5% for AGIs below $25k, 42.9% for AGIs $25k-50k, 51.6% for AGIs $50k-75k, 54.5% for AGIs $75k-100k, 61.0% for AGIs $100k-200k, 82.4% for AGIs over 200k)
Averages for the 2004 tax year for zip code 16827, filed in 2005:
Average Adjusted Gross Income (AGI) in 2004: $63,400 (Individual Income Tax Returns)
Here:
$63,400
State:
$48,049
Salary/wage: $51,550 (reported on 82.7% of returns)
Here:
$51,550
State:
$42,646
(% of AGI for various income ranges: 108.7% for AGIs below $10k, 71.9% for AGIs $10k-25k, 74.7% for AGIs $25k-50k, 74.0% for AGIs $50k-75k, 74.5% for AGIs $75k-100k, 61.7% for AGIs over 100k)
Taxable interest for individuals: $1,908 (reported on 60.4% of returns)
This zip code:
$1,908
Pennsylvania:
$1,657
(% of AGI for various income ranges: 6.0% for AGIs below $10k, 1.9% for AGIs $10k-25k, 1.4% for AGIs $25k-50k, 1.2% for AGIs $50k-75k, 1.0% for AGIs $75k-100k, 2.1% for AGIs over 100k)
Taxable dividends: $4,232 (reported on 39.3% of returns)
Here:
$4,232
State:
$3,566
(% of AGI for various income ranges: 4.2% for AGIs below $10k, 1.4% for AGIs $10k-25k, 2.1% for AGIs $25k-50k, 1.5% for AGIs $50k-75k, 1.5% for AGIs $75k-100k, 3.3% for AGIs over 100k)
Net capital gain/loss: +$6,153 (reported on 31.5% of returns)
Here:
+$6,153
State:
+$9,716
(% of AGI for various income ranges: -0.8% for AGIs below $10k, -0.1% for AGIs $10k-25k, 1.1% for AGIs $25k-50k, 1.1% for AGIs $50k-75k, 1.0% for AGIs $75k-100k, 4.6% for AGIs over 100k)
Profit/loss from business: +$23,477 (reported on 21.9% of returns)
Here:
+$23,477
State:
+$14,267
(% of AGI for various income ranges: 7.2% for AGIs below $10k, 7.0% for AGIs $10k-25k, 6.5% for AGIs $25k-50k, 3.9% for AGIs $50k-75k, 4.0% for AGIs $75k-100k, 10.3% for AGIs over 100k)
IRA payment deduction: $3,306 (reported on 3.0% of returns)
16827:
$3,306
Pennsylvania:
$2,903
Self-employed pension: $12,547 (reported on 2.5% of returns)
Here:
$12,547
Pennsylvania:
$14,674
Total itemized deductions: $22,272 (19% of AGI, reported on 40.4% of returns)
Here:
$22,272
State:
$18,804
Here:
18.6% of AGI
State:
19.5% of AGI
(% of AGI for various income ranges: 8.8% for AGIs below $10k, 7.7% for AGIs $10k-25k, 14.1% for AGIs $25k-50k, 14.1% for AGIs $50k-75k, 16.9% for AGIs $75k-100k, 14.2% for AGIs over 100k)
Charity contributions deductions: $4,133 (3% of AGI, reported on 36.2% of returns)
Here:
$4,133
State:
$3,337
Here:
3.2% of AGI
State:
3.3% of AGI
(% of AGI for various income ranges: 0.7% for AGIs $10k-25k, 1.7% for AGIs $25k-50k, 1.3% for AGIs $50k-75k, 1.8% for AGIs $75k-100k, 3.0% for AGIs over 100k)
Total tax: $12,651 (reported on 76.2% of returns)
16827:
$12,651
State:
$8,008
(% of AGI for various income ranges: 2.8% for AGIs below $10k, 4.5% for AGIs $10k-25k, 7.7% for AGIs $25k-50k, 9.1% for AGIs $50k-75k, 10.2% for AGIs $75k-100k, 20.1% for AGIs over 100k)
Earned income credit: $2,024 (reported on 9.9% of returns)
Here:
$2,024
State:
$1,643
Percentage of individuals using paid preparers for their 2004 taxes: 50.2%
Here:
50%
State:
56%
(% for various income ranges: 38.7% for AGIs below $10k, 48.5% for AGIs $10k-25k, 52.0% for AGIs $25k-50k, 53.8% for AGIs $50k-75k, 51.3% for AGIs $75k-100k, 63.1% for AGIs over 100k)
Likely homosexual households (counted as self-reported same-sex unmarried-partner households)
Lesbian couples: 0.9% of all households
Gay men: 0.8% of all households
Household received Food Stamps/SNAP in the past 12 months: 104 Household did not receive Food Stamps/SNAP in the past 12 months: 1,854
Women who had a birth in the past 12 months: 130 (139 now married, 0 unmarried) Women who did not have a birth in the past 12 months: 929 (511 now married, 412 unmarried)
Housing units in zip code 16827 with a mortgage: 991 (221 second mortgage, 205 both second mortgage and home equity loan) Houses without a mortgage: 8
Median monthly owner costs for units with a mortgage: $2,013 Median monthly owner costs for units without a mortgage: $959
Residents with income below the poverty level in 2022:
This zip code:
2.5%
Whole state:
11.8%
Residents with income below 50% of the poverty level in 2022:
This zip code:
1.4%
Whole state:
6.1%
Median number of rooms in houses and condos:
Here:
7.3
State:
6.8
Median number of rooms in apartments:
Here:
4.5
State:
4.3
Notable locations in this zip code not listed on our city pages
Size of family households: 812 2-persons, 251 3-persons, 155 4-persons, 180 5-persons, 22 6-persons
Size of nonfamily households: 432 1-person, 109 2-persons, 7 3-persons
779 married couples with children.
27 single-parent households (27 women).
93.3% of residents of 16827 zip code speak English at home.
2.2% of residents speak Spanish at home (65% very well, 15% well, 20% not well).
1.0% of residents speak other Indo-European language at home (100% very well).
3.3% of residents speak other language at home (100% very well).
Foreign born population: 268 (5.7%) (32.7% of them are naturalized citizens)
This zip code:
5.7%
Whole state:
7.5%
29%Czechoslovakia (includes Czech Republic and Slovakia)
14%Honduras
11%Serbia
10%Denmark
7%Japan
3%El Salvador
3%West Indies
16%American
13%Irish
10%English
9%German
9%Polish
7%Hungarian
7%European
Year of entry for the foreign-born population
932010 or later
1642000 to 2009
201990 to 1999
72Before 1990
Facilities with environmental interests located in this zip code:
AUTO ACCESS OF AMER (RT 322 6 MI E OF BOALSBURG in BOALSBURG, PA)
STATE MASTER (Pennsylvania database) - RCRIS-PAR000004465, HAZARDOUS WASTE PROGRAM Conditionally Exempt Small Quantity Generators, less than 100 kg/month of hazardous waste (Resource Conservation and Recovery Act (tracking hazardous waste)) - notification Business SIC classification: MOTOR VEHICLE PARTS AND ACCESSORIES Organizations: LEKANDER DANIEL & PEGGY (CONTACT/OWNER)
Alternative names: AUTO ACCESSORIES OF AMERICA
Housing units lacking complete plumbing facilities: 0.6% Housing units lacking complete kitchen facilities: 0.7%
55.4%Electricity
19.4%Utility gas
18.1%Fuel oil, kerosene, etc.
3.5%Bottled, tank, or LP gas
1.8%Other fuel
1.3%Wood
0.5%Coal or coke
Population in 1990: 3,787. Population change in the 1990s: +268 (+7.1%).
Place of birth for U.S.-born residents:
This state: 2,843
Northeast: 254
Midwest: 352
South: 681
West: 253
65% of the 16827 zip code residents lived in the same house 5 years ago. Out of people who lived in different houses, 59% lived in this county. Out of people who lived in different counties, 50% lived in Pennsylvania.
94% of the 16827 zip code residents lived in the same house 1 year ago. Out of people who lived in different houses, 55% moved from this county. Out of people who lived in different houses, 48% moved from different state.
Private vs. public school enrollment:
Students in private schools in grades 1 to 8 (elementary and middle school):
Here:
0.0%
Pennsylvania:
15.7%
Students in private schools in grades 9 to 12 (high school): 69
Here:
54.2%
Pennsylvania:
13.4%
Students in private undergraduate colleges: 142
Here:
58.9%
Pennsylvania:
39.8%
Occupation by median earnings in the past 12 months ($)
132,944Architecture and engineering occupations
113,702Health diagnosing and treating practitioners and other technical occupations
109,639Computer and mathematical occupations
74,143Management occupations
57,317Personal care and service occupations
54,896Sales and related occupations
Companies with federal contracts located in this zip code:
CEDER COMPUTER SYSTEMS AMERICA (129 HARRIS AVE in BOALSBURG, PA; small business) 3 employees, $360000 revenue. Woman Owned Business: $176,000 in 3 contractsin 2000
$80,000 with Nuclear Regulatory Commission for Psychological Sciences -- Applied Research and Exploratory Development (R&D). Taking place in MD. Signed on 2000-11-15. Completion date: 2001-04-15.
$66,000 with Nuclear Regulatory Commission for Nuclear -- Applied Research and Exploratory Development (R&D). Taking place in MD. Signed on 2000-03-15. Completion date: 2000-10-15.
$30,000 with Nuclear Regulatory Commission for Psychological Sciences -- Applied Research and Exploratory Development (R&D). Taking place in MD. Signed on 2000-11-15. Completion date: 2001-04-15.
LYNDA L MUSSI (121 W MAIN ST in BOALSBURG, PA; small business) : $11,430 in 2 contractsin 2005
$7,342 with Army for Food Services. Signed on 2005-02-11. Completion date: 2005-02-12.
$4,088, same as above.Signed on 2005-03-03. Completion date: 2005-02-12.
ALPHA TWO (110 ASPEN DR in BOALSBURG, PA)
$5,184 with Army for Technical Assistance. Signed on 2004-06-29. Completion date: 2005-01-11.
Top industries in this zip code by the number of employees in 2005:
Real Estate and Rental and Leasing: Lessors of Residential Buildings and Dwellings (50-99 employees: 1 establishment)
Arts, Entertainment, and Recreation: Skiing Facilities (50-99: 1)
Accommodation and Food Services: Full-Service Restaurants (20-49: 1, 10-19: 1)
Administrative and Support and Waste Management and Remediation Services: Landscaping Services (20-49: 1, 5-9: 2)
Other Services (except Public Administration): Religious Organizations (20-49: 1, 1-4: 2)
Real Estate and Rental and Leasing: Residential Property Managers (20-49: 1, 1-4: 1)
Accommodation and Food Services: Limited-Service Restaurants (20-49: 1, 1-4: 1)
Arts, Entertainment, and Recreation: Golf Courses and Country Clubs (20-49: 1)
People in group quarters in 2000:
3 people in homes for the mentally ill
Fatal accident statistics in 2011:
Fatal accident count: 2
Vehicles involved in fatal accidents: 5
Fatal accidents caused by drunken drivers: 0
Fatalities: 2
Persons involved in fatal accidents: 5
Pedestrians involved in fatal accidents: 0
Home Mortgage Disclosure Act Aggregated Statistics For Year 2009 (Based on 4 partial tracts)
A) FHA, FSA/RHS & VA Home Purchase Loans
B) Conventional Home Purchase Loans
C) Refinancings
D) Home Improvement Loans
E) Loans on Dwellings For 5+ Families
F) Non-occupant Loans on < 5 Family Dwellings (A B C & D)
G) Loans On Manufactured Home Dwelling (A B C & D)
Number
Average Value
Number
Average Value
Number
Average Value
Number
Average Value
Number
Average Value
Number
Average Value
Number
Average Value
LOANS ORIGINATED
14
$182,721
127
$204,284
332
$211,398
37
$84,147
2
$1,446,465
17
$196,862
0
$0
APPLICATIONS APPROVED, NOT ACCEPTED
2
$146,135
10
$217,435
24
$224,788
1
$105,950
0
$0
2
$281,465
0
$0
APPLICATIONS DENIED
3
$244,963
6
$206,620
60
$202,010
15
$95,789
0
$0
5
$107,712
1
$10,110
APPLICATIONS WITHDRAWN
0
$0
13
$111,277
71
$177,306
0
$0
0
$0
4
$161,635
2
$88,695
FILES CLOSED FOR INCOMPLETENESS
0
$0
3
$204,980
7
$252,336
2
$204,415
0
$0
2
$96,295
0
$0
Aggregated Statistics For Year 2008 (Based on 4 partial tracts)
A) FHA, FSA/RHS & VA Home Purchase Loans
B) Conventional Home Purchase Loans
C) Refinancings
D) Home Improvement Loans
F) Non-occupant Loans on < 5 Family Dwellings (A B C & D)
G) Loans On Manufactured Home Dwelling (A B C & D)
Number
Average Value
Number
Average Value
Number
Average Value
Number
Average Value
Number
Average Value
Number
Average Value
LOANS ORIGINATED
8
$201,621
108
$234,421
119
$190,541
46
$61,812
19
$210,483
2
$16,895
APPLICATIONS APPROVED, NOT ACCEPTED
0
$0
12
$196,652
11
$400,465
3
$29,063
0
$0
0
$0
APPLICATIONS DENIED
2
$237,420
3
$131,177
78
$197,350
10
$32,319
5
$113,952
0
$0
APPLICATIONS WITHDRAWN
0
$0
12
$160,961
24
$249,172
4
$48,032
4
$167,062
2
$83,625
FILES CLOSED FOR INCOMPLETENESS
0
$0
2
$356,540
4
$220,870
0
$0
0
$0
0
$0
Aggregated Statistics For Year 2007 (Based on 4 partial tracts)
A) FHA, FSA/RHS & VA Home Purchase Loans
B) Conventional Home Purchase Loans
C) Refinancings
D) Home Improvement Loans
F) Non-occupant Loans on < 5 Family Dwellings (A B C & D)
G) Loans On Manufactured Home Dwelling (A B C & D)
Number
Average Value
Number
Average Value
Number
Average Value
Number
Average Value
Number
Average Value
Number
Average Value
LOANS ORIGINATED
2
$148,665
135
$195,486
130
$174,467
66
$54,471
25
$182,414
0
$0
APPLICATIONS APPROVED, NOT ACCEPTED
0
$0
11
$247,546
4
$147,970
10
$35,576
4
$275,655
2
$101,365
APPLICATIONS DENIED
0
$0
18
$144,299
36
$199,515
25
$60,805
7
$90,897
4
$78,468
APPLICATIONS WITHDRAWN
0
$0
10
$179,446
28
$193,129
4
$21,222
2
$97,695
0
$0
FILES CLOSED FOR INCOMPLETENESS
2
$157,115
6
$147,140
13
$190,095
0
$0
2
$234,030
0
$0
Aggregated Statistics For Year 2006 (Based on 4 partial tracts)
A) FHA, FSA/RHS & VA Home Purchase Loans
B) Conventional Home Purchase Loans
C) Refinancings
D) Home Improvement Loans
F) Non-occupant Loans on < 5 Family Dwellings (A B C & D)
G) Loans On Manufactured Home Dwelling (A B C & D)
Number
Average Value
Number
Average Value
Number
Average Value
Number
Average Value
Number
Average Value
Number
Average Value
LOANS ORIGINATED
6
$127,097
142
$190,048
152
$140,680
68
$62,394
18
$212,204
2
$83,845
APPLICATIONS APPROVED, NOT ACCEPTED
0
$0
9
$175,721
18
$141,067
10
$94,566
2
$359,550
2
$21,960
APPLICATIONS DENIED
0
$0
7
$231,814
52
$162,498
14
$90,827
1
$172,410
3
$78,277
APPLICATIONS WITHDRAWN
0
$0
8
$108,569
31
$170,024
4
$64,930
2
$252,715
0
$0
FILES CLOSED FOR INCOMPLETENESS
0
$0
1
$336,640
14
$160,231
0
$0
2
$97,985
0
$0
Aggregated Statistics For Year 2005 (Based on 4 partial tracts)
A) FHA, FSA/RHS & VA Home Purchase Loans
B) Conventional Home Purchase Loans
C) Refinancings
D) Home Improvement Loans
F) Non-occupant Loans on < 5 Family Dwellings (A B C & D)
G) Loans On Manufactured Home Dwelling (A B C & D)
Number
Average Value
Number
Average Value
Number
Average Value
Number
Average Value
Number
Average Value
Number
Average Value
LOANS ORIGINATED
6
$144,410
154
$154,659
192
$165,598
44
$39,723
26
$166,884
2
$84,705
APPLICATIONS APPROVED, NOT ACCEPTED
0
$0
8
$146,225
26
$91,775
2
$40,125
0
$0
0
$0
APPLICATIONS DENIED
0
$0
22
$180,712
48
$194,701
21
$45,334
20
$30,008
4
$46,030
APPLICATIONS WITHDRAWN
0
$0
15
$225,093
32
$205,582
3
$112,567
0
$0
0
$0
FILES CLOSED FOR INCOMPLETENESS
0
$0
6
$169,433
30
$151,222
0
$0
0
$0
0
$0
Aggregated Statistics For Year 2004 (Based on 4 partial tracts)
A) FHA, FSA/RHS & VA Home Purchase Loans
B) Conventional Home Purchase Loans
C) Refinancings
D) Home Improvement Loans
F) Non-occupant Loans on < 5 Family Dwellings (A B C & D)
G) Loans On Manufactured Home Dwelling (A B C & D)
Number
Average Value
Number
Average Value
Number
Average Value
Number
Average Value
Number
Average Value
Number
Average Value
LOANS ORIGINATED
3
$94,907
184
$191,008
265
$145,005
41
$65,256
38
$162,048
3
$35,477
APPLICATIONS APPROVED, NOT ACCEPTED
0
$0
4
$130,732
33
$129,196
9
$51,256
0
$0
2
$33,790
APPLICATIONS DENIED
0
$0
8
$139,755
58
$134,697
13
$41,489
9
$77,383
4
$32,030
APPLICATIONS WITHDRAWN
0
$0
12
$163,504
50
$148,676
2
$48,080
3
$195,407
0
$0
FILES CLOSED FOR INCOMPLETENESS
0
$0
8
$325,794
21
$124,652
0
$0
0
$0
0
$0
Aggregated Statistics For Year 2003 (Based on 4 partial tracts)
A) FHA, FSA/RHS & VA Home Purchase Loans
B) Conventional Home Purchase Loans
C) Refinancings
D) Home Improvement Loans
F) Non-occupant Loans on < 5 Family Dwellings (A B C & D)
Number
Average Value
Number
Average Value
Number
Average Value
Number
Average Value
Number
Average Value
LOANS ORIGINATED
5
$131,486
159
$186,777
636
$150,905
44
$84,036
41
$121,701
APPLICATIONS APPROVED, NOT ACCEPTED
0
$0
11
$116,942
45
$145,445
4
$24,670
2
$208,010
APPLICATIONS DENIED
0
$0
11
$168,994
74
$217,708
11
$29,440
4
$143,580
APPLICATIONS WITHDRAWN
0
$0
30
$227,133
71
$130,445
0
$0
6
$112,228
FILES CLOSED FOR INCOMPLETENESS
0
$0
6
$127,640
13
$195,219
0
$0
2
$76,025
Aggregated Statistics For Year 2002 (Based on 4 partial tracts)
A) FHA, FSA/RHS & VA Home Purchase Loans
B) Conventional Home Purchase Loans
C) Refinancings
D) Home Improvement Loans
F) Non-occupant Loans on < 5 Family Dwellings (A B C & D)
Number
Average Value
Number
Average Value
Number
Average Value
Number
Average Value
Number
Average Value
LOANS ORIGINATED
12
$120,947
138
$164,999
449
$159,028
35
$49,243
27
$134,600
APPLICATIONS APPROVED, NOT ACCEPTED
0
$0
7
$126,099
63
$104,946
2
$81,200
0
$0
APPLICATIONS DENIED
0
$0
17
$101,318
96
$128,278
6
$30,657
3
$103,353
APPLICATIONS WITHDRAWN
0
$0
9
$173,571
41
$122,237
0
$0
0
$0
FILES CLOSED FOR INCOMPLETENESS
0
$0
0
$0
6
$111,762
0
$0
0
$0
Aggregated Statistics For Year 2001 (Based on 4 partial tracts)
A) FHA, FSA/RHS & VA Home Purchase Loans
B) Conventional Home Purchase Loans
C) Refinancings
D) Home Improvement Loans
F) Non-occupant Loans on < 5 Family Dwellings (A B C & D)
Number
Average Value
Number
Average Value
Number
Average Value
Number
Average Value
Number
Average Value
LOANS ORIGINATED
13
$104,239
129
$165,207
275
$163,473
39
$62,787
8
$107,785
APPLICATIONS APPROVED, NOT ACCEPTED
0
$0
11
$219,713
25
$70,796
5
$90,450
0
$0
APPLICATIONS DENIED
0
$0
17
$79,386
76
$116,132
4
$31,128
0
$0
APPLICATIONS WITHDRAWN
0
$0
3
$65,443
43
$141,265
6
$12,622
4
$77,398
FILES CLOSED FOR INCOMPLETENESS
0
$0
0
$0
10
$150,222
0
$0
0
$0
Aggregated Statistics For Year 2000 (Based on 4 partial tracts)
A) FHA, FSA/RHS & VA Home Purchase Loans
B) Conventional Home Purchase Loans
C) Refinancings
D) Home Improvement Loans
E) Loans on Dwellings For 5+ Families
F) Non-occupant Loans on < 5 Family Dwellings (A B C & D)
Number
Average Value
Number
Average Value
Number
Average Value
Number
Average Value
Number
Average Value
Number
Average Value
LOANS ORIGINATED
6
$112,118
118
$145,679
63
$96,563
36
$47,855
2
$1,496,810
7
$71,171
APPLICATIONS APPROVED, NOT ACCEPTED
0
$0
7
$76,706
12
$83,348
1
$23,120
0
$0
0
$0
APPLICATIONS DENIED
0
$0
21
$66,517
30
$124,242
9
$32,117
0
$0
0
$0
APPLICATIONS WITHDRAWN
0
$0
6
$188,368
10
$69,939
2
$46,575
0
$0
0
$0
FILES CLOSED FOR INCOMPLETENESS
0
$0
0
$0
2
$87,930
0
$0
0
$0
0
$0
Aggregated Statistics For Year 1999 (Based on 2 partial tracts)
A) FHA, FSA/RHS & VA Home Purchase Loans
B) Conventional Home Purchase Loans
C) Refinancings
D) Home Improvement Loans
E) Loans on Dwellings For 5+ Families
F) Non-occupant Loans on < 5 Family Dwellings (A B C & D)
Detailed PMIC statistics for the following Tracts:0117.00
, 0118.00
2004 - 2018 National Fire Incident Reporting System (NFIRS) incidents
Based on the data from the years 2004 - 2018 the average number of fire incidents per year is 14. The highest number of fire incidents - 30 took place in 2006, and the least - 2 in 2011. The data has an increasing trend.
When looking into fire subcategories, the most incidents belonged to: Structure Fires (50.5%), and Outside Fires (29.4%).
Fire incident types reported to NFIRS in Zip Code 16827


 Nearest zip codes: 16851, 16801, 16802, 16828, 16868, 16803.


 Based on the data from the years 2004 - 2018 the average number of fire incidents per year is 14. The highest number of fire incidents - 30 took place in 2006, and the least - 2 in 2011. The data has an increasing trend.
 When looking into fire subcategories, the most incidents belonged to: Structure Fires (50.5%), and Outside Fires (29.4%).