Estimated zip code population in 2022: 1,235 Zip code population in 2010: 1,392 Zip code population in 2000: 1,380
Houses and condos: 2,134 Renter-occupied apartments: 78
% of renters here:
15%
State:
31%
March 2022 cost of living index in zip code 16720: 90.4 (less than average, U.S. average is 100)
Land area: 292.7 sq. mi. Water area: 0.2 sq. mi.
Population density: 4 people per square mile
(very low).
OSM Map
General Map
Google Map
MSN Map
OSM Map
General Map
Google Map
MSN Map
OSM Map
General Map
Google Map
MSN Map
OSM Map
General Map
Google Map
MSN Map
Please wait while loading the map...
Real estate property taxes paid for housing units in 2022:
This zip code:
1.3% ($1,255)
Pennsylvania:
1.3% ($3,094)
Median real estate property taxes paid for housing units with mortgages in 2022: $1,384 (1.4%) Median real estate property taxes paid for housing units with no mortgage in 2022: $1,036 (1.1%)
Business Search- 14 Million verified businesses
Males: 661
(53.6%)
Females: 573
(46.4%)
For population 25 years and over in 16720:
High school or higher: 90.0%
Bachelor's degree or higher: 11.1%
Graduate or professional degree: 2.7%
Unemployed: 7.6%
Mean travel time to work (commute): 30.2 minutes
For population 15 years and over in 16720:
Never married: 20.3%
Now married: 56.0%
Separated: 3.7%
Widowed: 8.7%
Divorced: 11.4%
Zip code 16720 compared to state average:
Median house value significantly below state average.
Unemployed percentage above state average.
Black race population percentage significantly below state average.
Hispanic race population percentage significantly below state average.
Median age significantly above state average.
Foreign-born population percentage significantly below state average.
Renting percentage below state average.
Length of stay since moving in significantly above state average.
Number of rooms per house below state average.
Number of college students below state average.
Percentage of population with a bachelor's degree or higher significantly below state average.
Averages for the 2020 tax year for zip code 16720, filed in 2021:
Average Adjusted Gross Income (AGI) in 2020: $48,046 (Individual Income Tax Returns)
Here:
$48,046
State:
$75,707
Salary/wage: $40,158 (reported on 75.4% of returns)
Here:
$40,158
State:
$62,806
(% of AGI for various income ranges: 877.7% for AGIs below $25k, 2820.8% for AGIs $25k-50k, 5153.8% for AGIs $50k-75k, 7872.0% for AGIs $75k-100k, 15610.0% for AGIs $100k-200k)
Taxable interest for individuals: $447 (reported on 26.3% of returns)
This zip code:
$447
Pennsylvania:
$1,633
(% of AGI for various income ranges: 8.5% for AGIs below $25k, 6.7% for AGIs $25k-50k, 37.5% for AGIs $50k-75k, 60.0% for AGIs $100k-200k)
Ordinary dividends: $1,125 (reported on 14.0% of returns)
Here:
$1,125
State:
$7,382
(% of AGI for various income ranges: 15.4% for AGIs below $25k, 36.7% for AGIs $25k-50k, 52.0% for AGIs $75k-100k)
Net capital gain/loss in AGI: +$1,520 (reported on 8.8% of returns)
Here:
+$1,520
State:
+$23,522
(% of AGI for various income ranges: 5.4% for AGIs below $25k, 86.2% for AGIs $50k-75k)
Profit/loss from business: +$4,800 (reported on 10.5% of returns)
Here:
+$4,800
State:
+$16,274
(% of AGI for various income ranges: 130.0% for AGIs below $25k, 148.8% for AGIs $50k-75k)
Taxable individual retirement arrangement distribution: $15,550 (reported on 14.0% of returns)
16720:
$15,550
Pennsylvania:
$18,583
(% of AGI for various income ranges: 310.0% for AGIs below $25k, 1051.2% for AGIs $50k-75k)
Earned income credit: $1,688 (reported on 14.0% of returns)
Here:
$1,688
State:
$2,100
(% of AGI for various income ranges: 60.0% for AGIs below $25k, 47.5% for AGIs $25k-50k)
Percentage of individuals using paid preparers for their 2020 taxes: 94.7%
Here:
95%
State:
92%
(% for various income ranges: 95.2% for AGIs below $25k, 100.0% for AGIs $25k-50k, 90.9% for AGIs $50k-75k, 83.3% for AGIs $75k-100k, 100.0% for AGIs $100k-200k)
Averages for the 2012 tax year for zip code 16720, filed in 2013:
Average Adjusted Gross Income (AGI) in 2012: $37,194 (Individual Income Tax Returns)
Here:
$37,194
State:
$61,346
Salary/wage: $34,239 (reported on 77.8% of returns)
Here:
$34,239
State:
$51,902
(% of AGI for various income ranges: 65.5% for AGIs below $25k, 70.3% for AGIs $25k-50k, 67.0% for AGIs $50k-75k, 76.9% for AGIs $75k-100k, 78.5% for AGIs $100k-200k)
Taxable interest for individuals: $463 (reported on 30.2% of returns)
This zip code:
$463
Pennsylvania:
$1,588
(% of AGI for various income ranges: 0.9% for AGIs below $25k, 0.3% for AGIs $25k-50k, 0.7% for AGIs $50k-75k)
Ordinary dividends: $1,780 (reported on 15.9% of returns)
Here:
$1,780
State:
$5,827
(% of AGI for various income ranges: 1.1% for AGIs below $25k, 1.7% for AGIs $25k-50k, 0.6% for AGIs $75k-100k)
Net capital gain/loss in AGI: +$580 (reported on 7.9% of returns)
Here:
+$580
State:
+$14,495
Profit/loss from business: +$8,588 (reported on 12.7% of returns)
Here:
+$8,588
State:
+$16,268
Taxable individual retirement arrangement distribution: $12,400 (reported on 11.1% of returns)
16720:
$12,400
Pennsylvania:
$14,550
Total itemized deductions: $15,229 (23% of AGI, reported on 11.1% of returns)
Here:
$15,229
State:
$23,538
Here:
23.1% of AGI
State:
18.4% of AGI
Charity contributions: $1,200 (reported on 4.8% of returns)
Here:
$1,200
State:
$4,025
Taxes paid: $4,929 (reported on 11.1% of returns)
16720:
$4,929
State:
$9,982
Earned income credit: $2,155 (reported on 17.5% of returns)
Here:
$2,155
State:
$2,106
(% of AGI for various income ranges: 4.8% for AGIs below $25k, 1.1% for AGIs $25k-50k)
Percentage of individuals using paid preparers for their 2012 taxes: 66.7%
Here:
67%
State:
53%
(% for various income ranges: 62.1% for AGIs below $25k, 66.7% for AGIs $25k-50k, 75.0% for AGIs $50k-75k, 80.0% for AGIs $75k-100k, 66.7% for AGIs $100k-200k)
Averages for the 2004 tax year for zip code 16720, filed in 2005:
Average Adjusted Gross Income (AGI) in 2004: $31,265 (Individual Income Tax Returns)
Here:
$31,265
State:
$48,049
Salary/wage: $29,340 (reported on 83.0% of returns)
Here:
$29,340
State:
$42,646
(% of AGI for various income ranges: 64.7% for AGIs below $10k, 67.2% for AGIs $10k-25k, 82.6% for AGIs $25k-50k, 77.6% for AGIs $50k-75k, 79.1% for AGIs $75k-100k)
Taxable interest for individuals: $1,000 (reported on 43.1% of returns)
This zip code:
$1,000
Pennsylvania:
$1,657
(% of AGI for various income ranges: 3.4% for AGIs below $10k, 2.0% for AGIs $10k-25k, 1.8% for AGIs $25k-50k, 0.9% for AGIs $50k-75k, 0.3% for AGIs $75k-100k)
Taxable dividends: $1,071 (reported on 19.3% of returns)
Here:
$1,071
State:
$3,566
(% of AGI for various income ranges: 0.8% for AGIs below $10k, 1.0% for AGIs $10k-25k, 0.6% for AGIs $25k-50k, 0.8% for AGIs $50k-75k, 0.3% for AGIs $75k-100k)
Net capital gain/loss: +$1,055 (reported on 11.2% of returns)
Here:
+$1,055
State:
+$9,716
Profit/loss from business: +$671 (reported on 12.1% of returns)
Here:
+$671
State:
+$14,267
(% of AGI for various income ranges: 6.9% for AGIs below $10k, 1.9% for AGIs $10k-25k, -0.1% for AGIs $25k-50k, -0.7% for AGIs $50k-75k)
Total itemized deductions: $12,625 (22% of AGI, reported on 11.0% of returns)
Here:
$12,625
State:
$18,804
Here:
22.1% of AGI
State:
19.5% of AGI
Charity contributions deductions: $1,745 (3% of AGI, reported on 7.2% of returns)
Here:
$1,745
State:
$3,337
Here:
2.7% of AGI
State:
3.3% of AGI
Total tax: $3,277 (reported on 70.4% of returns)
16720:
$3,277
State:
$8,008
(% of AGI for various income ranges: 1.5% for AGIs below $10k, 3.6% for AGIs $10k-25k, 6.4% for AGIs $25k-50k, 8.1% for AGIs $50k-75k, 12.3% for AGIs $75k-100k)
Earned income credit: $1,529 (reported on 15.6% of returns)
Here:
$1,529
State:
$1,643
Percentage of individuals using paid preparers for their 2004 taxes: 59.5%
Here:
60%
State:
56%
(% for various income ranges: 52.6% for AGIs below $10k, 57.4% for AGIs $10k-25k, 60.2% for AGIs $25k-50k, 70.3% for AGIs $50k-75k, 64.1% for AGIs $75k-100k)
Household received Food Stamps/SNAP in the past 12 months: 65 Household did not receive Food Stamps/SNAP in the past 12 months: 446
Women who had a birth in the past 12 months: 12 (4 now married, 6 unmarried) Women who did not have a birth in the past 12 months: 192 (105 now married, 86 unmarried)
Housing units in zip code 16720 with a mortgage: 169 (23 second mortgage, 23 both second mortgage and home equity loan) Houses without a mortgage: 9
Median monthly owner costs for units with a mortgage: $889 Median monthly owner costs for units without a mortgage: $391
Residents with income below the poverty level in 2022:
This zip code:
10.2%
Whole state:
11.8%
Residents with income below 50% of the poverty level in 2022:
This zip code:
5.6%
Whole state:
6.1%
Median number of rooms in houses and condos:
Here:
6.0
State:
6.8
Median number of rooms in apartments:
Here:
5.8
State:
4.3
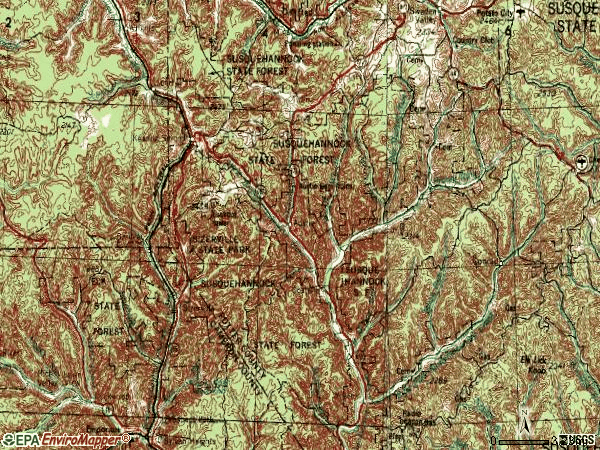
Notable locations in this zip code not listed on our city pages
Notable locations in zip code 16720: Shippen Station (A), Prouty Place Camp (B), Bailey Run (C), Austin Emergency Services (D). Display/hide their locations on the map
Cemeteries: Wharton Cemetery (1), Brooks Cemetery (2), Gilmore Cemetery (3), Reed Cemetery (4), McFall Cemetery (5), Saint Joseph Cemetery (6), Moores Run Cemetery (7). Display/hide their locations on the map
Streams, rivers, and creeks: West Darian Run (A), Rattlesnake Run (B), Bell Branch (C), Norcross Run (D), Berge Run (E), Nelson Branch (F), Muley Run (G), Jones Run (H), Jamison Run (I). Display/hide their locations on the map
Parks in zip code 16720 include: State Game Lands Number 30 (1), Sinnemahoning State Park (2), Prouty Place State Park (3), Little Cherry Springs Park (4), Sizerville State Park (5). Display/hide their locations on the map
Size of family households: 179 2-persons, 67 3-persons, 48 4-persons, 5 5-persons, 17 6-persons, 2 7-or-more-persons
Size of nonfamily households: 164 1-person, 27 2-persons
191 married couples with children.
69 single-parent households (37 men, 32 women).
98.6% of residents of 16720 zip code speak English at home.
0.6% of residents speak Spanish at home (43% very well, 57% not well).
0.4% of residents speak other Indo-European language at home (20% very well, 80% not well).
Foreign born population: 13 (1.1%) (31.6% of them are naturalized citizens)
This zip code:
1.1%
Whole state:
7.5%
62%France
23%Dominica
28%German
24%American
11%English
10%Italian
4%Irish
4%French
2%European
Year of entry for the foreign-born population
42010 or later
32000 to 2009
01990 to 1999
10Before 1990
Facilities with environmental interests located in this zip code:
AUSTIN BORO WATER SYS (HORN HOLLOW ROAD in AUSTIN, PA)
STATE MASTER (Pennsylvania database) - PWSID-6530005, DRINKING WATER PROGRAM STATE MASTER (Pennsylvania database) - PCS-PA0208825, National Pollutant Discharge Elimination System Permit National Pollutant Discharge Elimination System NON-MAJOR (Tracking pollutant discharge elimination systems) - permit COMMUNITY WATER SYSTEM (SDWIS) - SDWIS-PA6530005 301, WATER TREATMENT PLANT, SDWIS-PA6530005 302, Business SIC classification: WATER SUPPLY; SEWERAGE SYSTEMS Organizations: AUSTIN BOROUGH (CONTACT/OWNER)
Alternative names: AUSTIN BORO SEW SYS STP
AUSTIN AREA EL SCH ( in AUSTIN, PA)
(National Center for Education Statistics) - STATE ID-6221 Organizations: AUSTIN AREA SD (SCHOOL DISTRICT)
AUSTIN AREA JSHS ( in AUSTIN, PA)
(National Center for Education Statistics) - STATE ID-6222 Organizations: AUSTIN AREA SD (SCHOOL DISTRICT)
Housing units lacking complete plumbing facilities: 25.4% Housing units lacking complete kitchen facilities: 10.6%
62.4%Utility gas
12.6%Bottled, tank, or LP gas
10.8%Wood
4.6%Fuel oil, kerosene, etc.
3.6%Coal or coke
2.4%No fuel used
2.2%Electricity
1.8%Other fuel
Population in 1990: 1,123. Population change in the 1990s: +257 (+22.9%).
Place of birth for U.S.-born residents:
This state: 1,066
Northeast: 83
Midwest: 22
South: 20
West: 14
70% of the 16720 zip code residents lived in the same house 5 years ago. Out of people who lived in different houses, 42% lived in this county. Out of people who lived in different counties, 50% lived in Pennsylvania.
94% of the 16720 zip code residents lived in the same house 1 year ago. Out of people who lived in different houses, 25% moved from this county. Out of people who lived in different houses, 55% moved from different county within same state. Out of people who lived in different houses, 16% moved from different state. Out of people who lived in different houses, 4% moved from abroad.
Private vs. public school enrollment:
Students in private schools in grades 1 to 8 (elementary and middle school):
Here:
0.0%
Pennsylvania:
15.7%
Students in private schools in grades 9 to 12 (high school):
Here:
0.0%
Pennsylvania:
13.4%
Students in private undergraduate colleges: 2
Here:
12.1%
Pennsylvania:
39.8%
Occupation by median earnings in the past 12 months ($)
87,460Architecture and engineering occupations
67,166Management occupations
47,711Production occupations
47,486Health technologists and technicians
46,623Education, training, and library occupations
43,738Personal care and service occupations
Top industries in this zip code by the number of employees in 2005:
Utilities: Natural Gas Distribution (10-19 employees: 1 establishment)
Accommodation and Food Services: Drinking Places (Alcoholic Beverages) (1-4: 6)
Other Services (except Public Administration): Professional Organizations (5-9: 1)
Construction: Plumbing, Heating, and Air-Conditioning Contractors (1-4: 1)
Construction: Site Preparation Contractors (1-4: 1)
Finance and Insurance: Savings Institutions (1-4: 1)
Other Services (except Public Administration): Civic and Social Organizations (1-4: 1)
Fatal accident statistics in 2012:
Fatal accident count: 1
Vehicles involved in fatal accidents: 1
Fatal accidents caused by drunken drivers: 0
Fatalities: 1
Persons involved in fatal accidents: 1
Pedestrians involved in fatal accidents: 0
Fatal accident statistics in 2011:
Fatal accident count: 1
Vehicles involved in fatal accidents: 1
Fatal accidents caused by drunken drivers: 0
Fatalities: 1
Persons involved in fatal accidents: 1
Pedestrians involved in fatal accidents: 0
Most common first names in zip code 16720 among deceased individuals
Name
Count
Lived (average)
John
19
73.6 years
Mary
10
83.1 years
Charles
9
76.2 years
James
8
73.9 years
Elizabeth
7
76.4 years
Richard
6
70.7 years
William
6
79.7 years
Edna
6
79.0 years
Joseph
6
73.3 years
Francis
5
70.0 years
Most common last names in zip code 16720 among deceased individuals
Last name
Count
Lived (average)
Cooney
8
78.2 years
Vanwhy
7
69.9 years
Lentz
7
66.5 years
Lewis
7
83.6 years
Purdy
6
71.6 years
Ripple
6
79.8 years
Fitch
6
72.8 years
Williams
5
74.4 years
Ludwig
5
75.6 years
Glover
5
68.6 years
Discuss Austin, Pennsylvania (PA) on our hugely popular Pennsylvania forum.

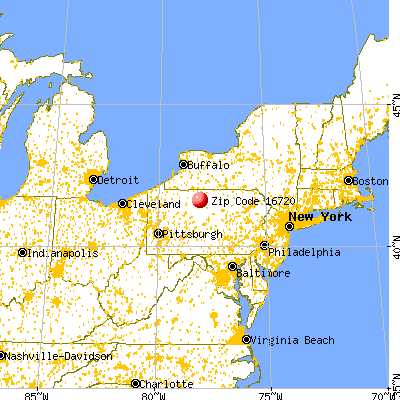


 Nearest zip codes: 16915, 16746, 16743, 17729, 15861, 15832.