Estimated zip code population in 2022: 2,182 Zip code population in 2010: 2,351 Zip code population in 2000: 2,209
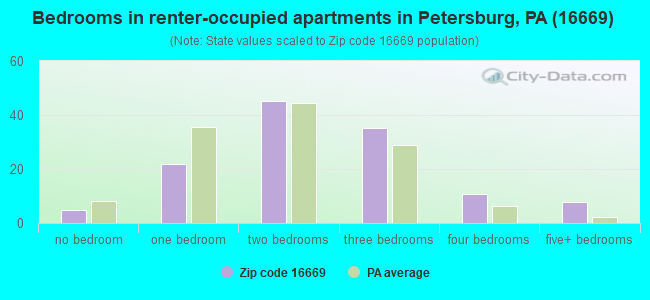
Houses and condos: 1,206 Renter-occupied apartments: 126
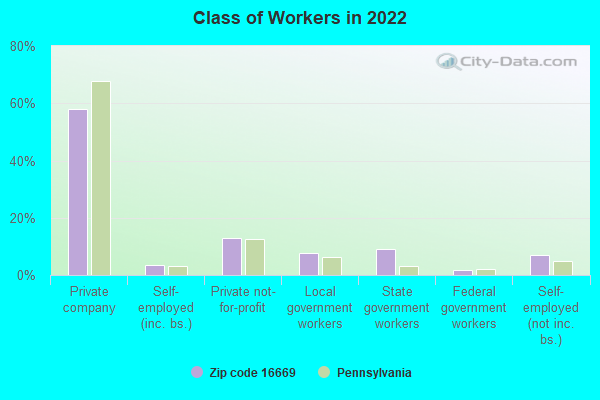
% of renters here:
15%
State:
31%
March 2022 cost of living index in zip code 16669: 91.5 (less than average, U.S. average is 100)
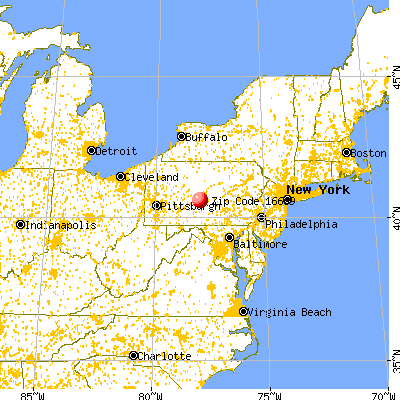
Land area: 106.0 sq. mi. Water area: 0.3 sq. mi.
Population density: 21 people per square mile
(very low).
OSM Map
General Map
Google Map
MSN Map
OSM Map
General Map
Google Map
MSN Map
OSM Map
General Map
Google Map
MSN Map
OSM Map
General Map
Google Map
MSN Map
Please wait while loading the map...
Real estate property taxes paid for housing units in 2022:
This zip code:
0.8% ($1,607)
Pennsylvania:
1.3% ($3,094)
Median real estate property taxes paid for housing units with mortgages in 2022: $1,721 (0.8%) Median real estate property taxes paid for housing units with no mortgage in 2022: $1,512 (0.8%)
Business Search- 14 Million verified businesses
Males: 1,087
(49.8%)
Females: 1,094
(50.2%)
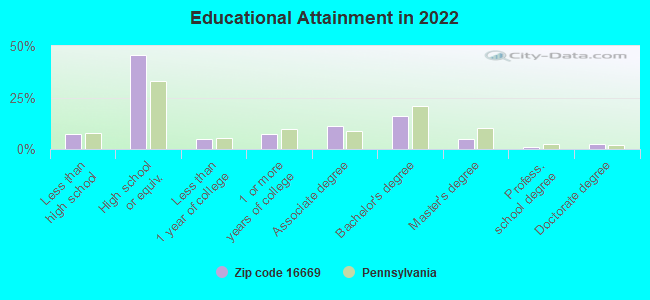
For population 25 years and over in 16669:
High school or higher: 92.0%
Bachelor's degree or higher: 23.7%
Graduate or professional degree: 7.9%
Unemployed: 6.2%
Mean travel time to work (commute): 29.8 minutes
For population 15 years and over in 16669:
Never married: 23.5%
Now married: 58.8%
Separated: 0.9%
Widowed: 8.1%
Divorced: 8.8%
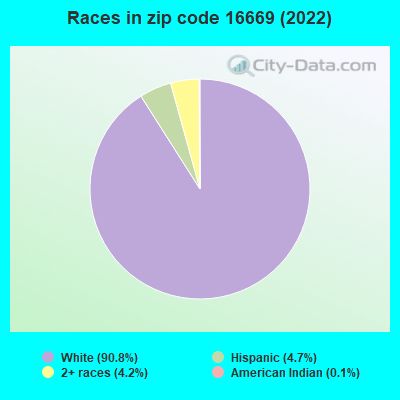
Zip code 16669 compared to state average:
Black race population percentage significantly below state average.
Hispanic race population percentage below state average.
Median age above state average.
Foreign-born population percentage significantly below state average.
Renting percentage below state average.
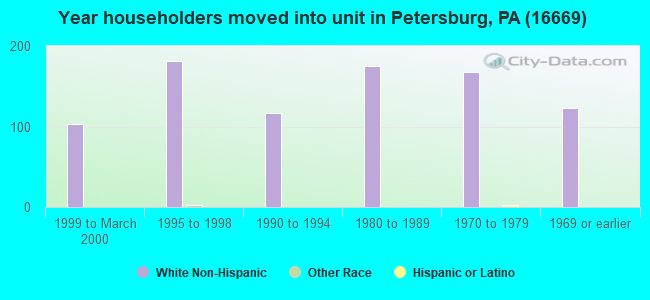
Length of stay since moving in significantly above state average.
Number of college students below state average.
Percentage of population with a bachelor's degree or higher below state average.
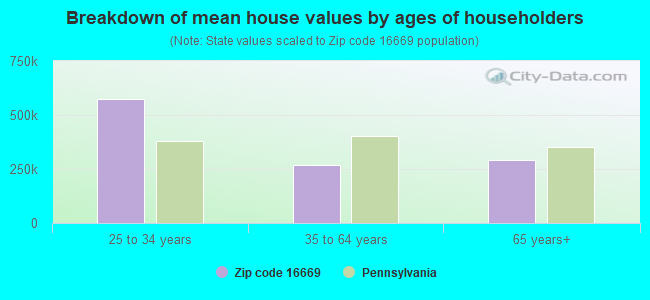
Estimated median house/condo value in 2022: $200,025
16669:
$200,025
Pennsylvania:
$245,500
According to our research of Pennsylvania and other state lists, there was 1 registered sex offender living in 16669 zip code as of May 19, 2024. The ratio of all residents to sex offenders in zip code 16669 is 2,170 to 1. The ratio of registered sex offenders to all residents in this zip code is much lower than the state average.
Median resident age:
This zip code:
45.0 years
Pennsylvania median age:
40.9 years
Average household size:
This zip code:
2.5 people
Pennsylvania:
2.4 people
Averages for the 2020 tax year for zip code 16669, filed in 2021:
Average Adjusted Gross Income (AGI) in 2020: $55,738 (Individual Income Tax Returns)
Here:
$55,738
State:
$75,707
Salary/wage: $46,740 (reported on 78.8% of returns)
Here:
$46,740
State:
$62,806
(% of AGI for various income ranges: 1037.8% for AGIs below $25k, 3475.8% for AGIs $25k-50k, 5816.4% for AGIs $50k-75k, 7948.9% for AGIs $75k-100k, 14349.1% for AGIs $100k-200k)
Taxable interest for individuals: $1,071 (reported on 29.8% of returns)
This zip code:
$1,071
Pennsylvania:
$1,633
(% of AGI for various income ranges: 10.0% for AGIs below $25k, 18.9% for AGIs $25k-50k, 53.6% for AGIs $50k-75k, 22.2% for AGIs $75k-100k, 176.4% for AGIs $100k-200k)
Ordinary dividends: $3,194 (reported on 17.3% of returns)
Here:
$3,194
State:
$7,382
(% of AGI for various income ranges: 30.4% for AGIs below $25k, 50.0% for AGIs $25k-50k, 111.1% for AGIs $75k-100k, 281.8% for AGIs $100k-200k)
Net capital gain/loss in AGI: +$9,181 (reported on 15.4% of returns)
Here:
+$9,181
State:
+$23,522
(% of AGI for various income ranges: 12.6% for AGIs below $25k, 41.1% for AGIs $25k-50k, 86.4% for AGIs $50k-75k, 206.7% for AGIs $75k-100k, 982.7% for AGIs $100k-200k)
Profit/loss from business: +$11,886 (reported on 13.5% of returns)
Here:
+$11,886
State:
+$16,274
(% of AGI for various income ranges: 46.1% for AGIs below $25k, 230.0% for AGIs $25k-50k, 348.9% for AGIs $75k-100k, 733.6% for AGIs $100k-200k)
Taxable individual retirement arrangement distribution: $12,546 (reported on 12.5% of returns)
16669:
$12,546
Pennsylvania:
$18,583
(% of AGI for various income ranges: 82.2% for AGIs below $25k, 118.9% for AGIs $25k-50k, 466.4% for AGIs $50k-75k, 639.1% for AGIs $100k-200k)
Total itemized deductions: $25,967 (reported on 2.9% of returns)
Here:
$25,967
State:
$34,850
(% of AGI for various income ranges: 708.2% for AGIs $50k-75k)
Taxes paid: $5,600 (reported on 2.9% of returns)
16669:
$5,600
State:
$8,200
(% of AGI for various income ranges: 88.4% for AGIs $25k-50k)
Earned income credit: $2,029 (reported on 13.5% of returns)
Here:
$2,029
State:
$2,100
(% of AGI for various income ranges: 67.8% for AGIs below $25k, 67.4% for AGIs $25k-50k)
Percentage of individuals using paid preparers for their 2020 taxes: 96.2%
Here:
96%
State:
92%
(% for various income ranges: 94.1% for AGIs below $25k, 96.2% for AGIs $25k-50k, 100.0% for AGIs $50k-75k, 100.0% for AGIs $75k-100k, 94.1% for AGIs $100k-200k)
Averages for the 2012 tax year for zip code 16669, filed in 2013:
Average Adjusted Gross Income (AGI) in 2012: $44,452 (Individual Income Tax Returns)
Here:
$44,452
State:
$61,346
Salary/wage: $39,219 (reported on 77.7% of returns)
Here:
$39,219
State:
$51,902
(% of AGI for various income ranges: 63.0% for AGIs below $25k, 74.1% for AGIs $25k-50k, 76.1% for AGIs $50k-75k, 69.5% for AGIs $75k-100k, 58.9% for AGIs $100k-200k)
Taxable interest for individuals: $506 (reported on 34.0% of returns)
This zip code:
$506
Pennsylvania:
$1,588
(% of AGI for various income ranges: 0.6% for AGIs below $25k, 0.4% for AGIs $25k-50k, 0.4% for AGIs $50k-75k, 0.4% for AGIs $75k-100k, 0.2% for AGIs $100k-200k)
Ordinary dividends: $3,595 (reported on 18.4% of returns)
Here:
$3,595
State:
$5,827
(% of AGI for various income ranges: 1.4% for AGIs below $25k, 0.9% for AGIs $25k-50k, 1.0% for AGIs $50k-75k, 1.6% for AGIs $75k-100k, 2.3% for AGIs $100k-200k)
Net capital gain/loss in AGI: +$4,607 (reported on 14.6% of returns)
Here:
+$4,607
State:
+$14,495
(% of AGI for various income ranges: 0.8% for AGIs below $25k, 0.1% for AGIs $25k-50k, 1.5% for AGIs $50k-75k, 1.5% for AGIs $75k-100k, 3.0% for AGIs $100k-200k)
Profit/loss from business: +$13,480 (reported on 14.6% of returns)
Here:
+$13,480
State:
+$16,268
(% of AGI for various income ranges: 7.1% for AGIs below $25k, 1.9% for AGIs $25k-50k, 5.0% for AGIs $50k-75k, 10.1% for AGIs $75k-100k)
Taxable individual retirement arrangement distribution: $10,415 (reported on 12.6% of returns)
16669:
$10,415
Pennsylvania:
$14,550
(% of AGI for various income ranges: 4.6% for AGIs below $25k, 3.7% for AGIs $25k-50k, 8.0% for AGIs $75k-100k)
Total itemized deductions: $18,045 (23% of AGI, reported on 21.4% of returns)
Here:
$18,045
State:
$23,538
Here:
23.3% of AGI
State:
18.4% of AGI
(% of AGI for various income ranges: 4.5% for AGIs below $25k, 7.2% for AGIs $25k-50k, 7.6% for AGIs $50k-75k, 9.9% for AGIs $75k-100k, 11.5% for AGIs $100k-200k)
Charity contributions: $4,025 (reported on 15.5% of returns)
Here:
$4,025
State:
$4,025
(% of AGI for various income ranges: 0.9% for AGIs $25k-50k, 0.8% for AGIs $50k-75k, 0.9% for AGIs $75k-100k, 3.3% for AGIs $100k-200k)
Taxes paid: $5,318 (reported on 21.4% of returns)
16669:
$5,318
State:
$9,982
(% of AGI for various income ranges: 0.7% for AGIs below $25k, 1.5% for AGIs $25k-50k, 2.0% for AGIs $50k-75k, 2.7% for AGIs $75k-100k, 4.5% for AGIs $100k-200k)
Earned income credit: $2,172 (reported on 17.5% of returns)
Here:
$2,172
State:
$2,106
(% of AGI for various income ranges: 6.1% for AGIs below $25k, 1.0% for AGIs $25k-50k)
Percentage of individuals using paid preparers for their 2012 taxes: 64.1%
Here:
64%
State:
53%
(% for various income ranges: 61.0% for AGIs below $25k, 64.0% for AGIs $25k-50k, 70.6% for AGIs $50k-75k, 66.7% for AGIs $75k-100k, 62.5% for AGIs $100k-200k)
Averages for the 2004 tax year for zip code 16669, filed in 2005:
Average Adjusted Gross Income (AGI) in 2004: $34,581 (Individual Income Tax Returns)
Here:
$34,581
State:
$48,049
Salary/wage: $32,358 (reported on 82.5% of returns)
Here:
$32,358
State:
$42,646
(% of AGI for various income ranges: 105.7% for AGIs below $10k, 64.5% for AGIs $10k-25k, 78.6% for AGIs $25k-50k, 83.5% for AGIs $50k-75k, 91.2% for AGIs $75k-100k, 57.6% for AGIs over 100k)
Taxable interest for individuals: $844 (reported on 45.7% of returns)
This zip code:
$844
Pennsylvania:
$1,657
(% of AGI for various income ranges: 4.2% for AGIs below $10k, 1.9% for AGIs $10k-25k, 0.8% for AGIs $25k-50k, 0.7% for AGIs $50k-75k, 0.2% for AGIs $75k-100k, 2.1% for AGIs over 100k)
Taxable dividends: $1,917 (reported on 20.3% of returns)
Here:
$1,917
State:
$3,566
(% of AGI for various income ranges: 2.0% for AGIs below $10k, 1.7% for AGIs $10k-25k, 1.2% for AGIs $25k-50k, 0.4% for AGIs $50k-75k, 0.2% for AGIs $75k-100k, 2.5% for AGIs over 100k)
Net capital gain/loss: +$486 (reported on 14.3% of returns)
Here:
+$486
State:
+$9,716
(% of AGI for various income ranges: -2.6% for AGIs below $10k, 0.4% for AGIs $10k-25k, 0.4% for AGIs $25k-50k, 0.1% for AGIs $50k-75k, 0.4% for AGIs over 100k)
Profit/loss from business: +$7,627 (reported on 14.9% of returns)
Here:
+$7,627
State:
+$14,267
(% of AGI for various income ranges: 8.8% for AGIs below $10k, 6.6% for AGIs $10k-25k, 4.5% for AGIs $25k-50k, 2.4% for AGIs $50k-75k, 1.6% for AGIs $75k-100k)
IRA payment deduction: $2,389 (reported on 3.6% of returns)
16669:
$2,389
Pennsylvania:
$2,903
Total itemized deductions: $14,220 (22% of AGI, reported on 18.9% of returns)
Here:
$14,220
State:
$18,804
Here:
22.3% of AGI
State:
19.5% of AGI
(% of AGI for various income ranges: 6.4% for AGIs $10k-25k, 6.7% for AGIs $25k-50k, 7.1% for AGIs $50k-75k, 10.4% for AGIs $75k-100k, 11.9% for AGIs over 100k)
Charity contributions deductions: $3,131 (4% of AGI, reported on 14.4% of returns)
Here:
$3,131
State:
$3,337
Here:
4.4% of AGI
State:
3.3% of AGI
(% of AGI for various income ranges: 3.4% for AGIs below $10k, 0.8% for AGIs $25k-50k, 1.0% for AGIs $50k-75k, 1.5% for AGIs $75k-100k, 3.7% for AGIs over 100k)
Total tax: $3,991 (reported on 74.3% of returns)
16669:
$3,991
State:
$8,008
(% of AGI for various income ranges: 3.6% for AGIs below $10k, 4.6% for AGIs $10k-25k, 6.5% for AGIs $25k-50k, 8.5% for AGIs $50k-75k, 10.3% for AGIs $75k-100k, 15.9% for AGIs over 100k)
Earned income credit: $1,604 (reported on 13.8% of returns)
Here:
$1,604
State:
$1,643
Percentage of individuals using paid preparers for their 2004 taxes: 66.6%
Here:
67%
State:
56%
(% for various income ranges: 61.2% for AGIs below $10k, 67.8% for AGIs $10k-25k, 70.7% for AGIs $25k-50k, 65.3% for AGIs $50k-75k, 73.9% for AGIs $75k-100k, 54.1% for AGIs over 100k)
Household received Food Stamps/SNAP in the past 12 months: 52 Household did not receive Food Stamps/SNAP in the past 12 months: 814
Women who had a birth in the past 12 months: 42 (37 now married, 6 unmarried) Women who did not have a birth in the past 12 months: 423 (227 now married, 194 unmarried)
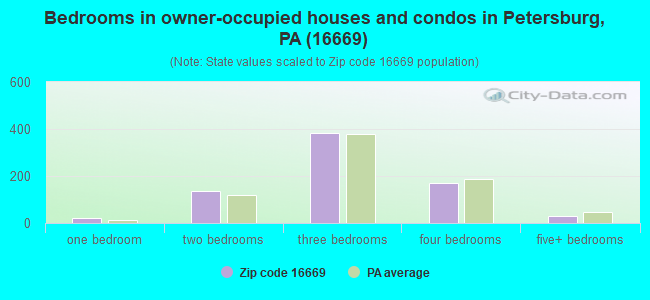
Housing units in zip code 16669 with a mortgage: 348 (44 second mortgage, 39 both second mortgage and home equity loan) Houses without a mortgage: 17
Median monthly owner costs for units with a mortgage: $1,330 Median monthly owner costs for units without a mortgage: $433
Residents with income below the poverty level in 2022:
This zip code:
10.8%
Whole state:
11.8%
Residents with income below 50% of the poverty level in 2022:
This zip code:
5.0%
Whole state:
6.1%
Median number of rooms in houses and condos:
Here:
6.6
State:
6.8
Median number of rooms in apartments:
Here:
5.0
State:
4.3
Notable locations in this zip code not listed on our city pages
Notable locations in zip code 16669: Pennsylvania State University C E Camp (A), Pennsylvania State University Forestry Camp (B), Owl Gap CCC Camp (C), Stone Creek Valley Volunteer Fire Company 19 (D), Shavers Creek Volunteer Fire Company 11 (E), Petersburg Volunteer Fire Company 4 (F). Display/hide their locations on the map
Cemeteries: Wilson Cemetery (1), Bennett Cemetery (2), Reed Cemetery (3), Weyer Cemetery (4), Massey Cemetery (5), Rudy Cemetery (6), Mooresville Cemetery (7). Display/hide their locations on the map
Lakes and reservoirs: Swigart Pond (A), White Deer Lake (B), Beaver Pond (C), Hutchinson Pond (D), University Watershed Reservoir Project (E), Lake Perez (F). Display/hide their locations on the map
Streams, rivers, and creeks: Roaring Run (A), Nelson Run (B), Henrys Run (C), Gregory Run (D), Greenlee Run (E), Globe Run (F), Garner Run (G), Croyle Run (H), Shingletown Branch (I). Display/hide their locations on the map
Parks in zip code 16669 include: Detweiler Run Natural Area (1), Pennsylvania State University Recreation Are (2), Stone Valley Recreation Area (3), Whipple Dam State Park (4). Display/hide their locations on the map
In group quarters: 10 (-1 institutionalized population)
Size of family households: 283 2-persons, 105 3-persons, 140 4-persons, 42 5-persons, 16 6-persons, 8 7-or-more-persons
Size of nonfamily households: 227 1-person, 43 2-persons, 2 3-persons
350 married couples with children.
138 single-parent households (58 men, 80 women).
97.4% of residents of 16669 zip code speak English at home.
0.8% of residents speak Spanish at home (100% very well).
1.0% of residents speak other Indo-European language at home (90% very well, 10% well).
0.2% of residents speak Asian or Pacific Island language at home (25% very well, 75% well).
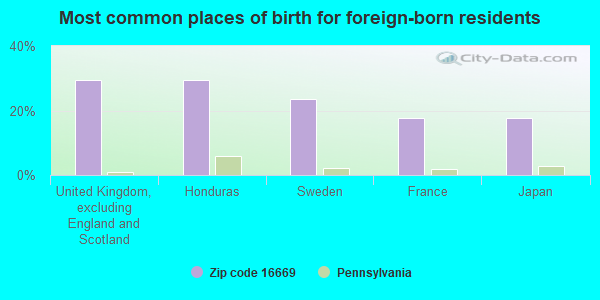
Foreign born population: 17 (0.8%) (82.9% of them are naturalized citizens)
This zip code:
0.8%
Whole state:
7.5%
29%United Kingdom, excluding England and Scotland
29%Honduras
24%Sweden
18%France
18%Japan
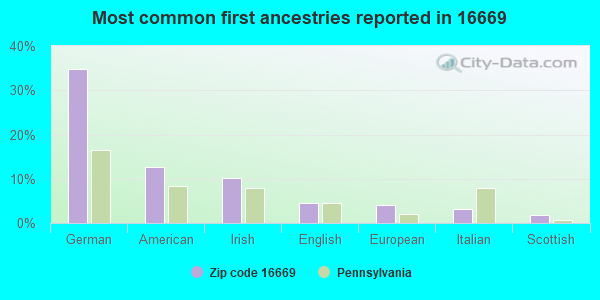
35%German
13%American
10%Irish
5%English
4%European
3%Italian
2%Scottish
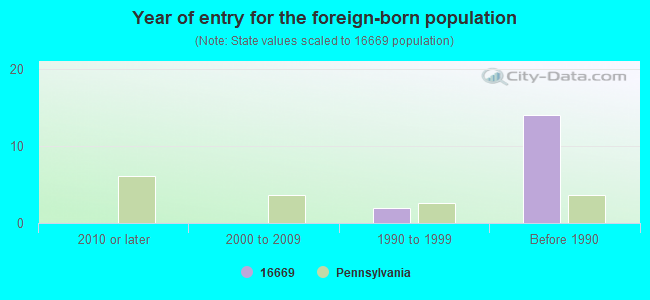
Year of entry for the foreign-born population
02010 or later
02000 to 2009
21990 to 1999
14Before 1990
Facilities with environmental interests located in this zip code:
ADVANCED AUTO REFINISHING (RR 2 BOX 416 in PETERSBURG, PA)
STATE MASTER (Pennsylvania database) - RCRIS-PAR000504969, HAZARDOUS WASTE PROGRAM Conditionally Exempt Small Quantity Generators, less than 100 kg/month of hazardous waste (Resource Conservation and Recovery Act (tracking hazardous waste)) - notification Organizations: BUTLER GLENN (CONTACT/OWNER)
Housing units lacking complete plumbing facilities: 11.8% Housing units lacking complete kitchen facilities: 11.7%
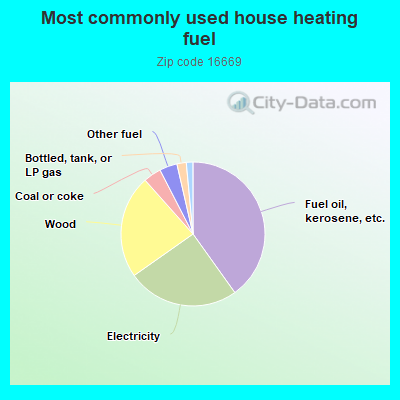
40.3%Fuel oil, kerosene, etc.
25.2%Electricity
23.3%Wood
4.0%Coal or coke
4.0%Other fuel
2.1%Bottled, tank, or LP gas
0.8%No fuel used
0.7%Utility gas
Population in 1990: 2,175. Population change in the 1990s: +34 (+1.6%).
Place of birth for U.S.-born residents:
This state: 1,875
Northeast: 72
Midwest: 46
South: 89
West: 67
76% of the 16669 zip code residents lived in the same house 5 years ago. Out of people who lived in different houses, 48% lived in this county. Out of people who lived in different counties, 50% lived in Pennsylvania.
98% of the 16669 zip code residents lived in the same house 1 year ago. Out of people who lived in different houses, 25% moved from this county. Out of people who lived in different houses, 86% moved from different county within same state.
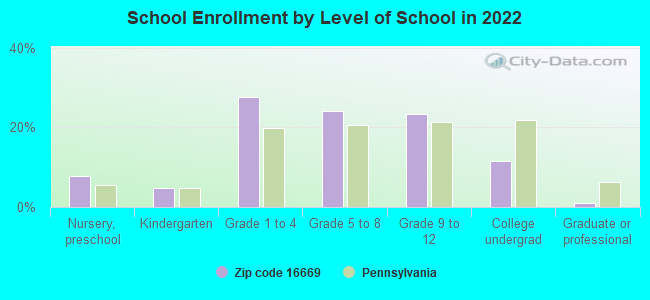
Private vs. public school enrollment:
Students in private schools in grades 1 to 8 (elementary and middle school): 21
Here:
7.8%
Pennsylvania:
15.7%
Students in private schools in grades 9 to 12 (high school): 6
Here:
4.9%
Pennsylvania:
13.4%
Students in private undergraduate colleges: 17
Here:
29.0%
Pennsylvania:
39.8%
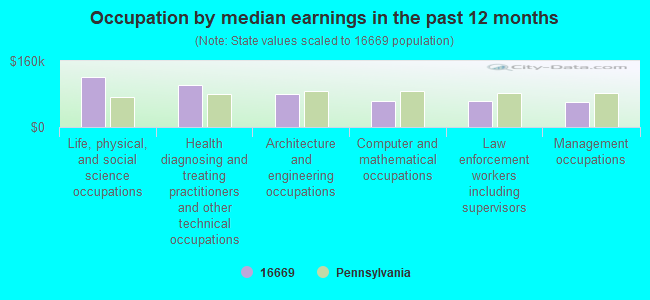
Occupation by median earnings in the past 12 months ($)
120,287Life, physical, and social science occupations
102,561Health diagnosing and treating practitioners and other technical occupations
80,732Architecture and engineering occupations
63,255Computer and mathematical occupations
62,715Law enforcement workers including supervisors
60,647Management occupations
Top industries in this zip code by the number of employees in 2005:
Construction: Plumbing, Heating, and Air-Conditioning Contractors (20-49 employees: 1 establishment)
Professional, Scientific, and Technical Services: Direct Mail Advertising (10-19: 1)
Accommodation and Food Services: Recreational and Vacation Camps (except Campgrounds) (5-9: 1, 1-4: 1)
Other Services (except Public Administration): Civic and Social Organizations (5-9: 1, 1-4: 1)
Construction: Site Preparation Contractors (5-9: 1)
Administrative and Support and Waste Management and Remediation Services: Solid Waste Collection (5-9: 1)
Health Care and Social Assistance: Services for the Elderly and Persons with Disabilities (1-4: 1)
Construction: New Housing Operative Builders (1-4: 1)
Fatal accident statistics in 2014:
Fatal accident count: 2
Vehicles involved in fatal accidents: 2
Fatal accidents caused by drunken drivers: 1
Fatalities: 2
Persons involved in fatal accidents: 2
Pedestrians involved in fatal accidents: 0
Fatal accident statistics in 2013:
Fatal accident count: 1
Vehicles involved in fatal accidents: 3
Fatal accidents caused by drunken drivers: 0
Fatalities: 1
Persons involved in fatal accidents: 3
Pedestrians involved in fatal accidents: 0
2005 - 2018 National Fire Incident Reporting System (NFIRS) incidents
Based on the data from the years 2005 - 2018 the average number of fire incidents per year is 12. The highest number of fire incidents - 27 took place in 2016, and the least - 4 in 2015. The data has an increasing trend.
When looking into fire subcategories, the most incidents belonged to: Structure Fires (57.2%), and Outside Fires (28.3%).
Fire incident types reported to NFIRS in Zip Code 16669


 Nearest zip codes: 16868, 16865, 16801, 16803, 16652, 16802.
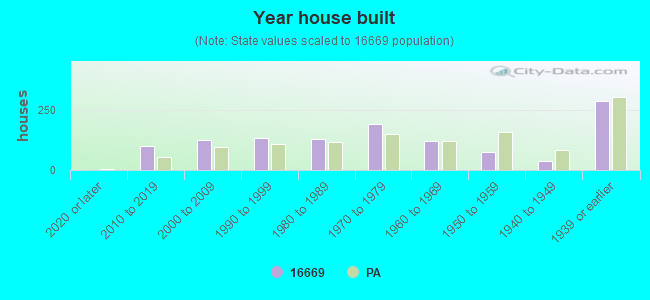


 Based on the data from the years 2005 - 2018 the average number of fire incidents per year is 12. The highest number of fire incidents - 27 took place in 2016, and the least - 4 in 2015. The data has an increasing trend.
 When looking into fire subcategories, the most incidents belonged to: Structure Fires (57.2%), and Outside Fires (28.3%).