Estimated zip code population in 2022: 3,683 Zip code population in 2010: 3,868 Zip code population in 2000: 3,795
Houses and condos: 1,700 Renter-occupied apartments: 344
% of renters here:
24%
State:
31%
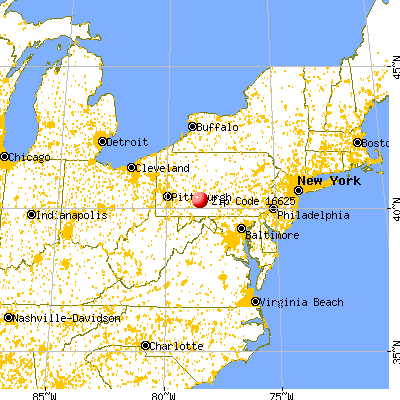
March 2022 cost of living index in zip code 16625: 91.5 (less than average, U.S. average is 100)
Land area: 32.1 sq. mi. Water area: 0.0 sq. mi.
Population density: 115 people per square mile
(very low).
OSM Map
General Map
Google Map
MSN Map
OSM Map
General Map
Google Map
MSN Map
OSM Map
General Map
Google Map
MSN Map
OSM Map
General Map
Google Map
MSN Map
Please wait while loading the map...
Real estate property taxes paid for housing units in 2022:
This zip code:
0.9% ($1,345)
Pennsylvania:
1.3% ($3,094)
Median real estate property taxes paid for housing units with mortgages in 2022: $1,369 (0.8%) Median real estate property taxes paid for housing units with no mortgage in 2022: $1,329 (1.0%)
Averages for the 2020 tax year for zip code 16625, filed in 2021:
Average Adjusted Gross Income (AGI) in 2020: $45,265 (Individual Income Tax Returns)
Here:
$45,265
State:
$75,707
Salary/wage: $39,230 (reported on 82.6% of returns)
Here:
$39,230
State:
$62,806
(% of AGI for various income ranges: 1060.7% for AGIs below $25k, 3261.8% for AGIs $25k-50k, 6449.4% for AGIs $50k-75k, 8300.9% for AGIs $75k-100k, 16081.1% for AGIs $100k-200k)
Taxable interest for individuals: $857 (reported on 23.0% of returns)
This zip code:
$857
Pennsylvania:
$1,633
(% of AGI for various income ranges: 14.4% for AGIs below $25k, 14.5% for AGIs $25k-50k, 36.5% for AGIs $50k-75k, 50.0% for AGIs $75k-100k, 88.9% for AGIs $100k-200k)
Ordinary dividends: $2,830 (reported on 12.4% of returns)
Here:
$2,830
State:
$7,382
(% of AGI for various income ranges: 6.3% for AGIs below $25k, 14.8% for AGIs $25k-50k, 81.2% for AGIs $50k-75k, 23.6% for AGIs $75k-100k, 351.1% for AGIs $100k-200k)
Net capital gain/loss in AGI: +$3,707 (reported on 8.7% of returns)
Here:
+$3,707
State:
+$23,522
(% of AGI for various income ranges: 8.5% for AGIs $25k-50k, 32.9% for AGIs $50k-75k, 39.1% for AGIs $75k-100k, 436.7% for AGIs $100k-200k)
Profit/loss from business: +$11,883 (reported on 11.2% of returns)
Here:
+$11,883
State:
+$16,274
(% of AGI for various income ranges: 81.6% for AGIs below $25k, 137.5% for AGIs $25k-50k, 109.4% for AGIs $50k-75k, 956.4% for AGIs $75k-100k)
Taxable individual retirement arrangement distribution: $11,093 (reported on 9.3% of returns)
16625:
$11,093
Pennsylvania:
$18,583
(% of AGI for various income ranges: 70.9% for AGIs below $25k, 69.8% for AGIs $25k-50k, 299.4% for AGIs $50k-75k, 634.4% for AGIs $100k-200k)
Earned income credit: $2,333 (reported on 18.6% of returns)
Here:
$2,333
State:
$2,100
(% of AGI for various income ranges: 91.2% for AGIs below $25k, 77.0% for AGIs $25k-50k)
Percentage of individuals using paid preparers for their 2020 taxes: 93.8%
Here:
94%
State:
92%
(% for various income ranges: 93.3% for AGIs below $25k, 93.8% for AGIs $25k-50k, 92.0% for AGIs $50k-75k, 100.0% for AGIs $75k-100k, 92.9% for AGIs $100k-200k)
Averages for the 2012 tax year for zip code 16625, filed in 2013:
Average Adjusted Gross Income (AGI) in 2012: $36,734 (Individual Income Tax Returns)
Here:
$36,734
State:
$61,346
Salary/wage: $32,448 (reported on 83.9% of returns)
Here:
$32,448
State:
$51,902
(% of AGI for various income ranges: 70.6% for AGIs below $25k, 80.7% for AGIs $25k-50k, 80.4% for AGIs $50k-75k, 78.6% for AGIs $75k-100k, 56.9% for AGIs $100k-200k)
Taxable interest for individuals: $707 (reported on 26.5% of returns)
This zip code:
$707
Pennsylvania:
$1,588
(% of AGI for various income ranges: 1.1% for AGIs below $25k, 0.6% for AGIs $25k-50k, 0.2% for AGIs $50k-75k, 0.4% for AGIs $75k-100k, 0.4% for AGIs $100k-200k)
Ordinary dividends: $1,446 (reported on 15.5% of returns)
Here:
$1,446
State:
$5,827
(% of AGI for various income ranges: 0.9% for AGIs below $25k, 0.4% for AGIs $25k-50k, 0.4% for AGIs $50k-75k, 1.4% for AGIs $100k-200k)
Net capital gain/loss in AGI: +$2,800 (reported on 9.0% of returns)
Here:
+$2,800
State:
+$14,495
(% of AGI for various income ranges: 0.1% for AGIs $25k-50k, 3.5% for AGIs $100k-200k)
Profit/loss from business: +$11,747 (reported on 12.3% of returns)
Here:
+$11,747
State:
+$16,268
(% of AGI for various income ranges: 6.9% for AGIs below $25k, 3.2% for AGIs $25k-50k, 1.9% for AGIs $50k-75k, 10.5% for AGIs $75k-100k)
Taxable individual retirement arrangement distribution: $8,693 (reported on 9.0% of returns)
16625:
$8,693
Pennsylvania:
$14,550
(% of AGI for various income ranges: 3.9% for AGIs below $25k, 1.7% for AGIs $25k-50k, 4.9% for AGIs $50k-75k)
Total itemized deductions: $17,453 (22% of AGI, reported on 11.0% of returns)
Here:
$17,453
State:
$23,538
Here:
21.6% of AGI
State:
18.4% of AGI
(% of AGI for various income ranges: 5.9% for AGIs $25k-50k, 3.9% for AGIs $50k-75k, 6.1% for AGIs $75k-100k, 9.1% for AGIs $100k-200k)
Charity contributions: $3,717 (reported on 7.7% of returns)
Here:
$3,717
State:
$4,025
(% of AGI for various income ranges: 0.8% for AGIs $25k-50k, 0.3% for AGIs $50k-75k, 0.8% for AGIs $75k-100k, 2.0% for AGIs $100k-200k)
Taxes paid: $4,888 (reported on 11.0% of returns)
16625:
$4,888
State:
$9,982
(% of AGI for various income ranges: 1.1% for AGIs $25k-50k, 1.0% for AGIs $50k-75k, 1.8% for AGIs $75k-100k, 3.4% for AGIs $100k-200k)
Earned income credit: $2,128 (reported on 23.2% of returns)
Here:
$2,128
State:
$2,106
(% of AGI for various income ranges: 6.4% for AGIs below $25k, 1.3% for AGIs $25k-50k)
Percentage of individuals using paid preparers for their 2012 taxes: 54.2%
Here:
54%
State:
53%
(% for various income ranges: 49.3% for AGIs below $25k, 57.8% for AGIs $25k-50k, 55.0% for AGIs $50k-75k, 60.0% for AGIs $75k-100k, 71.4% for AGIs $100k-200k)
Averages for the 2004 tax year for zip code 16625, filed in 2005:
Average Adjusted Gross Income (AGI) in 2004: $29,512 (Individual Income Tax Returns)
Here:
$29,512
State:
$48,049
Salary/wage: $27,525 (reported on 85.1% of returns)
Here:
$27,525
State:
$42,646
(% of AGI for various income ranges: 109.6% for AGIs below $10k, 75.1% for AGIs $10k-25k, 83.8% for AGIs $25k-50k, 84.9% for AGIs $50k-75k, 79.6% for AGIs $75k-100k, 53.2% for AGIs over 100k)
Taxable interest for individuals: $1,137 (reported on 34.8% of returns)
This zip code:
$1,137
Pennsylvania:
$1,657
(% of AGI for various income ranges: 3.5% for AGIs below $10k, 2.4% for AGIs $10k-25k, 1.5% for AGIs $25k-50k, 0.8% for AGIs $50k-75k, 0.4% for AGIs $75k-100k, 0.6% for AGIs over 100k)
Taxable dividends: $1,730 (reported on 17.6% of returns)
Here:
$1,730
State:
$3,566
(% of AGI for various income ranges: 2.1% for AGIs below $10k, 0.9% for AGIs $10k-25k, 0.6% for AGIs $25k-50k, 0.7% for AGIs $50k-75k, 0.6% for AGIs $75k-100k, 3.2% for AGIs over 100k)
Net capital gain/loss: +$3,632 (reported on 10.2% of returns)
Here:
+$3,632
State:
+$9,716
(% of AGI for various income ranges: 1.0% for AGIs below $10k, 1.0% for AGIs $10k-25k, 0.1% for AGIs $25k-50k, 0.4% for AGIs $50k-75k, 1.3% for AGIs $75k-100k, 6.9% for AGIs over 100k)
Profit/loss from business: +$6,927 (reported on 14.6% of returns)
Here:
+$6,927
State:
+$14,267
(% of AGI for various income ranges: 3.1% for AGIs below $10k, 6.5% for AGIs $10k-25k, 3.3% for AGIs $25k-50k, 3.5% for AGIs $50k-75k, 2.5% for AGIs $75k-100k)
IRA payment deduction: $2,176 (reported on 2.1% of returns)
16625:
$2,176
Pennsylvania:
$2,903
Total itemized deductions: $14,736 (23% of AGI, reported on 10.2% of returns)
Here:
$14,736
State:
$18,804
Here:
23.0% of AGI
State:
19.5% of AGI
(% of AGI for various income ranges: 2.6% for AGIs $10k-25k, 5.1% for AGIs $25k-50k, 5.4% for AGIs $50k-75k, 5.6% for AGIs $75k-100k, 8.9% for AGIs over 100k)
Charity contributions deductions: $3,100 (4% of AGI, reported on 7.5% of returns)
Here:
$3,100
State:
$3,337
Here:
4.4% of AGI
State:
3.3% of AGI
(% of AGI for various income ranges: 2.6% for AGIs below $10k, 0.7% for AGIs $25k-50k, 0.5% for AGIs $50k-75k, 1.1% for AGIs $75k-100k, 2.2% for AGIs over 100k)
Total tax: $3,421 (reported on 69.0% of returns)
16625:
$3,421
State:
$8,008
(% of AGI for various income ranges: 3.3% for AGIs below $10k, 4.4% for AGIs $10k-25k, 6.2% for AGIs $25k-50k, 8.6% for AGIs $50k-75k, 11.2% for AGIs $75k-100k, 15.9% for AGIs over 100k)
Earned income credit: $1,733 (reported on 23.0% of returns)
Here:
$1,733
State:
$1,643
Percentage of individuals using paid preparers for their 2004 taxes: 57.5%
Here:
58%
State:
56%
(% for various income ranges: 53.7% for AGIs below $10k, 56.2% for AGIs $10k-25k, 59.3% for AGIs $25k-50k, 61.8% for AGIs $50k-75k, 64.4% for AGIs $75k-100k, 63.6% for AGIs over 100k)
Household received Food Stamps/SNAP in the past 12 months: 161 Household did not receive Food Stamps/SNAP in the past 12 months: 1,291
Women who had a birth in the past 12 months: 26 (28 now married, 0 unmarried) Women who did not have a birth in the past 12 months: 704 (316 now married, 386 unmarried)
Housing units in zip code 16625 with a mortgage: 433 (41 second mortgage, 2 home equity loan, 39 both second mortgage and home equity loan) Houses without a mortgage: 37
Median monthly owner costs for units with a mortgage: $953 Median monthly owner costs for units without a mortgage: $423
Residents with income below the poverty level in 2022:
This zip code:
14.2%
Whole state:
11.8%
Residents with income below 50% of the poverty level in 2022:
This zip code:
9.0%
Whole state:
6.1%
Median number of rooms in houses and condos:
Here:
6.1
State:
6.8
Median number of rooms in apartments:
Here:
4.9
State:
4.3
Notable locations in this zip code not listed on our city pages
Notable locations in zip code 16625: Blue Knob Recreation Area (A), Camp Number 2 (B), Claysburg Volunteer Fire Department (C). Display/hide their locations on the map
Churches in zip code 16625 include: Upper Claar Church (A), Lower Claar Church (B), Saint Annes Church (C), Emmanuel Church (D), Ebeneza Church (E). Display/hide their locations on the map
Streams, rivers, and creeks: South Poplar Run (A), Carson Run (B), Boiling Spring Run (C), Pine Run (D), Big Lick Branch (E), Beaverdam Creek (F). Display/hide their locations on the map
In group quarters: 20 (-1 institutionalized population)
Size of family households: 509 2-persons, 155 3-persons, 156 4-persons, 41 5-persons, 11 6-persons, 60 7-or-more-persons
Size of nonfamily households: 415 1-person, 111 2-persons, 1 3-persons
541 married couples with children.
78 single-parent households (29 men, 49 women).
99.3% of residents of 16625 zip code speak English at home.
0.3% of residents speak Spanish at home (22% very well, 78% well).
Foreign born population: 3 (0.1%) (67.6% of them are naturalized citizens)
This zip code:
0.1%
Whole state:
7.5%
33%Dominica
33%Guatemala
59%German
14%American
3%Scotch-Irish
3%English
3%European
2%Irish
2%Scottish
Year of entry for the foreign-born population
02010 or later
02000 to 2009
11990 to 1999
19Before 1990
Facilities with environmental interests located in this zip code:
AP GREEN REFRACTORIES SPROUL PLT (JCT OF OLD RT 220 & STATE ROAD 3006 in CLAYSBURG, PA)
AIR MINOR (AIRS/AFS) STATE MASTER (Pennsylvania database) - PWSID-4070041, DRINKING WATER PROGRAM, AFS-43-1680037-2, AIR PROGRAM, PWSID-4070836, DRINKING WATER PROGRAM, RCRIS-PAD004327094, HAZARDOUS WASTE PROGRAM Business SIC classification: CLAY REFRACTORIES; NONCLAY REFRACTORIES Organizations: AP GREEN REFRACTORIES, INC. (CONTACT/OWNER)
Alternative names: AP GREEN INDUSTRIES INCORPORATED SPROUL PLANT
AMY TREESE (RR 1 in CLAYSBURG, PA)
National Pollutant Discharge Elimination System NON-MAJOR (Tracking pollutant discharge elimination systems) - permit Business SIC classification: OPERATORS OF DWELLINGS OTHER THAN APARTMENT BUILDINGS Alternative names: TREESE, AMY
B & B PERFORMANCE (RD# 2, BOX 1357 in CLAYSBURG, PA)
AIR MINOR (AIRS/AFS) Business SIC classification: AUTOMOTIVE REPAIR SHOPS
B & S USED CARDS (RD #2 in CLAYSBURG, PA)
Small Quantity Generators, between 100 kg and 1000 kg of hazardous waste/month (Resource Conservation and Recovery Act (tracking hazardous waste)) - notification Organizations: OPERNAME (CONTACT/OPERATOR)
, WEYANDT, CHARLES (CONTACT/OWNER)
Housing units lacking complete plumbing facilities: 2.3% Housing units lacking complete kitchen facilities: 2.5%
54.6%Fuel oil, kerosene, etc.
19.6%Electricity
12.3%Utility gas
6.1%Wood
4.5%Bottled, tank, or LP gas
1.9%Coal or coke
1.1%Other fuel
Population in 1990: 3,890.
Place of birth for U.S.-born residents:
This state: 3,306
Northeast: 78
Midwest: 25
South: 157
West: 63
71% of the 16625 zip code residents lived in the same house 5 years ago. Out of people who lived in different houses, 58% lived in this county. Out of people who lived in different counties, 50% lived in Pennsylvania.
97% of the 16625 zip code residents lived in the same house 1 year ago. Out of people who lived in different houses, 21% moved from this county. Out of people who lived in different houses, 58% moved from different county within same state. Out of people who lived in different houses, 19% moved from different state. Out of people who lived in different houses, 11% moved from abroad.
Private vs. public school enrollment:
Students in private schools in grades 1 to 8 (elementary and middle school): 19
Here:
5.7%
Pennsylvania:
15.7%
Students in private schools in grades 9 to 12 (high school): 21
Here:
8.9%
Pennsylvania:
13.4%
Students in private undergraduate colleges: 9
Here:
12.2%
Pennsylvania:
39.8%
Occupation by median earnings in the past 12 months ($)
64,891Management occupations
63,385Health diagnosing and treating practitioners and other technical occupations
59,198Installation, maintenance, and repair occupations
58,216Computer and mathematical occupations
55,825Building and grounds cleaning and maintenance occupations
54,590Transportation occupations
Companies with federal contracts located in this zip code:
NEWS PRINTING COMPANY, INC. (OLD RT 220 in CLAYSBURG, PA; small business) 420 employees, $42000000 revenue. : $2,491,825 in 29 contractsfrom 2002 to 2006
Contracts for Print/Binding Services, Reproduction Services, Printing, Duplicating, and Bookbinding Equipment, Books and Pamphlets, and moreby Patent and Trademark Office/Under Secretary for Intellectual Property, Department of Veterans Affairs, National Institute of Standards and Technology, Navy, and others Signed by year:2000: $0; 2001: $0; 2002: $36,000; 2003: $1,088,087; 2004: $1,354,983; 2005: $12,755; 2006: $0.
Biggest contracts:
$1,346,600 with Patent and Trademark Office/Under Secretary for Intellectual Property for Print/Binding Services. Signed on 2004-04-19. Completion date: 2005-06-30.
$1,088,087, same as above.Signed on 2003-06-15. Completion date: 2004-06-15.
$36,000 with Department of Veterans Affairs for Reproduction Services. Signed on 2002-04-15. Completion date: 2002-09-15.
$8,383 with National Institute of Standards and Technology for Printing, Duplicating, and Bookbinding Equipment. Signed on 2004-05-27. Completion date: 2004-06-18.
Top industries in this zip code by the number of employees in 2005:
Accommodation and Food Services: Hotels (except Casino Hotels) and Motels (250-499 employees: 1 establishment)
Health Care and Social Assistance: Ambulance Services (20-49: 1)
People in group quarters in 2010:
20 people in group homes intended for adults
People in group quarters in 2000:
21 people in other noninstitutional group quarters
Fatal accident statistics in 2012:
Fatal accident count: 2
Vehicles involved in fatal accidents: 2
Fatal accidents caused by drunken drivers: 1
Fatalities: 2
Persons involved in fatal accidents: 3
Pedestrians involved in fatal accidents: 0
Fatal accident statistics in 2011:
Fatal accident count: 1
Vehicles involved in fatal accidents: 1
Fatal accidents caused by drunken drivers: 1
Fatalities: 1
Persons involved in fatal accidents: 1
Pedestrians involved in fatal accidents: 0
Home Mortgage Disclosure Act Aggregated Statistics For Year 2009 (Based on 2 partial tracts)
A) FHA, FSA/RHS & VA Home Purchase Loans
B) Conventional Home Purchase Loans
C) Refinancings
D) Home Improvement Loans
F) Non-occupant Loans on < 5 Family Dwellings (A B C & D)
G) Loans On Manufactured Home Dwelling (A B C & D)
Number
Average Value
Number
Average Value
Number
Average Value
Number
Average Value
Number
Average Value
Number
Average Value
LOANS ORIGINATED
11
$84,800
17
$111,596
26
$102,982
9
$10,802
7
$135,697
4
$43,355
APPLICATIONS APPROVED, NOT ACCEPTED
0
$0
0
$0
0
$0
0
$0
0
$0
0
$0
APPLICATIONS DENIED
0
$0
4
$40,728
24
$80,799
12
$35,692
0
$0
1
$105,100
APPLICATIONS WITHDRAWN
1
$106,420
0
$0
11
$78,470
4
$48,610
3
$50,363
0
$0
FILES CLOSED FOR INCOMPLETENESS
0
$0
0
$0
4
$69,302
1
$13,140
0
$0
0
$0
Aggregated Statistics For Year 2008 (Based on 2 partial tracts)
A) FHA, FSA/RHS & VA Home Purchase Loans
B) Conventional Home Purchase Loans
C) Refinancings
D) Home Improvement Loans
E) Loans on Dwellings For 5+ Families
F) Non-occupant Loans on < 5 Family Dwellings (A B C & D)
G) Loans On Manufactured Home Dwelling (A B C & D)
Number
Average Value
Number
Average Value
Number
Average Value
Number
Average Value
Number
Average Value
Number
Average Value
Number
Average Value
LOANS ORIGINATED
5
$111,672
16
$100,916
34
$95,057
20
$27,787
1
$1,642,250
12
$103,571
8
$29,889
APPLICATIONS APPROVED, NOT ACCEPTED
1
$161,600
0
$0
1
$32,840
0
$0
0
$0
0
$0
0
$0
APPLICATIONS DENIED
3
$32,407
3
$28,903
22
$77,693
13
$24,558
0
$0
3
$50,363
3
$31,530
APPLICATIONS WITHDRAWN
0
$0
0
$0
11
$96,744
4
$17,738
0
$0
1
$367,860
0
$0
FILES CLOSED FOR INCOMPLETENESS
0
$0
0
$0
3
$179,990
0
$0
0
$0
1
$459,830
0
$0
Aggregated Statistics For Year 2007 (Based on 2 partial tracts)
A) FHA, FSA/RHS & VA Home Purchase Loans
B) Conventional Home Purchase Loans
C) Refinancings
D) Home Improvement Loans
F) Non-occupant Loans on < 5 Family Dwellings (A B C & D)
G) Loans On Manufactured Home Dwelling (A B C & D)
Number
Average Value
Number
Average Value
Number
Average Value
Number
Average Value
Number
Average Value
Number
Average Value
LOANS ORIGINATED
7
$59,871
16
$66,839
54
$77,757
34
$30,604
4
$48,282
12
$51,895
APPLICATIONS APPROVED, NOT ACCEPTED
0
$0
0
$0
8
$72,916
1
$7,880
0
$0
1
$7,880
APPLICATIONS DENIED
1
$130,070
7
$53,490
50
$84,924
33
$43,037
3
$65,253
16
$58,054
APPLICATIONS WITHDRAWN
0
$0
1
$39,410
9
$130,067
0
$0
0
$0
0
$0
FILES CLOSED FOR INCOMPLETENESS
0
$0
1
$246,990
1
$131,380
0
$0
0
$0
0
$0
Aggregated Statistics For Year 2006 (Based on 2 partial tracts)
A) FHA, FSA/RHS & VA Home Purchase Loans
B) Conventional Home Purchase Loans
C) Refinancings
D) Home Improvement Loans
F) Non-occupant Loans on < 5 Family Dwellings (A B C & D)
G) Loans On Manufactured Home Dwelling (A B C & D)
Number
Average Value
Number
Average Value
Number
Average Value
Number
Average Value
Number
Average Value
Number
Average Value
LOANS ORIGINATED
7
$84,646
42
$84,646
64
$64,622
46
$29,218
11
$50,402
18
$73,573
APPLICATIONS APPROVED, NOT ACCEPTED
0
$0
7
$52,927
16
$69,631
0
$0
1
$34,160
3
$65,253
APPLICATIONS DENIED
0
$0
8
$59,285
76
$72,276
30
$45,501
3
$52,990
17
$46,833
APPLICATIONS WITHDRAWN
0
$0
7
$71,509
21
$59,059
4
$43,355
4
$34,488
4
$30,875
FILES CLOSED FOR INCOMPLETENESS
0
$0
0
$0
5
$91,704
0
$0
0
$0
0
$0
Aggregated Statistics For Year 2005 (Based on 2 partial tracts)
A) FHA, FSA/RHS & VA Home Purchase Loans
B) Conventional Home Purchase Loans
C) Refinancings
D) Home Improvement Loans
F) Non-occupant Loans on < 5 Family Dwellings (A B C & D)
G) Loans On Manufactured Home Dwelling (A B C & D)
Number
Average Value
Number
Average Value
Number
Average Value
Number
Average Value
Number
Average Value
Number
Average Value
LOANS ORIGINATED
1
$151,090
43
$73,756
68
$65,671
39
$20,381
12
$80,142
16
$41,385
APPLICATIONS APPROVED, NOT ACCEPTED
0
$0
5
$111,936
17
$54,329
3
$20,583
0
$0
3
$48,173
APPLICATIONS DENIED
0
$0
16
$61,420
88
$77,992
37
$25,353
9
$48,172
26
$40,526
APPLICATIONS WITHDRAWN
0
$0
8
$100,341
26
$83,982
1
$32,840
3
$66,567
3
$56,057
FILES CLOSED FOR INCOMPLETENESS
0
$0
3
$86,710
8
$98,535
0
$0
0
$0
1
$68,320
Aggregated Statistics For Year 2004 (Based on 2 partial tracts)
A) FHA, FSA/RHS & VA Home Purchase Loans
B) Conventional Home Purchase Loans
C) Refinancings
D) Home Improvement Loans
F) Non-occupant Loans on < 5 Family Dwellings (A B C & D)
G) Loans On Manufactured Home Dwelling (A B C & D)
Number
Average Value
Number
Average Value
Number
Average Value
Number
Average Value
Number
Average Value
Number
Average Value
LOANS ORIGINATED
1
$98,530
33
$63,062
97
$74,711
50
$22,387
4
$114,958
26
$50,632
APPLICATIONS APPROVED, NOT ACCEPTED
0
$0
9
$63,500
16
$75,708
4
$28,248
3
$35,910
1
$105,100
APPLICATIONS DENIED
1
$65,690
9
$65,836
62
$72,810
26
$22,941
5
$80,930
12
$36,239
APPLICATIONS WITHDRAWN
0
$0
7
$76,576
43
$90,500
7
$18,581
0
$0
4
$41,712
FILES CLOSED FOR INCOMPLETENESS
0
$0
1
$98,530
11
$84,800
0
$0
0
$0
0
$0
Aggregated Statistics For Year 2003 (Based on 2 partial tracts)
A) FHA, FSA/RHS & VA Home Purchase Loans
B) Conventional Home Purchase Loans
C) Refinancings
D) Home Improvement Loans
F) Non-occupant Loans on < 5 Family Dwellings (A B C & D)
Number
Average Value
Number
Average Value
Number
Average Value
Number
Average Value
Number
Average Value
LOANS ORIGINATED
7
$52,364
39
$60,468
145
$65,572
37
$16,476
9
$49,632
APPLICATIONS APPROVED, NOT ACCEPTED
0
$0
5
$56,230
16
$74,394
4
$93,608
1
$115,610
APPLICATIONS DENIED
3
$79,703
16
$43,930
80
$72,193
24
$29,232
3
$36,350
APPLICATIONS WITHDRAWN
0
$0
1
$85,400
29
$72,712
0
$0
0
$0
FILES CLOSED FOR INCOMPLETENESS
0
$0
0
$0
3
$86,710
0
$0
0
$0
Aggregated Statistics For Year 2002 (Based on 2 partial tracts)
A) FHA, FSA/RHS & VA Home Purchase Loans
B) Conventional Home Purchase Loans
C) Refinancings
D) Home Improvement Loans
E) Loans on Dwellings For 5+ Families
F) Non-occupant Loans on < 5 Family Dwellings (A B C & D)
Number
Average Value
Number
Average Value
Number
Average Value
Number
Average Value
Number
Average Value
Number
Average Value
LOANS ORIGINATED
7
$60,810
34
$58,889
91
$53,895
34
$18,045
1
$262,760
11
$31,054
APPLICATIONS APPROVED, NOT ACCEPTED
0
$0
7
$44,294
21
$73,573
1
$5,260
0
$0
0
$0
APPLICATIONS DENIED
0
$0
13
$53,664
60
$65,756
14
$13,795
0
$0
3
$31,530
APPLICATIONS WITHDRAWN
0
$0
7
$45,420
28
$61,232
5
$23,648
0
$0
1
$137,950
FILES CLOSED FOR INCOMPLETENESS
0
$0
0
$0
3
$73,133
0
$0
0
$0
0
$0
Aggregated Statistics For Year 2001 (Based on 2 partial tracts)
A) FHA, FSA/RHS & VA Home Purchase Loans
B) Conventional Home Purchase Loans
C) Refinancings
D) Home Improvement Loans
F) Non-occupant Loans on < 5 Family Dwellings (A B C & D)
Number
Average Value
Number
Average Value
Number
Average Value
Number
Average Value
Number
Average Value
LOANS ORIGINATED
7
$62,687
42
$60,560
81
$54,288
46
$13,109
13
$41,941
APPLICATIONS APPROVED, NOT ACCEPTED
1
$111,670
12
$45,107
16
$72,669
8
$17,080
0
$0
APPLICATIONS DENIED
0
$0
16
$50,089
59
$52,084
28
$13,326
4
$16,750
APPLICATIONS WITHDRAWN
0
$0
1
$31,530
41
$57,807
9
$12,117
0
$0
FILES CLOSED FOR INCOMPLETENESS
0
$0
0
$0
8
$70,452
0
$0
1
$19,710
Aggregated Statistics For Year 2000 (Based on 2 partial tracts)
A) FHA, FSA/RHS & VA Home Purchase Loans
B) Conventional Home Purchase Loans
C) Refinancings
D) Home Improvement Loans
F) Non-occupant Loans on < 5 Family Dwellings (A B C & D)
Number
Average Value
Number
Average Value
Number
Average Value
Number
Average Value
Number
Average Value
LOANS ORIGINATED
3
$52,553
62
$56,366
60
$58,902
54
$15,790
7
$26,839
APPLICATIONS APPROVED, NOT ACCEPTED
1
$65,690
14
$33,971
16
$53,127
9
$31,677
0
$0
APPLICATIONS DENIED
0
$0
45
$29,663
59
$55,002
32
$8,211
4
$42,370
APPLICATIONS WITHDRAWN
0
$0
3
$35,033
29
$41,589
11
$12,541
0
$0
FILES CLOSED FOR INCOMPLETENESS
0
$0
1
$88,020
4
$65,362
1
$26,280
0
$0
Aggregated Statistics For Year 1999 (Based on 1 partial tract)
A) FHA, FSA/RHS & VA Home Purchase Loans
B) Conventional Home Purchase Loans
C) Refinancings
D) Home Improvement Loans
F) Non-occupant Loans on < 5 Family Dwellings (A B C & D)
Detailed PMIC statistics for the following Tracts:0116.00
2007 - 2018 National Fire Incident Reporting System (NFIRS) incidents
Based on the data from the years 2007 - 2018 the average number of fire incidents per year is 14. The highest number of fire incidents - 58 took place in 2017, and the least - 0 in 2010. The data has an increasing trend.
When looking into fire subcategories, the most reports belonged to: Structure Fires (67.1%), and Mobile Property/Vehicle Fires (14.6%).
Fire incident types reported to NFIRS in Zip Code 16625


 Nearest zip codes: 16670, 16682, 16655, 16637, 16667, 16673.


 Based on the data from the years 2007 - 2018 the average number of fire incidents per year is 14. The highest number of fire incidents - 58 took place in 2017, and the least - 0 in 2010. The data has an increasing trend.
 When looking into fire subcategories, the most reports belonged to: Structure Fires (67.1%), and Mobile Property/Vehicle Fires (14.6%).