Estimated zip code population in 2022: 1,637 Zip code population in 2010: 2,108 Zip code population in 2000: 2,157
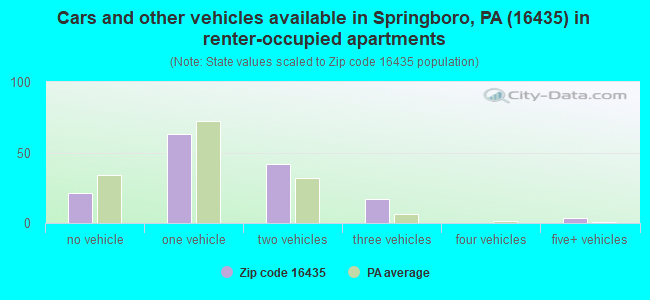
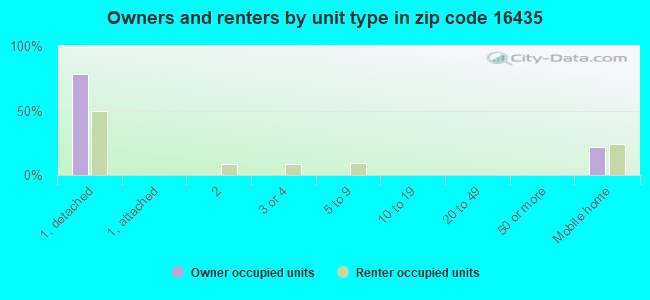
Houses and condos: 799 Renter-occupied apartments: 146
% of renters here:
21%
State:
31%
March 2022 cost of living index in zip code 16435: 91.0 (less than average, U.S. average is 100)
Land area: 55.8 sq. mi. Water area: 0.0 sq. mi.
Population density: 29 people per square mile
(very low).
OSM Map
General Map
Google Map
MSN Map
OSM Map
General Map
Google Map
MSN Map
OSM Map
General Map
Google Map
MSN Map
OSM Map
General Map
Google Map
MSN Map
Please wait while loading the map...
Real estate property taxes paid for housing units in 2022:
This zip code:
1.3% ($1,541)
Pennsylvania:
1.3% ($3,094)
Median real estate property taxes paid for housing units with mortgages in 2022: $1,678 (1.1%) Median real estate property taxes paid for housing units with no mortgage in 2022: $1,307 (1.3%)
Business Search- 14 Million verified businesses
Males: 838
(51.2%)
Females: 799
(48.8%)
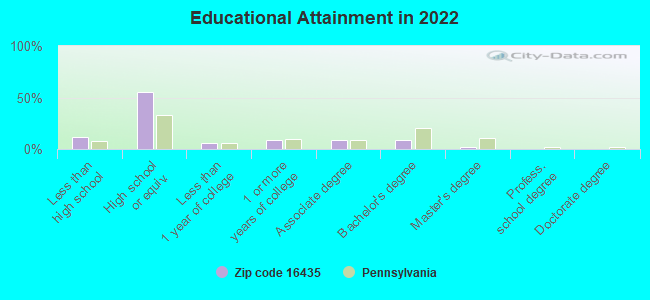
For population 25 years and over in 16435:
High school or higher: 86.8%
Bachelor's degree or higher: 10.3%
Graduate or professional degree: 1.7%
Unemployed: 5.0%
Mean travel time to work (commute): 28.3 minutes
For population 15 years and over in 16435:
Never married: 25.8%
Now married: 56.3%
Separated: 2.5%
Widowed: 5.7%
Divorced: 9.7%
Zip code 16435 compared to state average:
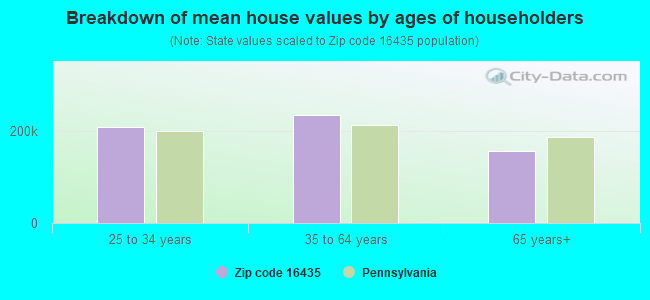
Median house value below state average.
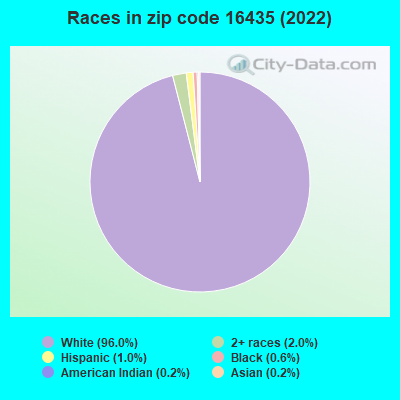
Black race population percentage significantly below state average.
Hispanic race population percentage significantly below state average.
Median age above state average.
Foreign-born population percentage significantly below state average.
Length of stay since moving in significantly above state average.
Number of college students below state average.
Percentage of population with a bachelor's degree or higher significantly below state average.
Averages for the 2020 tax year for zip code 16435, filed in 2021:
Average Adjusted Gross Income (AGI) in 2020: $43,211 (Individual Income Tax Returns)
Here:
$43,211
State:
$75,707
Salary/wage: $37,536 (reported on 81.2% of returns)
Here:
$37,536
State:
$62,806
(% of AGI for various income ranges: 965.7% for AGIs below $25k, 3450.9% for AGIs $25k-50k, 6045.0% for AGIs $50k-75k, 9242.0% for AGIs $75k-100k, 17563.3% for AGIs $100k-200k)
Taxable interest for individuals: $731 (reported on 18.8% of returns)
This zip code:
$731
Pennsylvania:
$1,633
(% of AGI for various income ranges: 11.4% for AGIs below $25k, 20.4% for AGIs $25k-50k, 16.0% for AGIs $50k-75k, 30.0% for AGIs $75k-100k, 50.0% for AGIs $100k-200k)
Ordinary dividends: $1,538 (reported on 9.4% of returns)
Here:
$1,538
State:
$7,382
(% of AGI for various income ranges: 11.0% for AGIs below $25k, 14.8% for AGIs $25k-50k, 132.0% for AGIs $75k-100k)
Net capital gain/loss in AGI: +$5,100 (reported on 8.2% of returns)
Here:
+$5,100
State:
+$23,522
(% of AGI for various income ranges: 20.5% for AGIs below $25k, 48.7% for AGIs $25k-50k, 404.0% for AGIs $75k-100k)
Profit/loss from business: +$11,600 (reported on 10.6% of returns)
Here:
+$11,600
State:
+$16,274
(% of AGI for various income ranges: 118.6% for AGIs below $25k, 81.7% for AGIs $25k-50k, 343.0% for AGIs $50k-75k, 528.0% for AGIs $75k-100k)
Taxable individual retirement arrangement distribution: $11,414 (reported on 8.2% of returns)
16435:
$11,414
Pennsylvania:
$18,583
(% of AGI for various income ranges: 81.4% for AGIs below $25k, 628.0% for AGIs $50k-75k)
Earned income credit: $1,893 (reported on 17.6% of returns)
Here:
$1,893
State:
$2,100
(% of AGI for various income ranges: 65.7% for AGIs below $25k, 63.5% for AGIs $25k-50k)
Percentage of individuals using paid preparers for their 2020 taxes: 95.3%
Here:
95%
State:
92%
(% for various income ranges: 93.1% for AGIs below $25k, 96.6% for AGIs $25k-50k, 92.9% for AGIs $50k-75k, 100.0% for AGIs $75k-100k, 100.0% for AGIs $100k-200k)
Averages for the 2012 tax year for zip code 16435, filed in 2013:
Average Adjusted Gross Income (AGI) in 2012: $36,351 (Individual Income Tax Returns)
Here:
$36,351
State:
$61,346
Salary/wage: $33,409 (reported on 82.8% of returns)
Here:
$33,409
State:
$51,902
(% of AGI for various income ranges: 74.0% for AGIs below $25k, 75.7% for AGIs $25k-50k, 81.4% for AGIs $50k-75k, 77.6% for AGIs $75k-100k, 69.9% for AGIs $100k-200k)
Taxable interest for individuals: $262 (reported on 25.8% of returns)
This zip code:
$262
Pennsylvania:
$1,588
(% of AGI for various income ranges: 0.4% for AGIs below $25k, 0.1% for AGIs $25k-50k, 0.2% for AGIs $75k-100k, 0.2% for AGIs $100k-200k)
Ordinary dividends: $756 (reported on 9.7% of returns)
Here:
$756
State:
$5,827
(% of AGI for various income ranges: 0.4% for AGIs below $25k, 0.1% for AGIs $25k-50k, 0.6% for AGIs $75k-100k)
Net capital gain/loss in AGI: +$875 (reported on 8.6% of returns)
Here:
+$875
State:
+$14,495
(% of AGI for various income ranges: 1.4% for AGIs $75k-100k)
Profit/loss from business: +$8,200 (reported on 14.0% of returns)
Here:
+$8,200
State:
+$16,268
(% of AGI for various income ranges: 6.5% for AGIs below $25k, 4.9% for AGIs $25k-50k, 3.6% for AGIs $50k-75k)
Taxable individual retirement arrangement distribution: $7,586 (reported on 7.5% of returns)
16435:
$7,586
Pennsylvania:
$14,550
(% of AGI for various income ranges: 3.2% for AGIs below $25k, 1.9% for AGIs $25k-50k, 2.4% for AGIs $50k-75k)
Total itemized deductions: $16,175 (23% of AGI, reported on 12.9% of returns)
Here:
$16,175
State:
$23,538
Here:
23.0% of AGI
State:
18.4% of AGI
(% of AGI for various income ranges: 7.4% for AGIs $25k-50k, 4.5% for AGIs $50k-75k, 8.0% for AGIs $75k-100k, 7.8% for AGIs $100k-200k)
Charity contributions: $2,586 (reported on 7.5% of returns)
Here:
$2,586
State:
$4,025
Taxes paid: $5,500 (reported on 12.9% of returns)
16435:
$5,500
State:
$9,982
(% of AGI for various income ranges: 2.0% for AGIs $25k-50k, 1.6% for AGIs $50k-75k, 2.3% for AGIs $75k-100k, 3.8% for AGIs $100k-200k)
Earned income credit: $1,943 (reported on 22.6% of returns)
Here:
$1,943
State:
$2,106
(% of AGI for various income ranges: 6.1% for AGIs below $25k, 1.0% for AGIs $25k-50k)
Percentage of individuals using paid preparers for their 2012 taxes: 55.9%
Here:
56%
State:
53%
(% for various income ranges: 47.7% for AGIs below $25k, 62.5% for AGIs $25k-50k, 69.2% for AGIs $50k-75k, 57.1% for AGIs $75k-100k, 60.0% for AGIs $100k-200k)
Averages for the 2004 tax year for zip code 16435, filed in 2005:
Average Adjusted Gross Income (AGI) in 2004: $28,626 (Individual Income Tax Returns)
Here:
$28,626
State:
$48,049
Salary/wage: $27,744 (reported on 84.9% of returns)
Here:
$27,744
State:
$42,646
(% of AGI for various income ranges: 118.7% for AGIs below $10k, 75.0% for AGIs $10k-25k, 84.6% for AGIs $25k-50k, 86.1% for AGIs $50k-75k, 79.2% for AGIs $75k-100k, 66.8% for AGIs over 100k)
Taxable interest for individuals: $529 (reported on 38.7% of returns)
This zip code:
$529
Pennsylvania:
$1,657
(% of AGI for various income ranges: 5.4% for AGIs below $10k, 0.4% for AGIs $10k-25k, 1.0% for AGIs $25k-50k, 0.4% for AGIs $50k-75k, 0.1% for AGIs $75k-100k, 0.2% for AGIs over 100k)
Taxable dividends: $488 (reported on 13.5% of returns)
Here:
$488
State:
$3,566
(% of AGI for various income ranges: 1.1% for AGIs below $10k, 0.0% for AGIs $10k-25k, 0.3% for AGIs $25k-50k, 0.3% for AGIs $50k-75k, 0.2% for AGIs $75k-100k)
Net capital gain/loss: +$364 (reported on 8.6% of returns)
Here:
+$364
State:
+$9,716
(% of AGI for various income ranges: -3.0% for AGIs below $10k, 0.0% for AGIs $25k-50k, 0.3% for AGIs $50k-75k, 0.9% for AGIs $75k-100k)
Profit/loss from business: +$4,813 (reported on 16.7% of returns)
Here:
+$4,813
State:
+$14,267
(% of AGI for various income ranges: 13.3% for AGIs below $10k, 7.1% for AGIs $10k-25k, 3.3% for AGIs $25k-50k, 0.1% for AGIs $50k-75k)
IRA payment deduction: $2,885 (reported on 2.9% of returns)
16435:
$2,885
Pennsylvania:
$2,903
Total itemized deductions: $13,654 (23% of AGI, reported on 11.9% of returns)
Here:
$13,654
State:
$18,804
Here:
23.2% of AGI
State:
19.5% of AGI
(% of AGI for various income ranges: 4.6% for AGIs $10k-25k, 4.3% for AGIs $25k-50k, 5.7% for AGIs $50k-75k, 11.3% for AGIs $75k-100k, 8.0% for AGIs over 100k)
Charity contributions deductions: $1,704 (3% of AGI, reported on 9.0% of returns)
Here:
$1,704
State:
$3,337
Here:
2.7% of AGI
State:
3.3% of AGI
(% of AGI for various income ranges: 0.6% for AGIs $10k-25k, 0.4% for AGIs $25k-50k, 0.6% for AGIs $50k-75k, 0.5% for AGIs $75k-100k, 1.2% for AGIs over 100k)
Total tax: $3,293 (reported on 67.3% of returns)
16435:
$3,293
State:
$8,008
(% of AGI for various income ranges: 3.6% for AGIs below $10k, 4.0% for AGIs $10k-25k, 6.1% for AGIs $25k-50k, 8.1% for AGIs $50k-75k, 11.6% for AGIs $75k-100k, 18.6% for AGIs over 100k)
Earned income credit: $1,648 (reported on 21.8% of returns)
Here:
$1,648
State:
$1,643
Percentage of individuals using paid preparers for their 2004 taxes: 61.2%
Here:
61%
State:
56%
(% for various income ranges: 54.7% for AGIs below $10k, 63.3% for AGIs $10k-25k, 61.7% for AGIs $25k-50k, 67.9% for AGIs $50k-75k, 57.1% for AGIs $75k-100k, 76.9% for AGIs over 100k)
Likely homosexual households (counted as self-reported same-sex unmarried-partner households)
Lesbian couples: 0.0% of all households
Gay men: 0.7% of all households
Household received Food Stamps/SNAP in the past 12 months: 147 Household did not receive Food Stamps/SNAP in the past 12 months: 547
Women who had a birth in the past 12 months: 33 (30 now married, 4 unmarried) Women who did not have a birth in the past 12 months: 250 (112 now married, 138 unmarried)
Housing units in zip code 16435 with a mortgage: 216 (33 second mortgage, 27 both second mortgage and home equity loan) Houses without a mortgage: 21
Median monthly owner costs for units with a mortgage: $1,080 Median monthly owner costs for units without a mortgage: $461
Residents with income below the poverty level in 2022:
This zip code:
15.5%
Whole state:
11.8%
Residents with income below 50% of the poverty level in 2022:
This zip code:
9.1%
Whole state:
6.1%
Median number of rooms in houses and condos:
Here:
6.0
State:
6.8
Median number of rooms in apartments:
Here:
5.7
State:
4.3
Notable locations in this zip code not listed on our city pages
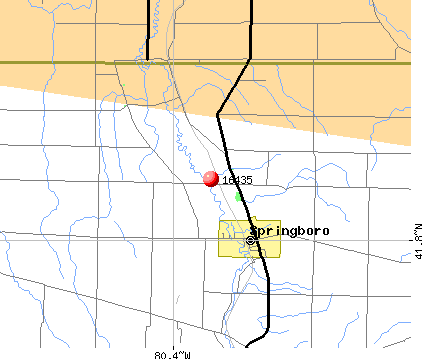
Notable locations in zip code 16435: Shadeland Station (A), Wing (B), Springboro Station (C), Wing (D), Springboro Volunteer Fire Department (E). Display/hide their locations on the map
Size of family households: 274 2-persons, 104 3-persons, 71 4-persons, 18 5-persons, 16 6-persons, 8 7-or-more-persons
Size of nonfamily households: 159 1-person, 34 2-persons, 1 3-persons
179 married couples with children.
63 single-parent households (21 men, 42 women).
95.2% of residents of 16435 zip code speak English at home.
3.8% of residents speak other Indo-European language at home (41% very well, 59% well).
0.3% of residents speak Asian or Pacific Island language at home (80% very well, 20% well).
0.1% of residents speak other language at home (100% very well).
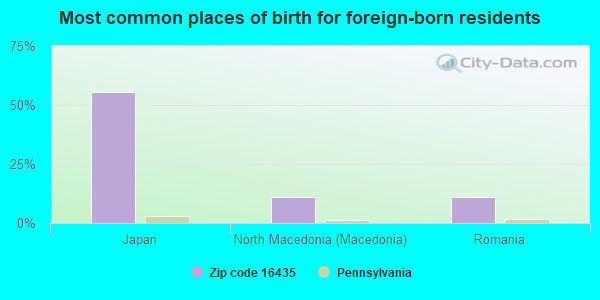
Foreign born population: 9 (0.6%) (78.5% of them are naturalized citizens)
This zip code:
0.6%
Whole state:
7.5%
56%Japan
11%North Macedonia (Macedonia)
11%Romania
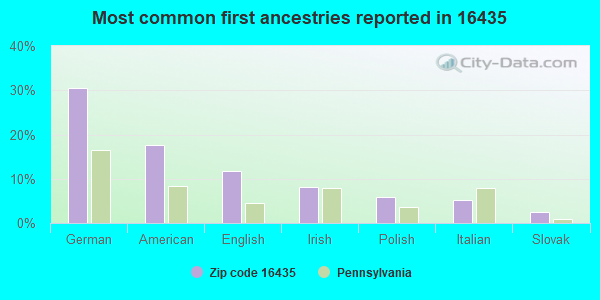
31%German
18%American
12%English
8%Irish
6%Polish
5%Italian
2%Slovak
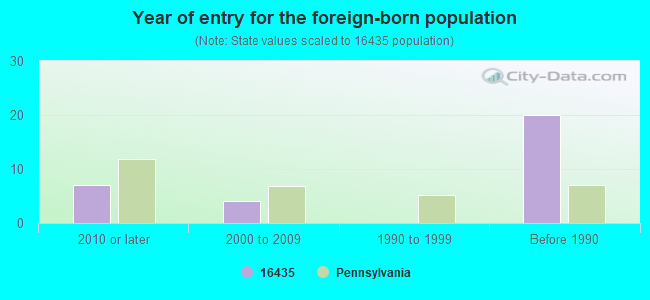
Year of entry for the foreign-born population
72010 or later
42000 to 2009
01990 to 1999
20Before 1990
Facilities with environmental interests located in this zip code:
BRAD S & ROBYN S FUHRER SRSTP (10643 SPRINGBORO ROAD in SPRINGBORO, PA)
STATE MASTER (Pennsylvania database) - PCS-PAG048736, National Pollutant Discharge Elimination System Permit National Pollutant Discharge Elimination System NON-MAJOR (Tracking pollutant discharge elimination systems) - permit Business SIC classification: OPERATORS OF DWELLINGS OTHER THAN APARTMENT BUILDINGS Alternative names: BRAD & ROBYN FUHRER, FUHRER, BRAD & ROBYN
BRIAN S MULLEN SRSTP (11344 MILL GROVE RD in SPRINGBORO, PA)
STATE MASTER (Pennsylvania database) - PCS-PAG048841, National Pollutant Discharge Elimination System Permit National Pollutant Discharge Elimination System NON-MAJOR (Tracking pollutant discharge elimination systems) - permit Business SIC classification: OPERATORS OF DWELLINGS OTHER THAN APARTMENT BUILDINGS Alternative names: MULLEN, BRIAN
Housing units lacking complete plumbing facilities: 3.0% Housing units lacking complete kitchen facilities: 3.1%
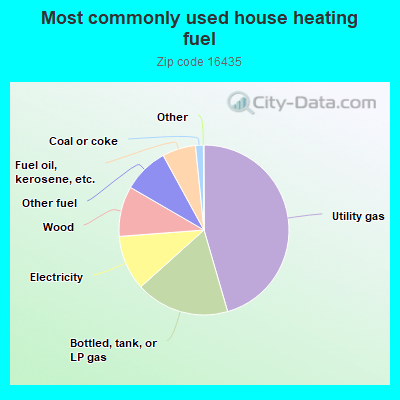
45.7%Utility gas
17.9%Bottled, tank, or LP gas
10.5%Electricity
9.6%Wood
8.7%Other fuel
6.4%Fuel oil, kerosene, etc.
1.5%Coal or coke
Population in 1990: 2,131. Population change in the 1990s: +26 (+1.2%).
Place of birth for U.S.-born residents:
This state: 1,273
Northeast: 38
Midwest: 205
South: 62
West: 17
69% of the 16435 zip code residents lived in the same house 5 years ago. Out of people who lived in different houses, 58% lived in this county. Out of people who lived in different counties, 50% lived in Pennsylvania.
90% of the 16435 zip code residents lived in the same house 1 year ago. Out of people who lived in different houses, 32% moved from this county. Out of people who lived in different houses, 48% moved from different county within same state. Out of people who lived in different houses, 19% moved from different state.
Private vs. public school enrollment:
Students in private schools in grades 1 to 8 (elementary and middle school): 1
Here:
1.0%
Pennsylvania:
15.7%
Students in private schools in grades 9 to 12 (high school): 2
Here:
2.8%
Pennsylvania:
13.4%
Students in private undergraduate colleges: 6
Here:
24.0%
Pennsylvania:
39.8%
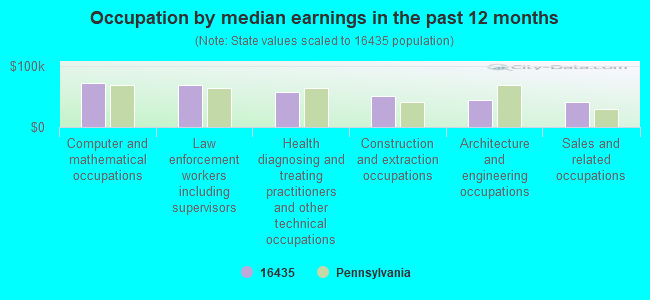
Occupation by median earnings in the past 12 months ($)
72,523Computer and mathematical occupations
68,455Law enforcement workers including supervisors
57,767Health diagnosing and treating practitioners and other technical occupations
51,081Construction and extraction occupations
44,443Architecture and engineering occupations
41,520Sales and related occupations
Top industries in this zip code by the number of employees in 2005:
Information: Libraries and Archives (5-9 employees: 1 establishment)
Wholesale Trade: Metal Service Centers and Other Metal Merchant Wholesalers (5-9: 1)
Health Care and Social Assistance: Services for the Elderly and Persons with Disabilities (1-4: 2)
Other Services (except Public Administration): General Automotive Repair (1-4: 2)
Construction: Masonry Contractors (1-4: 1)
Fatal accident statistics in 2013:
Fatal accident count: 2
Vehicles involved in fatal accidents: 3
Fatal accidents caused by drunken drivers: 1
Fatalities: 2
Persons involved in fatal accidents: 3
Pedestrians involved in fatal accidents: 0
Fatal accident statistics in 2010:
Fatal accident count: 1
Vehicles involved in fatal accidents: 2
Fatal accidents caused by drunken drivers: 1
Fatalities: 1
Persons involved in fatal accidents: 2
Pedestrians involved in fatal accidents: 0
Most common first names in zip code 16435 among deceased individuals
Name
Count
Lived (average)
John
25
76.3 years
William
17
74.5 years
Joseph
14
75.7 years
George
13
77.5 years
Mary
13
80.2 years
Robert
12
66.5 years
Helen
9
79.7 years
Edward
9
73.3 years
Richard
9
54.7 years
Charles
9
79.9 years
Most common last names in zip code 16435 among deceased individuals
Last name
Count
Lived (average)
Brown
12
74.8 years
Nelson
6
81.8 years
Stagl
6
78.7 years
Davis
5
76.2 years
Gates
5
83.2 years
Smith
5
79.4 years
Carr
4
72.2 years
Boyce
4
79.0 years
Frndak
4
89.0 years
Blood
4
69.5 years
Discuss Springboro, Pennsylvania (PA) on our hugely popular Pennsylvania forum.

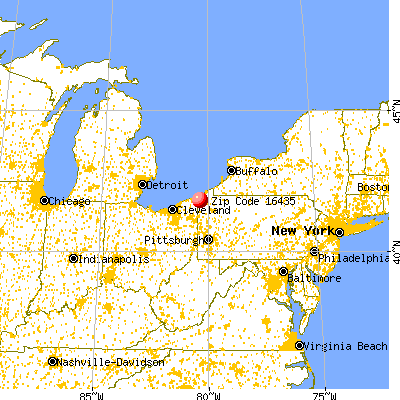


 Nearest zip codes: 16401, 16406, 16410, 16443, 16424, 16422.