Estimated zip code population in 2022: 3,045 Zip code population in 2010: 3,510 Zip code population in 2000: 3,592
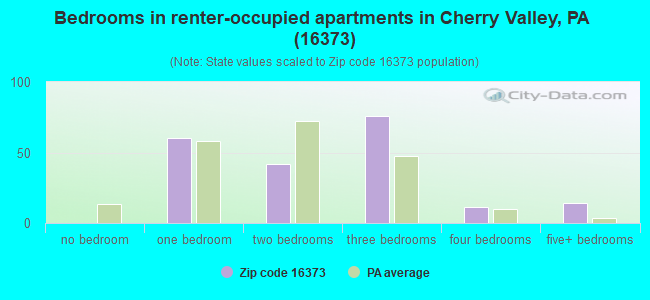
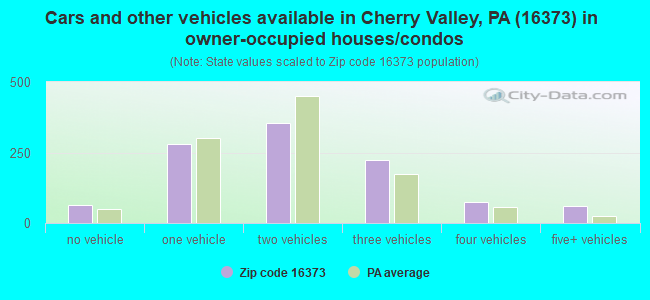
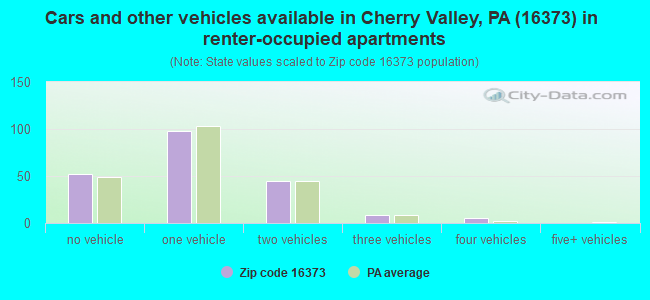
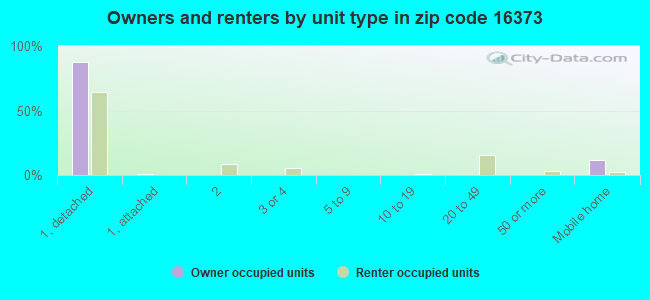
Houses and condos: 1,744 Renter-occupied apartments: 208
% of renters here:
16%
State:
31%
March 2022 cost of living index in zip code 16373: 90.3 (less than average, U.S. average is 100)
Land area: 80.0 sq. mi. Water area: 2.6 sq. mi.
Population density: 38 people per square mile
(very low).
OSM Map
General Map
Google Map
MSN Map
OSM Map
General Map
Google Map
MSN Map
OSM Map
General Map
Google Map
MSN Map
OSM Map
General Map
Google Map
MSN Map
Please wait while loading the map...
Real estate property taxes paid for housing units in 2022:
This zip code:
1.0% ($1,471)
Pennsylvania:
1.3% ($3,094)
Median real estate property taxes paid for housing units with mortgages in 2022: $1,712 (1.1%) Median real estate property taxes paid for housing units with no mortgage in 2022: $1,307 (1.0%)
Business Search- 14 Million verified businesses
Males: 1,601
(52.6%)
Females: 1,444
(47.4%)
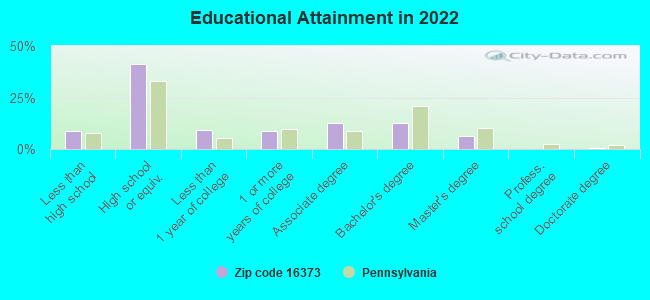
For population 25 years and over in 16373:
High school or higher: 89.9%
Bachelor's degree or higher: 19.6%
Graduate or professional degree: 6.9%
Unemployed: 2.0%
Mean travel time to work (commute): 32.5 minutes
For population 15 years and over in 16373:
Never married: 24.1%
Now married: 58.1%
Separated: 1.7%
Widowed: 6.4%
Divorced: 9.7%
Zip code 16373 compared to state average:
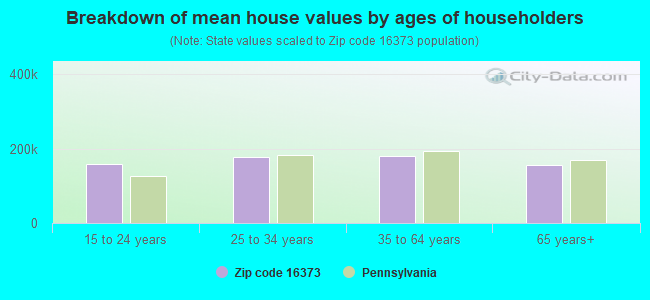
Median house value below state average.
Unemployed percentage below state average.
Black race population percentage significantly below state average.
Hispanic race population percentage significantly below state average.
Median age above state average.
Foreign-born population percentage significantly below state average.
Renting percentage below state average.
Length of stay since moving in above state average.
Number of college students below state average.
Percentage of population with a bachelor's degree or higher below state average.
Averages for the 2020 tax year for zip code 16373, filed in 2021:
Average Adjusted Gross Income (AGI) in 2020: $53,874 (Individual Income Tax Returns)
Here:
$53,874
State:
$75,707
Salary/wage: $48,729 (reported on 76.7% of returns)
Here:
$48,729
State:
$62,806
(% of AGI for various income ranges: 1060.3% for AGIs below $25k, 3383.3% for AGIs $25k-50k, 6301.1% for AGIs $50k-75k, 8103.3% for AGIs $75k-100k, 17156.2% for AGIs $100k-200k)
Taxable interest for individuals: $520 (reported on 31.4% of returns)
This zip code:
$520
Pennsylvania:
$1,633
(% of AGI for various income ranges: 22.4% for AGIs below $25k, 14.0% for AGIs $25k-50k, 25.0% for AGIs $50k-75k, 27.3% for AGIs $75k-100k, 44.6% for AGIs $100k-200k)
Ordinary dividends: $3,787 (reported on 19.5% of returns)
Here:
$3,787
State:
$7,382
(% of AGI for various income ranges: 38.8% for AGIs below $25k, 40.0% for AGIs $25k-50k, 100.6% for AGIs $50k-75k, 116.0% for AGIs $75k-100k, 439.2% for AGIs $100k-200k)
Net capital gain/loss in AGI: +$5,717 (reported on 15.1% of returns)
Here:
+$5,717
State:
+$23,522
(% of AGI for various income ranges: 19.1% for AGIs below $25k, 32.7% for AGIs $25k-50k, 103.9% for AGIs $50k-75k, 168.0% for AGIs $75k-100k, 593.8% for AGIs $100k-200k)
Profit/loss from business: +$16,936 (reported on 13.8% of returns)
Here:
+$16,936
State:
+$16,274
(% of AGI for various income ranges: 124.5% for AGIs below $25k, 217.3% for AGIs $25k-50k, 738.9% for AGIs $50k-75k, 490.7% for AGIs $75k-100k, 459.2% for AGIs $100k-200k)
Taxable individual retirement arrangement distribution: $14,094 (reported on 11.3% of returns)
16373:
$14,094
Pennsylvania:
$18,583
(% of AGI for various income ranges: 129.1% for AGIs below $25k, 137.3% for AGIs $25k-50k, 264.4% for AGIs $50k-75k, 198.7% for AGIs $75k-100k, 711.5% for AGIs $100k-200k)
Earned income credit: $2,025 (reported on 12.6% of returns)
Here:
$2,025
State:
$2,100
(% of AGI for various income ranges: 72.4% for AGIs below $25k, 55.3% for AGIs $25k-50k)
Percentage of individuals using paid preparers for their 2020 taxes: 93.1%
Here:
93%
State:
92%
(% for various income ranges: 92.2% for AGIs below $25k, 94.9% for AGIs $25k-50k, 89.3% for AGIs $50k-75k, 94.7% for AGIs $75k-100k, 95.5% for AGIs $100k-200k)
Averages for the 2012 tax year for zip code 16373, filed in 2013:
Average Adjusted Gross Income (AGI) in 2012: $51,266 (Individual Income Tax Returns)
Here:
$51,266
State:
$61,346
Salary/wage: $38,701 (reported on 81.0% of returns)
Here:
$38,701
State:
$51,902
(% of AGI for various income ranges: 65.5% for AGIs below $25k, 76.9% for AGIs $25k-50k, 80.3% for AGIs $50k-75k, 73.3% for AGIs $75k-100k, 69.4% for AGIs $100k-200k, 10.1% for AGIs over 200k)
Taxable interest for individuals: $806 (reported on 30.4% of returns)
This zip code:
$806
Pennsylvania:
$1,588
(% of AGI for various income ranges: 0.9% for AGIs below $25k, 0.5% for AGIs $25k-50k, 0.4% for AGIs $50k-75k, 0.5% for AGIs $75k-100k, 0.2% for AGIs $100k-200k, 0.5% for AGIs over 200k)
Ordinary dividends: $3,250 (reported on 20.3% of returns)
Here:
$3,250
State:
$5,827
(% of AGI for various income ranges: 2.0% for AGIs below $25k, 1.1% for AGIs $25k-50k, 1.0% for AGIs $50k-75k, 1.7% for AGIs $75k-100k, 2.5% for AGIs $100k-200k)
Net capital gain/loss in AGI: +$2,752 (reported on 13.3% of returns)
Here:
+$2,752
State:
+$14,495
(% of AGI for various income ranges: 0.3% for AGIs $25k-50k, 1.4% for AGIs $50k-75k, 0.4% for AGIs $75k-100k, 2.5% for AGIs $100k-200k)
Profit/loss from business: +$13,376 (reported on 15.8% of returns)
Here:
+$13,376
State:
+$16,268
(% of AGI for various income ranges: 8.2% for AGIs below $25k, 6.1% for AGIs $25k-50k, 2.0% for AGIs $50k-75k, 5.2% for AGIs $75k-100k, 5.8% for AGIs $100k-200k)
Taxable individual retirement arrangement distribution: $10,194 (reported on 10.1% of returns)
16373:
$10,194
Pennsylvania:
$14,550
(% of AGI for various income ranges: 4.1% for AGIs below $25k, 1.9% for AGIs $25k-50k, 1.8% for AGIs $50k-75k, 2.7% for AGIs $75k-100k, 2.9% for AGIs $100k-200k)
Total itemized deductions: $20,060 (18% of AGI, reported on 15.8% of returns)
Here:
$20,060
State:
$23,538
Here:
17.6% of AGI
State:
18.4% of AGI
(% of AGI for various income ranges: 3.6% for AGIs below $25k, 4.4% for AGIs $25k-50k, 6.5% for AGIs $50k-75k, 7.3% for AGIs $75k-100k, 9.0% for AGIs $100k-200k, 5.6% for AGIs over 200k)
Charity contributions: $4,822 (reported on 11.4% of returns)
Here:
$4,822
State:
$4,025
(% of AGI for various income ranges: 0.7% for AGIs $25k-50k, 0.9% for AGIs $50k-75k, 1.3% for AGIs $75k-100k, 3.5% for AGIs $100k-200k)
Taxes paid: $6,044 (reported on 15.8% of returns)
16373:
$6,044
State:
$9,982
(% of AGI for various income ranges: 0.5% for AGIs below $25k, 0.9% for AGIs $25k-50k, 1.6% for AGIs $50k-75k, 2.0% for AGIs $75k-100k, 3.3% for AGIs $100k-200k, 2.4% for AGIs over 200k)
Earned income credit: $1,973 (reported on 16.5% of returns)
Here:
$1,973
State:
$2,106
(% of AGI for various income ranges: 4.8% for AGIs below $25k, 1.0% for AGIs $25k-50k)
Percentage of individuals using paid preparers for their 2012 taxes: 57.0%
Here:
57%
State:
53%
(% for various income ranges: 51.6% for AGIs below $25k, 57.1% for AGIs $25k-50k, 56.5% for AGIs $50k-75k, 64.7% for AGIs $75k-100k, 70.0% for AGIs $100k-200k, 75.0% for AGIs over 200k)
Averages for the 2004 tax year for zip code 16373, filed in 2005:
Average Adjusted Gross Income (AGI) in 2004: $34,124 (Individual Income Tax Returns)
Here:
$34,124
State:
$48,049
Salary/wage: $30,305 (reported on 80.6% of returns)
Here:
$30,305
State:
$42,646
(% of AGI for various income ranges: 138.8% for AGIs below $10k, 69.6% for AGIs $10k-25k, 80.1% for AGIs $25k-50k, 77.8% for AGIs $50k-75k, 74.9% for AGIs $75k-100k, 44.3% for AGIs over 100k)
Taxable interest for individuals: $1,225 (reported on 45.8% of returns)
This zip code:
$1,225
Pennsylvania:
$1,657
(% of AGI for various income ranges: 8.3% for AGIs below $10k, 2.5% for AGIs $10k-25k, 1.4% for AGIs $25k-50k, 1.6% for AGIs $50k-75k, 0.4% for AGIs $75k-100k, 1.9% for AGIs over 100k)
Taxable dividends: $3,955 (reported on 24.6% of returns)
Here:
$3,955
State:
$3,566
(% of AGI for various income ranges: 5.4% for AGIs below $10k, 2.5% for AGIs $10k-25k, 1.9% for AGIs $25k-50k, 1.4% for AGIs $50k-75k, 1.7% for AGIs $75k-100k, 7.0% for AGIs over 100k)
Net capital gain/loss: +$4,173 (reported on 17.3% of returns)
Here:
+$4,173
State:
+$9,716
(% of AGI for various income ranges: -3.1% for AGIs below $10k, 0.2% for AGIs $10k-25k, 0.9% for AGIs $25k-50k, 1.8% for AGIs $50k-75k, 2.7% for AGIs $75k-100k, 5.7% for AGIs over 100k)
Profit/loss from business: +$9,936 (reported on 17.4% of returns)
Here:
+$9,936
State:
+$14,267
(% of AGI for various income ranges: 16.5% for AGIs below $10k, 6.0% for AGIs $10k-25k, 2.9% for AGIs $25k-50k, 3.5% for AGIs $50k-75k, 5.7% for AGIs $75k-100k, 7.9% for AGIs over 100k)
Profit/loss from farming: +$2,350 (reported on 2.6% of returns)
Here:
+$2,350
State:
+$274
IRA payment deduction: $2,812 (reported on 2.1% of returns)
16373:
$2,812
Pennsylvania:
$2,903
Total itemized deductions: $14,552 (20% of AGI, reported on 16.2% of returns)
Here:
$14,552
State:
$18,804
Here:
19.7% of AGI
State:
19.5% of AGI
(% of AGI for various income ranges: 3.8% for AGIs $10k-25k, 7.0% for AGIs $25k-50k, 6.6% for AGIs $50k-75k, 9.5% for AGIs $75k-100k, 7.7% for AGIs over 100k)
Charity contributions deductions: $3,467 (5% of AGI, reported on 13.7% of returns)
Here:
$3,467
State:
$3,337
Here:
4.5% of AGI
State:
3.3% of AGI
(% of AGI for various income ranges: 0.4% for AGIs $10k-25k, 1.1% for AGIs $25k-50k, 1.1% for AGIs $50k-75k, 2.1% for AGIs $75k-100k, 2.4% for AGIs over 100k)
Total tax: $4,678 (reported on 72.2% of returns)
16373:
$4,678
State:
$8,008
(% of AGI for various income ranges: 6.5% for AGIs below $10k, 4.3% for AGIs $10k-25k, 6.3% for AGIs $25k-50k, 8.8% for AGIs $50k-75k, 11.1% for AGIs $75k-100k, 19.5% for AGIs over 100k)
Earned income credit: $1,444 (reported on 16.3% of returns)
Here:
$1,444
State:
$1,643
Percentage of individuals using paid preparers for their 2004 taxes: 63.4%
Here:
63%
State:
56%
(% for various income ranges: 59.7% for AGIs below $10k, 64.2% for AGIs $10k-25k, 63.0% for AGIs $25k-50k, 67.5% for AGIs $50k-75k, 64.6% for AGIs $75k-100k, 69.5% for AGIs over 100k)
Household received Food Stamps/SNAP in the past 12 months: 171 Household did not receive Food Stamps/SNAP in the past 12 months: 1,098
Women who had a birth in the past 12 months: 33 (31 now married, 3 unmarried) Women who did not have a birth in the past 12 months: 530 (315 now married, 210 unmarried)
Housing units in zip code 16373 with a mortgage: 454 (59 second mortgage, 5 home equity loan, 44 both second mortgage and home equity loan) Houses without a mortgage: 13
Median monthly owner costs for units with a mortgage: $1,187 Median monthly owner costs for units without a mortgage: $468
Residents with income below the poverty level in 2022:
This zip code:
11.2%
Whole state:
11.8%
Residents with income below 50% of the poverty level in 2022:
This zip code:
8.4%
Whole state:
6.1%
Median number of rooms in houses and condos:
Here:
6.6
State:
6.8
Median number of rooms in apartments:
Here:
5.6
State:
4.3
Notable locations in this zip code not listed on our city pages
Notable locations in zip code 16373: Martins Mill (A), Adams Corners (B), Allegheny Valley Camp (C), Ella Gardner Corners (D), Hoodville (E), Distlers Corners (F), Westminster Highlands Camp (G), Whitehall Camp (H), Fern (I), Anderson Stone House (J), Emlenton Fire Department Station 55 (K). Display/hide their locations on the map
Churches in zip code 16373 include: West Home Church (A), Rankin Chapel (B), Richland Church (C), Scrubgrass Church (D), Old Zion Church (E), East Unity Church (F), Big Bend Church (G). Display/hide their locations on the map
Streams, rivers, and creeks: Turkey Run (A), Falling Spring Run (B), Lockard Run (C), Little Scrubgrass Creek (D), Shull Run (E), Shaw Run (F), Carrs Run (G), Whann Run (H), Richey Run (I). Display/hide their locations on the map
In group quarters: 45 (-1 institutionalized population)
Size of family households: 431 2-persons, 209 3-persons, 120 4-persons, 44 5-persons, 16 6-persons, 16 7-or-more-persons
Size of nonfamily households: 364 1-person, 64 2-persons, 2 3-persons
468 married couples with children.
80 single-parent households (47 men, 33 women).
92.2% of residents of 16373 zip code speak English at home.
0.8% of residents speak Spanish at home (71% very well, 29% well).
7.0% of residents speak other Indo-European language at home (33% very well, 54% well, 12% not well, 1% not at all).
0.1% of residents speak Asian or Pacific Island language at home (100% very well).
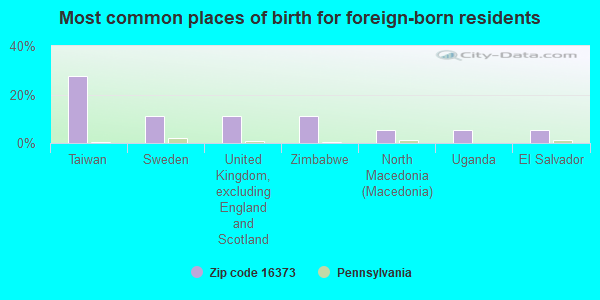
Foreign born population: 18 (0.6%) (73.0% of them are naturalized citizens)
This zip code:
0.6%
Whole state:
7.5%
28%Taiwan
11%Sweden
11%United Kingdom, excluding England and Scotland
11%Zimbabwe
6%North Macedonia (Macedonia)
6%Uganda
6%El Salvador
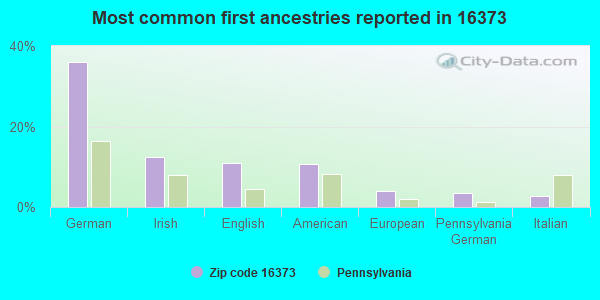
36%German
12%Irish
11%English
11%American
4%European
4%Pennsylvania German
3%Italian
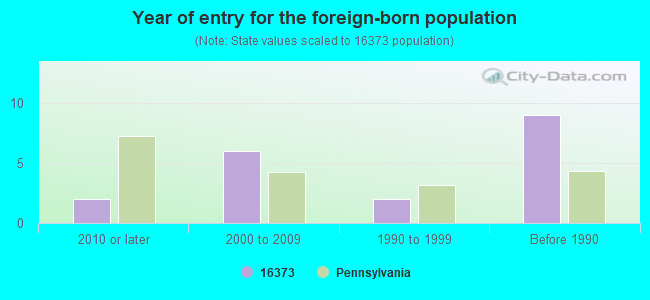
Year of entry for the foreign-born population
22010 or later
62000 to 2009
21990 to 1999
9Before 1990
Facilities with environmental interests located in this zip code:
ASHLAND 731 000 (RTE 208 in EMLENTON, PA)
STATE MASTER (Pennsylvania database) - RCRIS-PAD987388964, HAZARDOUS WASTE PROGRAM Large Quantity Generators, more that 1000 kg of hazardous waste/month (Resource Conservation and Recovery Act (tracking hazardous waste)) - notification Organizations: ASHLAND BRANDED MARKETING INC (CONTACT/OWNER)
Housing units lacking complete plumbing facilities: 6.5% Housing units lacking complete kitchen facilities: 6.3%
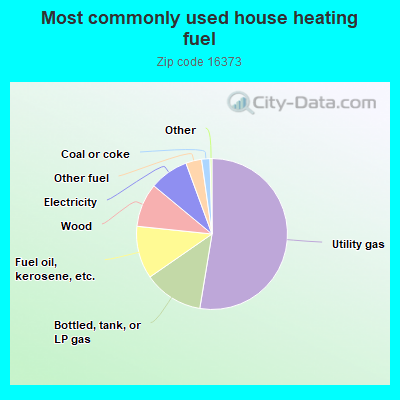
52.7%Utility gas
12.8%Bottled, tank, or LP gas
11.3%Fuel oil, kerosene, etc.
9.4%Wood
8.4%Electricity
3.4%Other fuel
1.8%Coal or coke
Population in 1990: 3,119. Population change in the 1990s: +473 (+15.2%).
Place of birth for U.S.-born residents:
This state: 2,649
Northeast: 85
Midwest: 109
South: 109
West: 51
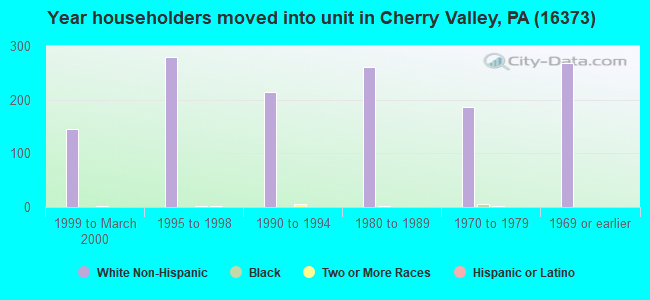
71% of the 16373 zip code residents lived in the same house 5 years ago. Out of people who lived in different houses, 45% lived in this county. Out of people who lived in different counties, 50% lived in Pennsylvania.
96% of the 16373 zip code residents lived in the same house 1 year ago. Out of people who lived in different houses, 42% moved from this county. Out of people who lived in different houses, 48% moved from different county within same state. Out of people who lived in different houses, 12% moved from different state. Out of people who lived in different houses, 2% moved from abroad.
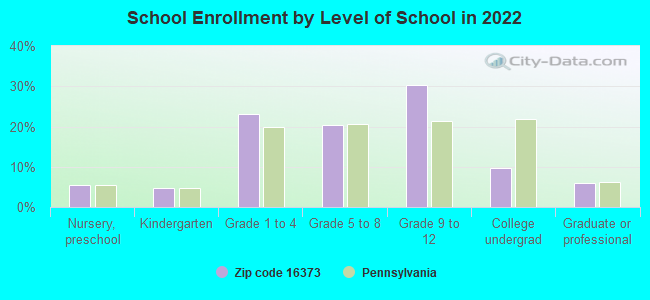
Private vs. public school enrollment:
Students in private schools in grades 1 to 8 (elementary and middle school): 62
Here:
26.2%
Pennsylvania:
15.7%
Students in private schools in grades 9 to 12 (high school): 28
Here:
17.2%
Pennsylvania:
13.4%
Students in private undergraduate colleges: 13
Here:
26.0%
Pennsylvania:
39.8%
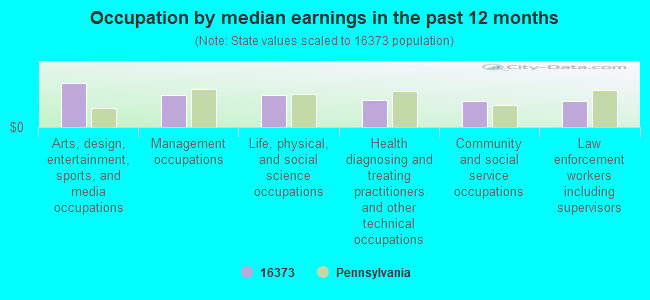
Occupation by median earnings in the past 12 months ($)
100,655Arts, design, entertainment, sports, and media occupations
73,378Management occupations
73,091Life, physical, and social science occupations
61,147Health diagnosing and treating practitioners and other technical occupations
59,433Community and social service occupations
58,491Law enforcement workers including supervisors
Top industries in this zip code by the number of employees in 2005:
Finance and Insurance: Commercial Banking (50-99 employees: 1 establishment)
Administrative and Support and Waste Management and Remediation Services: Janitorial Services (20-49: 1, 10-19: 1)
Accommodation and Food Services: Full-Service Restaurants (20-49: 1, 1-4: 1)
People in group quarters in 2010:
94 people in correctional facilities intended for juveniles
People in group quarters in 2000:
40 people in other noninstitutional group quarters
4 people in other nonhousehold living situations
Fatal accident statistics in 2013:
Fatal accident count: 1
Vehicles involved in fatal accidents: 4
Fatal accidents caused by drunken drivers: 0
Fatalities: 1
Persons involved in fatal accidents: 4
Pedestrians involved in fatal accidents: 0
Fatal accident statistics in 2012:
Fatal accident count: 4
Vehicles involved in fatal accidents: 22
Fatal accidents caused by drunken drivers: 0
Fatalities: 5
Persons involved in fatal accidents: 29
Pedestrians involved in fatal accidents: 0
2005 - 2018 National Fire Incident Reporting System (NFIRS) incidents
Based on the data from the years 2005 - 2018 the average number of fires per year is 14. The highest number of fire incidents - 40 took place in 2016, and the least - 1 in 2009. The data has a rising trend.
When looking into fire subcategories, the most incidents belonged to: Structure Fires (55.3%), and Outside Fires (20.6%).
Fire incident types reported to NFIRS in Zip Code 16373

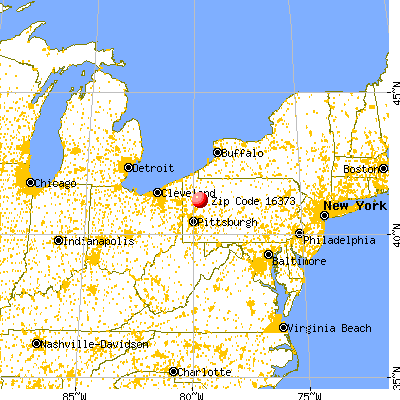


 Nearest zip codes: 16054, 16036, 16049, 16030, 16374, 16319.


 Based on the data from the years 2005 - 2018 the average number of fires per year is 14. The highest number of fire incidents - 40 took place in 2016, and the least - 1 in 2009. The data has a rising trend.
 When looking into fire subcategories, the most incidents belonged to: Structure Fires (55.3%), and Outside Fires (20.6%).