Estimated zip code population in 2022: 3,124 Zip code population in 2010: 3,260 Zip code population in 2000: 3,649
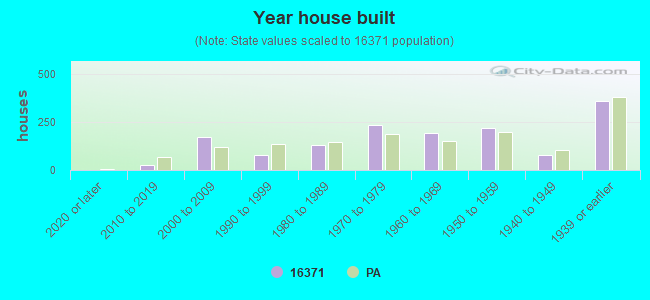
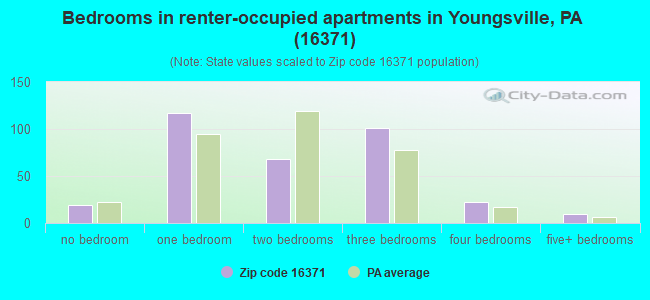
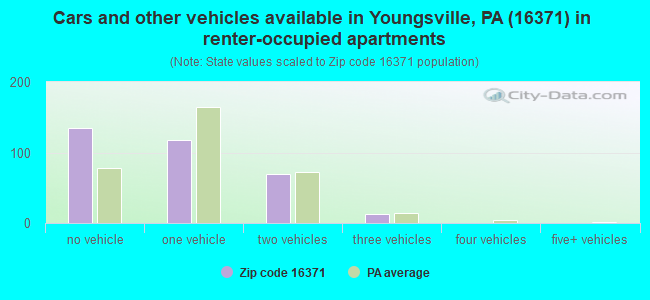
Houses and condos: 1,504 Renter-occupied apartments: 337
% of renters here:
26%
State:
31%
March 2022 cost of living index in zip code 16371: 82.1 (low, U.S. average is 100)
Land area: 30.6 sq. mi. Water area: 0.0 sq. mi.
Population density: 102 people per square mile
(very low).
OSM Map
General Map
Google Map
MSN Map
OSM Map
General Map
Google Map
MSN Map
OSM Map
General Map
Google Map
MSN Map
OSM Map
General Map
Google Map
MSN Map
Please wait while loading the map...
Real estate property taxes paid for housing units in 2022:
This zip code:
1.4% ($1,427)
Pennsylvania:
1.3% ($3,094)
Median real estate property taxes paid for housing units with mortgages in 2022: $1,492 (1.3%) Median real estate property taxes paid for housing units with no mortgage in 2022: $1,368 (1.4%)
Business Search- 14 Million verified businesses
Males: 1,571
(50.3%)
Females: 1,553
(49.7%)
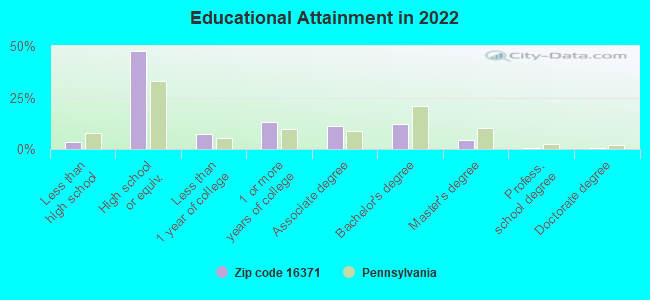
For population 25 years and over in 16371:
High school or higher: 95.3%
Bachelor's degree or higher: 17.2%
Graduate or professional degree: 5.0%
Unemployed: 5.0%
Mean travel time to work (commute): 21.1 minutes
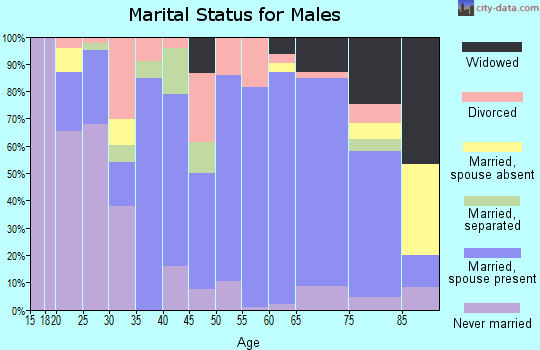
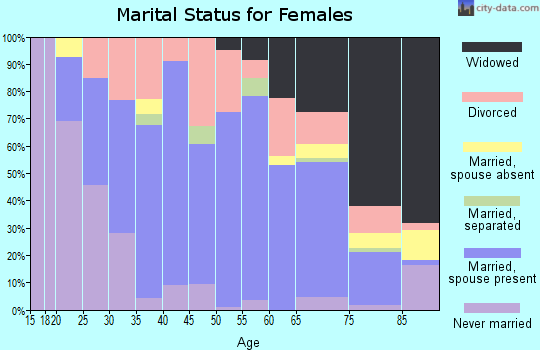
For population 15 years and over in 16371:
Never married: 23.0%
Now married: 53.3%
Separated: 1.3%
Widowed: 12.2%
Divorced: 10.2%
Zip code 16371 compared to state average:
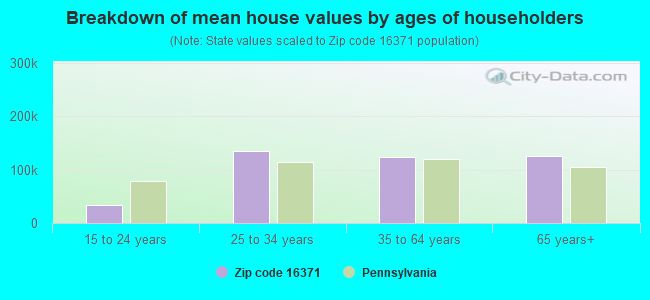
Median house value significantly below state average.
Black race population percentage significantly below state average.
Hispanic race population percentage significantly below state average.
Median age above state average.
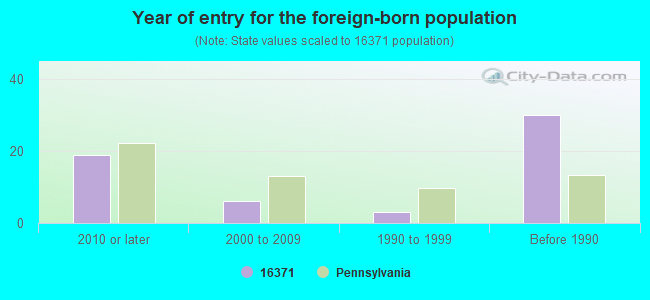
Foreign-born population percentage significantly below state average.
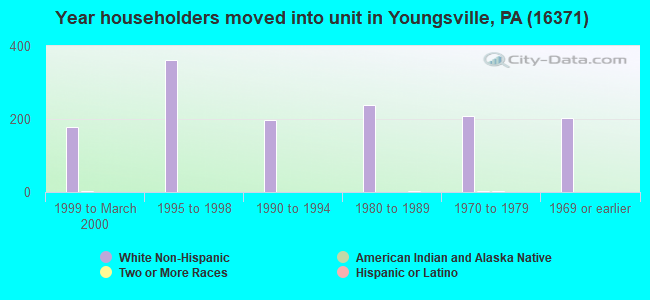
Length of stay since moving in significantly above state average.
Percentage of population with a bachelor's degree or higher below state average.
Estimated median house/condo value in 2022: $104,517
16371:
$104,517
Pennsylvania:
$245,500
According to our research of Pennsylvania and other state lists, there were 4 registered sex offenders living in 16371 zip code as of May 26, 2024. The ratio of all residents to sex offenders in zip code 16371 is 788 to 1. The ratio of registered sex offenders to all residents in this zip code is lower than the state average.
Median resident age:
This zip code:
45.7 years
Pennsylvania median age:
40.9 years
Average household size:
This zip code:
2.3 people
Pennsylvania:
2.4 people
Averages for the 2020 tax year for zip code 16371, filed in 2021:
Average Adjusted Gross Income (AGI) in 2020: $47,621 (Individual Income Tax Returns)
Here:
$47,621
State:
$75,707
Salary/wage: $41,204 (reported on 78.0% of returns)
Here:
$41,204
State:
$62,806
(% of AGI for various income ranges: 1044.3% for AGIs below $25k, 3307.4% for AGIs $25k-50k, 5498.1% for AGIs $50k-75k, 8088.2% for AGIs $75k-100k, 13722.0% for AGIs $100k-200k)
Taxable interest for individuals: $611 (reported on 25.5% of returns)
This zip code:
$611
Pennsylvania:
$1,633
(% of AGI for various income ranges: 8.9% for AGIs below $25k, 11.0% for AGIs $25k-50k, 25.0% for AGIs $50k-75k, 20.0% for AGIs $75k-100k, 93.0% for AGIs $100k-200k)
Ordinary dividends: $2,900 (reported on 17.0% of returns)
Here:
$2,900
State:
$7,382
(% of AGI for various income ranges: 30.9% for AGIs below $25k, 42.3% for AGIs $25k-50k, 72.5% for AGIs $50k-75k, 85.5% for AGIs $75k-100k, 247.0% for AGIs $100k-200k)
Net capital gain/loss in AGI: +$6,076 (reported on 12.1% of returns)
Here:
+$6,076
State:
+$23,522
(% of AGI for various income ranges: 4.6% for AGIs below $25k, 29.7% for AGIs $25k-50k, 144.4% for AGIs $50k-75k, 29.1% for AGIs $75k-100k, 662.0% for AGIs $100k-200k)
Profit/loss from business: +$10,000 (reported on 10.6% of returns)
Here:
+$10,000
State:
+$16,274
(% of AGI for various income ranges: 60.3% for AGIs below $25k, 65.5% for AGIs $25k-50k, 183.1% for AGIs $50k-75k, 323.6% for AGIs $75k-100k, 437.0% for AGIs $100k-200k)
Taxable individual retirement arrangement distribution: $14,706 (reported on 12.8% of returns)
16371:
$14,706
Pennsylvania:
$18,583
(% of AGI for various income ranges: 91.1% for AGIs below $25k, 202.3% for AGIs $25k-50k, 255.6% for AGIs $50k-75k, 635.5% for AGIs $75k-100k, 593.0% for AGIs $100k-200k)
Earned income credit: $2,225 (reported on 14.2% of returns)
Here:
$2,225
State:
$2,100
(% of AGI for various income ranges: 88.6% for AGIs below $25k, 43.5% for AGIs $25k-50k)
Percentage of individuals using paid preparers for their 2020 taxes: 94.3%
Here:
94%
State:
92%
(% for various income ranges: 92.0% for AGIs below $25k, 95.0% for AGIs $25k-50k, 95.2% for AGIs $50k-75k, 93.3% for AGIs $75k-100k, 100.0% for AGIs $100k-200k)
Averages for the 2012 tax year for zip code 16371, filed in 2013:
Average Adjusted Gross Income (AGI) in 2012: $39,621 (Individual Income Tax Returns)
Here:
$39,621
State:
$61,346
Salary/wage: $33,984 (reported on 80.4% of returns)
Here:
$33,984
State:
$51,902
(% of AGI for various income ranges: 71.5% for AGIs below $25k, 73.3% for AGIs $25k-50k, 75.1% for AGIs $50k-75k, 73.5% for AGIs $75k-100k, 53.8% for AGIs $100k-200k)
Taxable interest for individuals: $849 (reported on 29.4% of returns)
This zip code:
$849
Pennsylvania:
$1,588
(% of AGI for various income ranges: 1.0% for AGIs below $25k, 0.9% for AGIs $25k-50k, 0.7% for AGIs $50k-75k, 0.2% for AGIs $75k-100k, 0.4% for AGIs $100k-200k)
Ordinary dividends: $1,703 (reported on 20.9% of returns)
Here:
$1,703
State:
$5,827
(% of AGI for various income ranges: 1.0% for AGIs below $25k, 0.9% for AGIs $25k-50k, 1.2% for AGIs $50k-75k, 0.8% for AGIs $75k-100k, 0.6% for AGIs $100k-200k)
Net capital gain/loss in AGI: +$706 (reported on 11.8% of returns)
Here:
+$706
State:
+$14,495
(% of AGI for various income ranges: 0.7% for AGIs $50k-75k, 0.3% for AGIs $75k-100k)
Profit/loss from business: +$11,445 (reported on 13.1% of returns)
Here:
+$11,445
State:
+$16,268
(% of AGI for various income ranges: 2.0% for AGIs below $25k, 2.9% for AGIs $25k-50k, 1.4% for AGIs $50k-75k, 4.0% for AGIs $75k-100k, 7.6% for AGIs $100k-200k)
Taxable individual retirement arrangement distribution: $10,667 (reported on 13.7% of returns)
16371:
$10,667
Pennsylvania:
$14,550
(% of AGI for various income ranges: 5.0% for AGIs below $25k, 4.3% for AGIs $25k-50k, 4.1% for AGIs $50k-75k, 6.0% for AGIs $75k-100k)
Total itemized deductions: $17,260 (22% of AGI, reported on 13.1% of returns)
Here:
$17,260
State:
$23,538
Here:
22.2% of AGI
State:
18.4% of AGI
(% of AGI for various income ranges: 3.6% for AGIs below $25k, 5.0% for AGIs $25k-50k, 5.0% for AGIs $50k-75k, 6.6% for AGIs $75k-100k, 7.5% for AGIs $100k-200k)
Charity contributions: $3,273 (reported on 7.2% of returns)
Here:
$3,273
State:
$4,025
(% of AGI for various income ranges: 1.0% for AGIs $25k-50k, 0.8% for AGIs $75k-100k, 0.9% for AGIs $100k-200k)
Taxes paid: $5,655 (reported on 13.1% of returns)
16371:
$5,655
State:
$9,982
(% of AGI for various income ranges: 1.4% for AGIs $25k-50k, 1.3% for AGIs $50k-75k, 2.5% for AGIs $75k-100k, 3.4% for AGIs $100k-200k)
Earned income credit: $2,184 (reported on 16.3% of returns)
Here:
$2,184
State:
$2,106
(% of AGI for various income ranges: 5.0% for AGIs below $25k, 1.0% for AGIs $25k-50k)
Percentage of individuals using paid preparers for their 2012 taxes: 51.0%
Here:
51%
State:
53%
(% for various income ranges: 43.7% for AGIs below $25k, 52.6% for AGIs $25k-50k, 57.1% for AGIs $50k-75k, 57.1% for AGIs $75k-100k, 77.8% for AGIs $100k-200k)
Averages for the 2004 tax year for zip code 16371, filed in 2005:
Average Adjusted Gross Income (AGI) in 2004: $32,083 (Individual Income Tax Returns)
Here:
$32,083
State:
$48,049
Salary/wage: $29,075 (reported on 81.2% of returns)
Here:
$29,075
State:
$42,646
(% of AGI for various income ranges: 107.1% for AGIs below $10k, 67.8% for AGIs $10k-25k, 77.0% for AGIs $25k-50k, 80.2% for AGIs $50k-75k, 73.6% for AGIs $75k-100k, 48.0% for AGIs over 100k)
Taxable interest for individuals: $1,139 (reported on 44.3% of returns)
This zip code:
$1,139
Pennsylvania:
$1,657
(% of AGI for various income ranges: 5.7% for AGIs below $10k, 2.8% for AGIs $10k-25k, 1.5% for AGIs $25k-50k, 1.1% for AGIs $50k-75k, 1.0% for AGIs $75k-100k, 1.2% for AGIs over 100k)
Taxable dividends: $1,105 (reported on 25.0% of returns)
Here:
$1,105
State:
$3,566
(% of AGI for various income ranges: 2.4% for AGIs below $10k, 1.0% for AGIs $10k-25k, 1.2% for AGIs $25k-50k, 0.9% for AGIs $50k-75k, 0.2% for AGIs $75k-100k, 0.3% for AGIs over 100k)
Net capital gain/loss: +$140 (reported on 15.9% of returns)
Here:
+$140
State:
+$9,716
(% of AGI for various income ranges: -4.0% for AGIs below $10k, -0.3% for AGIs $10k-25k, 0.5% for AGIs $25k-50k, 0.4% for AGIs $50k-75k, -0.2% for AGIs $75k-100k, -0.1% for AGIs over 100k)
Profit/loss from business: +$8,807 (reported on 13.6% of returns)
Here:
+$8,807
State:
+$14,267
(% of AGI for various income ranges: 9.6% for AGIs below $10k, 3.4% for AGIs $10k-25k, 2.4% for AGIs $25k-50k, 2.4% for AGIs $50k-75k, 5.9% for AGIs $75k-100k, 7.2% for AGIs over 100k)
IRA payment deduction: $2,207 (reported on 2.0% of returns)
16371:
$2,207
Pennsylvania:
$2,903
Total itemized deductions: $15,297 (23% of AGI, reported on 13.6% of returns)
Here:
$15,297
State:
$18,804
Here:
23.3% of AGI
State:
19.5% of AGI
(% of AGI for various income ranges: 1.9% for AGIs $10k-25k, 5.8% for AGIs $25k-50k, 6.8% for AGIs $50k-75k, 9.0% for AGIs $75k-100k, 12.4% for AGIs over 100k)
Charity contributions deductions: $2,364 (3% of AGI, reported on 10.2% of returns)
Here:
$2,364
State:
$3,337
Here:
3.5% of AGI
State:
3.3% of AGI
(% of AGI for various income ranges: 0.3% for AGIs $10k-25k, 0.6% for AGIs $25k-50k, 0.7% for AGIs $50k-75k, 1.0% for AGIs $75k-100k, 1.8% for AGIs over 100k)
Total tax: $3,763 (reported on 70.5% of returns)
16371:
$3,763
State:
$8,008
(% of AGI for various income ranges: 2.5% for AGIs below $10k, 3.7% for AGIs $10k-25k, 6.4% for AGIs $25k-50k, 8.2% for AGIs $50k-75k, 11.8% for AGIs $75k-100k, 17.2% for AGIs over 100k)
Earned income credit: $1,725 (reported on 15.7% of returns)
Here:
$1,725
State:
$1,643
Percentage of individuals using paid preparers for their 2004 taxes: 60.6%
Here:
61%
State:
56%
(% for various income ranges: 53.2% for AGIs below $10k, 58.9% for AGIs $10k-25k, 63.0% for AGIs $25k-50k, 68.4% for AGIs $50k-75k, 64.2% for AGIs $75k-100k, 71.4% for AGIs over 100k)
Likely homosexual households (counted as self-reported same-sex unmarried-partner households)
Lesbian couples: 0.2% of all households
Gay men: 0.0% of all households
Household received Food Stamps/SNAP in the past 12 months: 160 Household did not receive Food Stamps/SNAP in the past 12 months: 1,120
Women who had a birth in the past 12 months: 28 (30 now married, 0 unmarried) Women who did not have a birth in the past 12 months: 551 (216 now married, 334 unmarried)
Housing units in zip code 16371 with a mortgage: 428 (43 second mortgage, 41 both second mortgage and home equity loan) Houses without a mortgage: 24
Median monthly owner costs for units with a mortgage: $1,006 Median monthly owner costs for units without a mortgage: $434
Residents with income below the poverty level in 2022:
This zip code:
12.6%
Whole state:
11.8%
Residents with income below 50% of the poverty level in 2022:
This zip code:
9.0%
Whole state:
6.1%
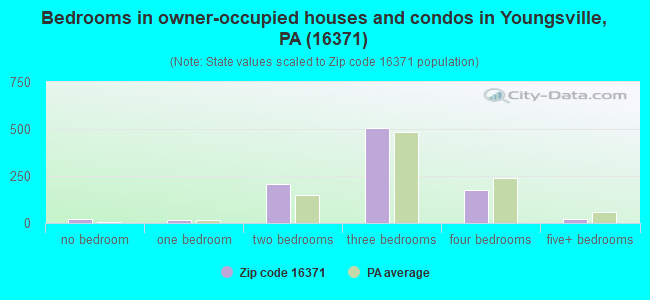
Median number of rooms in houses and condos:
Here:
6.9
State:
6.8
Median number of rooms in apartments:
Here:
4.5
State:
4.3
Notable locations in this zip code not listed on our city pages
Streams, rivers, and creeks: Anders Run (A), Patchen Run (B), Indian Camp Run (C), Telick Run (D), Matthews Run (E), Mead Run (F), McKinney Run (G), Lansing Run (H). Display/hide their locations on the map
In group quarters: 158 (-1 institutionalized population)
Size of family households: 466 2-persons, 164 3-persons, 109 4-persons, 12 5-persons, 6 6-persons, 49 7-or-more-persons
Size of nonfamily households: 425 1-person, 37 2-persons, 11 4-persons
517 married couples with children.
193 single-parent households (59 men, 134 women).
97.6% of residents of 16371 zip code speak English at home.
1.0% of residents speak Spanish at home (83% very well, 17% well).
1.1% of residents speak other Indo-European language at home (100% very well).
Foreign born population: 61 (2.0%) (53.6% of them are naturalized citizens)
This zip code:
2.0%
Whole state:
7.5%
39%France
25%Honduras
7%Poland
5%United Kingdom, excluding England and Scotland
5%Bangladesh
3%Sweden
3%Kazakhstan
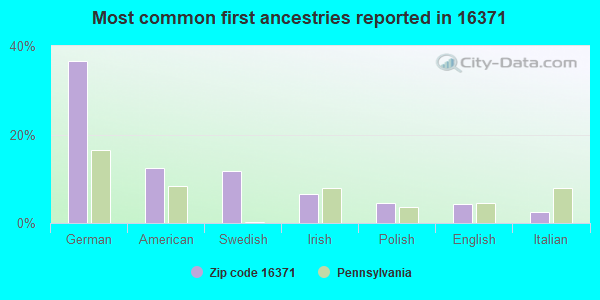
37%German
12%American
12%Swedish
7%Irish
4%Polish
4%English
2%Italian
Year of entry for the foreign-born population
192010 or later
62000 to 2009
31990 to 1999
30Before 1990
Facilities with environmental interests located in this zip code:
BROKENSTRAW VLY AREA AUTH STP (ROUTE 62 SOUTH in IRVINE, PA)
National Pollutant Discharge Elimination System NON-MAJOR (Tracking pollutant discharge elimination systems) - permit Alternative names: BROKENSTRAW VALLEY AREA AUTH
Housing units lacking complete plumbing facilities: 6.0% Housing units lacking complete kitchen facilities: 7.8%
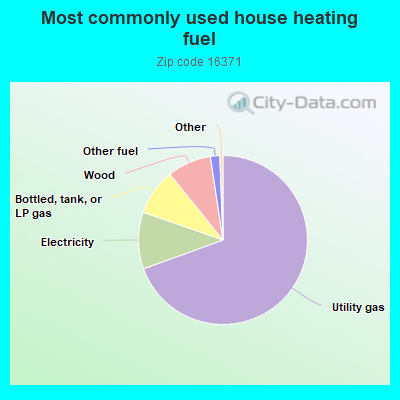
69.6%Utility gas
10.9%Electricity
8.9%Bottled, tank, or LP gas
8.4%Wood
1.8%Other fuel
Population in 1990: 1,853. Population change in the 1990s: +1,796 (+96.9%).
Place of birth for U.S.-born residents:
This state: 2,534
Northeast: 295
Midwest: 58
South: 120
West: 39
61% of the 16371 zip code residents lived in the same house 5 years ago. Out of people who lived in different houses, 81% lived in this county. Out of people who lived in different counties, 50% lived in Pennsylvania.
89% of the 16371 zip code residents lived in the same house 1 year ago. Out of people who lived in different houses, 77% moved from this county. Out of people who lived in different houses, 8% moved from different county within same state. Out of people who lived in different houses, 12% moved from different state.
Private vs. public school enrollment:
Students in private schools in grades 1 to 8 (elementary and middle school): 180
Here:
37.3%
Pennsylvania:
15.7%
Students in private schools in grades 9 to 12 (high school): 44
Here:
27.1%
Pennsylvania:
13.4%
Students in private undergraduate colleges: 14
Here:
13.8%
Pennsylvania:
39.8%
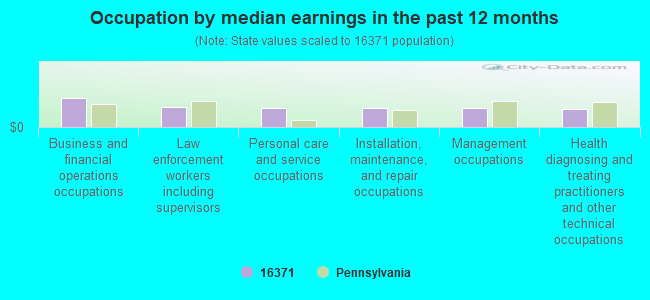
Occupation by median earnings in the past 12 months ($)
84,317Business and financial operations occupations
57,480Law enforcement workers including supervisors
56,033Personal care and service occupations
53,760Installation, maintenance, and repair occupations
53,634Management occupations
52,850Health diagnosing and treating practitioners and other technical occupations
Top industries in this zip code by the number of employees in 2005:
Health Care and Social Assistance: Nursing Care Facilities (250-499 employees: 1 establishment)
Accommodation and Food Services: Limited-Service Restaurants (20-49: 1, 10-19: 2)
Educational Services: Elementary and Secondary Schools (20-49: 1)
Health Care and Social Assistance: Continuing Care Retirement Communities (20-49: 1)


 Nearest zip codes: 16312, 16350, 16329, 16340, 16416, 16402.