Estimated zip code population in 2022: 1,859 Zip code population in 2010: 2,030 Zip code population in 2000: 2,039
Houses and condos: 1,176 Renter-occupied apartments: 64
% of renters here:
8%
State:
31%
March 2022 cost of living index in zip code 16341: 90.1 (less than average, U.S. average is 100)
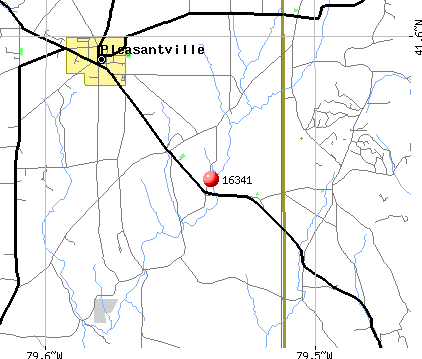
Land area: 67.6 sq. mi. Water area: 0.0 sq. mi.
Population density: 28 people per square mile
(very low).
OSM Map
General Map
Google Map
MSN Map
OSM Map
General Map
Google Map
MSN Map
OSM Map
General Map
Google Map
MSN Map
OSM Map
General Map
Google Map
MSN Map
Please wait while loading the map...
Real estate property taxes paid for housing units in 2022:
This zip code:
1.3% ($1,497)
Pennsylvania:
1.3% ($3,094)
Median real estate property taxes paid for housing units with mortgages in 2022: $1,970 (1.4%) Median real estate property taxes paid for housing units with no mortgage in 2022: $1,115 (1.1%)
Business Search- 14 Million verified businesses
Males: 905
(48.7%)
Females: 954
(51.3%)
For population 25 years and over in 16341:
High school or higher: 88.2%
Bachelor's degree or higher: 21.3%
Graduate or professional degree: 4.9%
Unemployed: 3.5%
Mean travel time to work (commute): 23.6 minutes
For population 15 years and over in 16341:
Never married: 21.3%
Now married: 59.2%
Separated: 1.3%
Widowed: 10.3%
Divorced: 7.9%
Zip code 16341 compared to state average:
Median house value below state average.
Black race population percentage significantly below state average.
Median age significantly above state average.
Foreign-born population percentage significantly below state average.
Renting percentage significantly below state average.
Length of stay since moving in significantly above state average.
Number of college students below state average.
Percentage of population with a bachelor's degree or higher below state average.
Estimated median house/condo value in 2022: $112,331
16341:
$112,331
Pennsylvania:
$245,500
According to our research of Pennsylvania and other state lists, there were 2 registered sex offenders living in 16341 zip code as of May 28, 2024. The ratio of all residents to sex offenders in zip code 16341 is 966 to 1. The ratio of registered sex offenders to all residents in this zip code is lower than the state average.
Median resident age:
This zip code:
50.7 years
Pennsylvania median age:
40.9 years
Average household size:
This zip code:
2.4 people
Pennsylvania:
2.4 people
Averages for the 2020 tax year for zip code 16341, filed in 2021:
Average Adjusted Gross Income (AGI) in 2020: $48,062 (Individual Income Tax Returns)
Here:
$48,062
State:
$75,707
Salary/wage: $41,504 (reported on 76.0% of returns)
Here:
$41,504
State:
$62,806
(% of AGI for various income ranges: 910.0% for AGIs below $25k, 3181.4% for AGIs $25k-50k, 6245.0% for AGIs $50k-75k, 9046.7% for AGIs $75k-100k, 13655.0% for AGIs $100k-200k)
Taxable interest for individuals: $862 (reported on 25.0% of returns)
This zip code:
$862
Pennsylvania:
$1,633
(% of AGI for various income ranges: 20.4% for AGIs below $25k, 25.5% for AGIs $25k-50k, 6.7% for AGIs $50k-75k, 26.7% for AGIs $75k-100k, 130.0% for AGIs $100k-200k)
Ordinary dividends: $3,325 (reported on 16.7% of returns)
Here:
$3,325
State:
$7,382
(% of AGI for various income ranges: 30.0% for AGIs below $25k, 17.7% for AGIs $25k-50k, 24.2% for AGIs $50k-75k, 95.0% for AGIs $75k-100k, 558.3% for AGIs $100k-200k)
Net capital gain/loss in AGI: +$4,800 (reported on 11.5% of returns)
Here:
+$4,800
State:
+$23,522
(% of AGI for various income ranges: 30.0% for AGIs below $25k, 61.7% for AGIs $50k-75k, 636.7% for AGIs $100k-200k)
Profit/loss from business: +$5,700 (reported on 11.5% of returns)
Here:
+$5,700
State:
+$16,274
(% of AGI for various income ranges: 62.1% for AGIs below $25k, 55.0% for AGIs $25k-50k, 109.2% for AGIs $50k-75k, 376.7% for AGIs $75k-100k)
Taxable individual retirement arrangement distribution: $13,923 (reported on 13.5% of returns)
16341:
$13,923
Pennsylvania:
$18,583
(% of AGI for various income ranges: 112.1% for AGIs below $25k, 121.4% for AGIs $25k-50k, 270.0% for AGIs $50k-75k, 1583.3% for AGIs $100k-200k)
Earned income credit: $2,213 (reported on 15.6% of returns)
Here:
$2,213
State:
$2,100
(% of AGI for various income ranges: 76.7% for AGIs below $25k, 67.3% for AGIs $25k-50k)
Percentage of individuals using paid preparers for their 2020 taxes: 89.6%
Here:
90%
State:
92%
(% for various income ranges: 91.2% for AGIs below $25k, 92.6% for AGIs $25k-50k, 87.5% for AGIs $50k-75k, 77.8% for AGIs $75k-100k, 90.0% for AGIs $100k-200k)
Averages for the 2012 tax year for zip code 16341, filed in 2013:
Average Adjusted Gross Income (AGI) in 2012: $43,491 (Individual Income Tax Returns)
Here:
$43,491
State:
$61,346
Salary/wage: $36,788 (reported on 79.2% of returns)
Here:
$36,788
State:
$51,902
(% of AGI for various income ranges: 60.6% for AGIs below $25k, 77.1% for AGIs $25k-50k, 75.8% for AGIs $50k-75k, 71.9% for AGIs $75k-100k, 48.5% for AGIs $100k-200k)
Taxable interest for individuals: $687 (reported on 32.3% of returns)
This zip code:
$687
Pennsylvania:
$1,588
(% of AGI for various income ranges: 1.5% for AGIs below $25k, 0.4% for AGIs $25k-50k, 0.4% for AGIs $50k-75k, 0.3% for AGIs $75k-100k, 0.4% for AGIs $100k-200k)
Ordinary dividends: $1,763 (reported on 19.8% of returns)
Here:
$1,763
State:
$5,827
(% of AGI for various income ranges: 1.2% for AGIs below $25k, 0.7% for AGIs $25k-50k, 0.6% for AGIs $50k-75k, 1.3% for AGIs $75k-100k, 0.6% for AGIs $100k-200k)
Net capital gain/loss in AGI: +$2,200 (reported on 9.4% of returns)
Here:
+$2,200
State:
+$14,495
(% of AGI for various income ranges: 0.4% for AGIs $25k-50k, 2.5% for AGIs $75k-100k)
Profit/loss from business: +$6,264 (reported on 14.6% of returns)
Here:
+$6,264
State:
+$16,268
(% of AGI for various income ranges: 5.9% for AGIs below $25k, 2.2% for AGIs $25k-50k, 3.0% for AGIs $50k-75k, 1.2% for AGIs $75k-100k)
Taxable individual retirement arrangement distribution: $10,900 (reported on 12.5% of returns)
16341:
$10,900
Pennsylvania:
$14,550
(% of AGI for various income ranges: 5.6% for AGIs below $25k, 2.3% for AGIs $25k-50k, 2.7% for AGIs $50k-75k, 8.0% for AGIs $75k-100k)
Total itemized deductions: $15,945 (17% of AGI, reported on 11.5% of returns)
Here:
$15,945
State:
$23,538
Here:
16.9% of AGI
State:
18.4% of AGI
(% of AGI for various income ranges: 3.7% for AGIs $25k-50k, 3.5% for AGIs $50k-75k, 6.6% for AGIs $75k-100k, 5.7% for AGIs $100k-200k)
Charity contributions: $3,814 (reported on 7.3% of returns)
Here:
$3,814
State:
$4,025
Taxes paid: $5,500 (reported on 11.5% of returns)
16341:
$5,500
State:
$9,982
(% of AGI for various income ranges: 0.9% for AGIs $25k-50k, 1.1% for AGIs $50k-75k, 2.1% for AGIs $75k-100k, 2.6% for AGIs $100k-200k)
Earned income credit: $2,220 (reported on 15.6% of returns)
Here:
$2,220
State:
$2,106
(% of AGI for various income ranges: 4.9% for AGIs below $25k, 1.1% for AGIs $25k-50k)
Percentage of individuals using paid preparers for their 2012 taxes: 53.1%
Here:
53%
State:
53%
(% for various income ranges: 46.2% for AGIs below $25k, 51.9% for AGIs $25k-50k, 62.5% for AGIs $50k-75k, 62.5% for AGIs $75k-100k, 66.7% for AGIs $100k-200k)
Averages for the 2004 tax year for zip code 16341, filed in 2005:
Average Adjusted Gross Income (AGI) in 2004: $32,694 (Individual Income Tax Returns)
Here:
$32,694
State:
$48,049
Salary/wage: $29,393 (reported on 80.7% of returns)
Here:
$29,393
State:
$42,646
(% of AGI for various income ranges: 78.4% for AGIs below $10k, 65.7% for AGIs $10k-25k, 74.3% for AGIs $25k-50k, 81.6% for AGIs $50k-75k, 71.9% for AGIs $75k-100k, 59.9% for AGIs over 100k)
Taxable interest for individuals: $1,080 (reported on 48.9% of returns)
This zip code:
$1,080
Pennsylvania:
$1,657
(% of AGI for various income ranges: 7.4% for AGIs below $10k, 2.2% for AGIs $10k-25k, 1.9% for AGIs $25k-50k, 1.1% for AGIs $50k-75k, 0.4% for AGIs $75k-100k, 1.0% for AGIs over 100k)
Taxable dividends: $1,567 (reported on 25.3% of returns)
Here:
$1,567
State:
$3,566
(% of AGI for various income ranges: 3.1% for AGIs below $10k, 1.9% for AGIs $10k-25k, 0.7% for AGIs $25k-50k, 0.4% for AGIs $50k-75k, 0.4% for AGIs $75k-100k, 3.2% for AGIs over 100k)
Net capital gain/loss: +$6,019 (reported on 16.5% of returns)
Here:
+$6,019
State:
+$9,716
(% of AGI for various income ranges: 1.8% for AGIs below $10k, 1.2% for AGIs $10k-25k, 1.8% for AGIs $25k-50k, 1.0% for AGIs $50k-75k, 1.3% for AGIs $75k-100k, 12.6% for AGIs over 100k)
Profit/loss from business: +$4,075 (reported on 16.3% of returns)
Here:
+$4,075
State:
+$14,267
(% of AGI for various income ranges: 4.4% for AGIs below $10k, 6.4% for AGIs $10k-25k, 1.2% for AGIs $25k-50k, 1.9% for AGIs $50k-75k, 0.6% for AGIs $75k-100k)
IRA payment deduction: $2,750 (reported on 2.0% of returns)
16341:
$2,750
Pennsylvania:
$2,903
Total itemized deductions: $14,385 (21% of AGI, reported on 12.5% of returns)
Here:
$14,385
State:
$18,804
Here:
20.8% of AGI
State:
19.5% of AGI
(% of AGI for various income ranges: 3.7% for AGIs $10k-25k, 4.0% for AGIs $25k-50k, 6.6% for AGIs $50k-75k, 6.3% for AGIs $75k-100k, 8.9% for AGIs over 100k)
Charity contributions deductions: $3,278 (5% of AGI, reported on 9.9% of returns)
Here:
$3,278
State:
$3,337
Here:
4.7% of AGI
State:
3.3% of AGI
(% of AGI for various income ranges: 0.7% for AGIs $10k-25k, 0.9% for AGIs $25k-50k, 0.7% for AGIs $50k-75k, 1.5% for AGIs $75k-100k, 1.8% for AGIs over 100k)
Total tax: $3,906 (reported on 73.3% of returns)
16341:
$3,906
State:
$8,008
(% of AGI for various income ranges: 2.7% for AGIs below $10k, 4.3% for AGIs $10k-25k, 6.4% for AGIs $25k-50k, 9.0% for AGIs $50k-75k, 11.3% for AGIs $75k-100k, 16.6% for AGIs over 100k)
Earned income credit: $1,776 (reported on 15.6% of returns)
Here:
$1,776
State:
$1,643
Percentage of individuals using paid preparers for their 2004 taxes: 57.7%
Here:
58%
State:
56%
(% for various income ranges: 51.7% for AGIs below $10k, 60.3% for AGIs $10k-25k, 57.0% for AGIs $25k-50k, 57.1% for AGIs $50k-75k, 65.3% for AGIs $75k-100k, 75.8% for AGIs over 100k)
Household received Food Stamps/SNAP in the past 12 months: 89 Household did not receive Food Stamps/SNAP in the past 12 months: 689
Women who had a birth in the past 12 months: 14 (9 now married, 4 unmarried) Women who did not have a birth in the past 12 months: 297 (141 now married, 155 unmarried)
Housing units in zip code 16341 with a mortgage: 350 (46 second mortgage, 32 both second mortgage and home equity loan) Houses without a mortgage: 99
Median monthly owner costs for units with a mortgage: $1,012 Median monthly owner costs for units without a mortgage: $442
Residents with income below the poverty level in 2022:
This zip code:
13.0%
Whole state:
11.8%
Residents with income below 50% of the poverty level in 2022:
This zip code:
10.1%
Whole state:
6.1%
Median number of rooms in houses and condos:
Here:
6.7
State:
6.8
Median number of rooms in apartments:
Here:
4.6
State:
4.3
Notable locations in this zip code not listed on our city pages
Notable locations in zip code 16341: Cashup (A), Hickory Center (B), Jerusalem Corners (C), Lovell Corners (D), Morrison Corners (E), Rumbaugh Corners (F), Russell Corners (G), Tyrrel Farm Corners (H), Boughton (I), Pleasantville Volunteer Fire Department (J), Pennsylvania Conservation and Natural Resources District 14 Corn Planter Forest (K). Display/hide their locations on the map
Cemeteries: Asbury Chapel Cemetery (1), Fairview Cemetery (2), Jerusalem Corners Cemetery (3), Concord Cemetery (4). Display/hide their locations on the map
Streams, rivers, and creeks: West Pithole Creek (A), Neilltown Creek (B), Husband Run (C), Woodcock Run (D), Simonds Run (E), German Run (F), Funk Run (G), Schoolhouse Run (H), Allender Run (I). Display/hide their locations on the map
Size of family households: 295 2-persons, 102 3-persons, 60 4-persons, 28 5-persons, 7 6-persons, 11 7-or-more-persons
Size of nonfamily households: 247 1-person, 28 2-persons
270 married couples with children.
46 single-parent households (15 men, 31 women).
98.2% of residents of 16341 zip code speak English at home.
0.2% of residents speak Spanish at home (100% very well).
1.1% of residents speak other Indo-European language at home (53% very well, 47% well).
0.1% of residents speak Asian or Pacific Island language at home (100% very well).
Foreign born population: 18 (1.0%) (83.9% of them are naturalized citizens)
This zip code:
1.0%
Whole state:
7.5%
28%Bhutan
11%Sweden
11%Brazil
6%Syria
19%German
17%Irish
14%American
11%English
9%Italian
3%Swedish
2%Scottish
Year of entry for the foreign-born population
32010 or later
112000 to 2009
01990 to 1999
8Before 1990
Facilities with environmental interests located in this zip code:
BELDEN AND BLAKE DAWSON FAC (22811 TITUSVILLE RD in PLEASANTVILLE, PA)
National Pollutant Discharge Elimination System NON-MAJOR (Tracking pollutant discharge elimination systems) - permit Business SIC classification: MIXED, MANUFACTURED, OR LIQUEFIED PETROLEUM GAS PRODUCTION AND/OR DISTRIBUTION Alternative names: BELDEN AND BLAKE CORPORATION
Housing units lacking complete plumbing facilities: 8.2% Housing units lacking complete kitchen facilities: 10.3%
51.2%Utility gas
20.8%Bottled, tank, or LP gas
14.7%Wood
4.8%Electricity
4.8%Fuel oil, kerosene, etc.
2.0%Other fuel
1.2%Coal or coke
0.8%No fuel used
Population in 1990: 2,211.
Place of birth for U.S.-born residents:
This state: 1,601
Northeast: 70
Midwest: 96
South: 31
West: 23
69% of the 16341 zip code residents lived in the same house 5 years ago. Out of people who lived in different houses, 27% lived in this county. Out of people who lived in different counties, 50% lived in Pennsylvania.
96% of the 16341 zip code residents lived in the same house 1 year ago. Out of people who lived in different houses, 48% moved from this county. Out of people who lived in different houses, 56% moved from different county within same state.
Private vs. public school enrollment:
Students in private schools in grades 1 to 8 (elementary and middle school): 66
Here:
32.4%
Pennsylvania:
15.7%
Students in private schools in grades 9 to 12 (high school): 16
Here:
16.0%
Pennsylvania:
13.4%
Students in private undergraduate colleges: 1
Here:
3.6%
Pennsylvania:
39.8%
Occupation by median earnings in the past 12 months ($)
86,436Law enforcement workers including supervisors
66,370Health diagnosing and treating practitioners and other technical occupations
62,301Education, training, and library occupations
54,148Production occupations
52,524Installation, maintenance, and repair occupations
51,667Farming, fishing, and forestry occupations
Top industries in this zip code by the number of employees in 2005:
Mining: Crude Petroleum and Natural Gas Extraction (20-49 employees: 2 establishments, 5-9 employees: 1 establishment, 1-4 employees: 2 establishments)

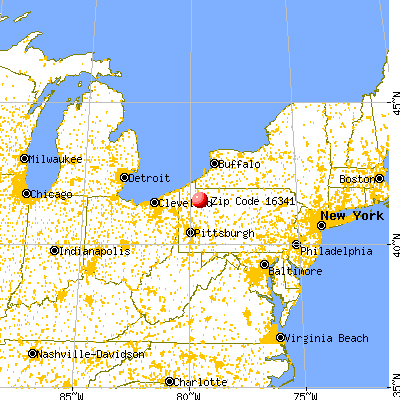


 Nearest zip codes: 16370, 16420, 16301, 16321, 16354, 16344.


