Estimated zip code population in 2022: 1,849 Zip code population in 2010: 1,943 Zip code population in 2000: 2,076
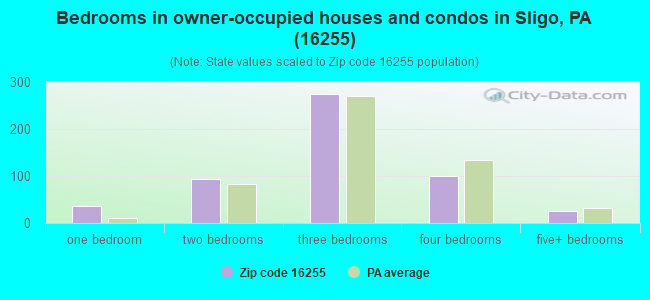
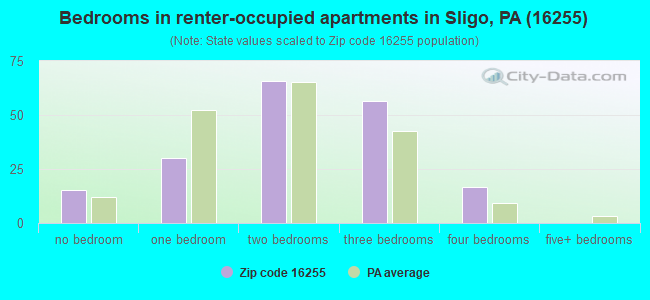
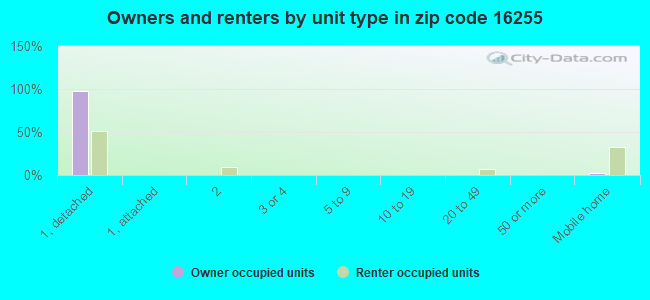
Houses and condos: 838 Renter-occupied apartments: 185
% of renters here:
26%
State:
31%
March 2022 cost of living index in zip code 16255: 90.5 (less than average, U.S. average is 100)
Land area: 40.9 sq. mi. Water area: 0.4 sq. mi.
Population density: 45 people per square mile
(very low).
OSM Map
General Map
Google Map
MSN Map
OSM Map
General Map
Google Map
MSN Map
OSM Map
General Map
Google Map
MSN Map
OSM Map
General Map
Google Map
MSN Map
Please wait while loading the map...
Real estate property taxes paid for housing units in 2022:
This zip code:
1.1% ($1,420)
Pennsylvania:
1.3% ($3,094)
Median real estate property taxes paid for housing units with mortgages in 2022: $1,546 (0.9%) Median real estate property taxes paid for housing units with no mortgage in 2022: $1,354 (1.1%)
Business Search- 14 Million verified businesses
Males: 913
(49.4%)
Females: 936
(50.6%)
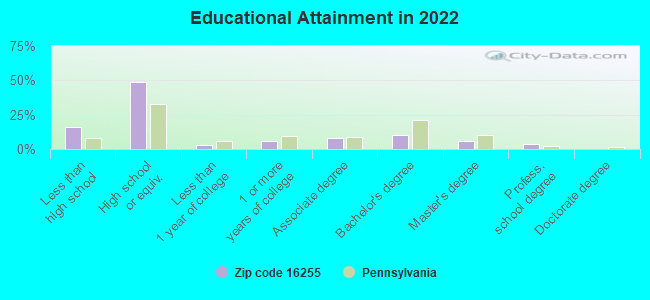
For population 25 years and over in 16255:
High school or higher: 82.4%
Bachelor's degree or higher: 19.0%
Graduate or professional degree: 9.2%
Unemployed: 4.1%
Mean travel time to work (commute): 33.1 minutes
For population 15 years and over in 16255:
Never married: 31.2%
Now married: 49.6%
Separated: 2.4%
Widowed: 8.5%
Divorced: 8.3%
Zip code 16255 compared to state average:
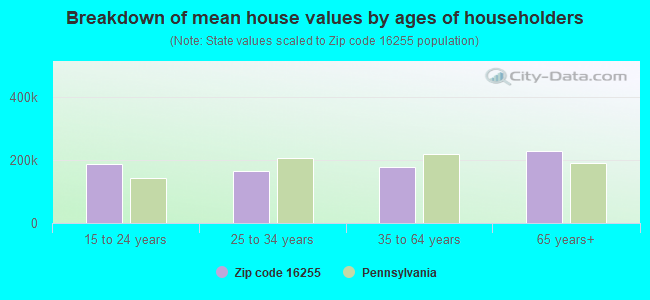
Median house value below state average.
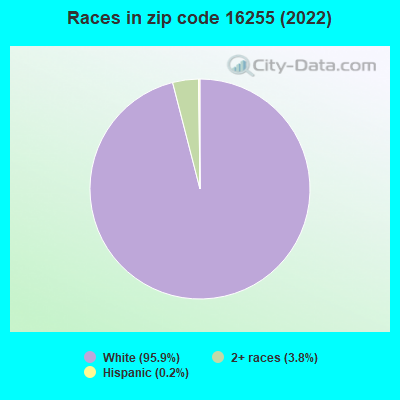
Black race population percentage significantly below state average.
Hispanic race population percentage significantly below state average.
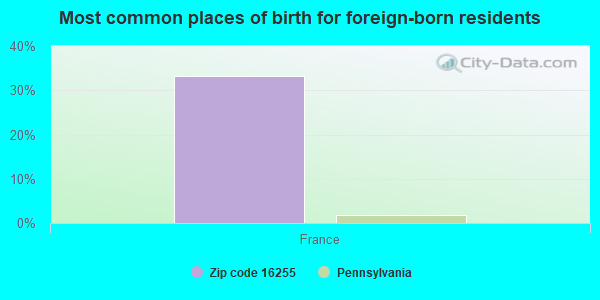
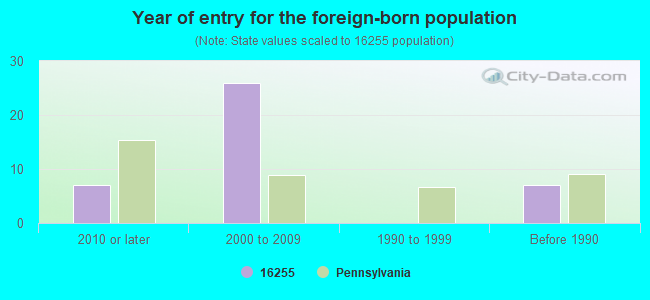
Foreign-born population percentage significantly below state average.
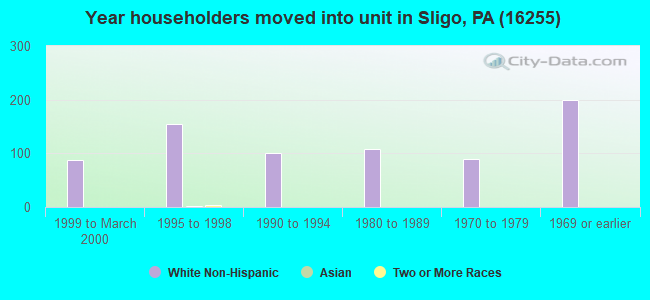
Length of stay since moving in above state average.
Number of college students below state average.
Percentage of population with a bachelor's degree or higher below state average.
Estimated median house/condo value in 2022: $135,014
16255:
$135,014
Pennsylvania:
$245,500
According to our research of Pennsylvania and other state lists, there were 2 registered sex offenders living in 16255 zip code as of May 26, 2024. The ratio of all residents to sex offenders in zip code 16255 is 883 to 1. The ratio of registered sex offenders to all residents in this zip code is lower than the state average.
Median resident age:
This zip code:
44.1 years
Pennsylvania median age:
40.9 years
Average household size:
This zip code:
2.4 people
Pennsylvania:
2.4 people
Averages for the 2020 tax year for zip code 16255, filed in 2021:
Average Adjusted Gross Income (AGI) in 2020: $49,856 (Individual Income Tax Returns)
Here:
$49,856
State:
$75,707
Salary/wage: $44,252 (reported on 75.0% of returns)
Here:
$44,252
State:
$62,806
(% of AGI for various income ranges: 1055.6% for AGIs below $25k, 3367.9% for AGIs $25k-50k, 6331.1% for AGIs $50k-75k, 7488.6% for AGIs $75k-100k, 14400.0% for AGIs $100k-200k)
Taxable interest for individuals: $529 (reported on 40.5% of returns)
This zip code:
$529
Pennsylvania:
$1,633
(% of AGI for various income ranges: 31.1% for AGIs below $25k, 17.9% for AGIs $25k-50k, 48.9% for AGIs $50k-75k, 24.3% for AGIs $75k-100k, 48.3% for AGIs $100k-200k)
Ordinary dividends: $1,993 (reported on 17.9% of returns)
Here:
$1,993
State:
$7,382
(% of AGI for various income ranges: 39.4% for AGIs below $25k, 44.2% for AGIs $25k-50k, 38.9% for AGIs $50k-75k, 85.7% for AGIs $75k-100k, 81.7% for AGIs $100k-200k)
Net capital gain/loss in AGI: +$3,709 (reported on 13.1% of returns)
Here:
+$3,709
State:
+$23,522
(% of AGI for various income ranges: 7.8% for AGIs below $25k, 33.7% for AGIs $25k-50k, 203.3% for AGIs $50k-75k, 245.0% for AGIs $100k-200k)
Profit/loss from business: +$19,767 (reported on 14.3% of returns)
Here:
+$19,767
State:
+$16,274
(% of AGI for various income ranges: 138.9% for AGIs below $25k, 222.6% for AGIs $25k-50k, 453.3% for AGIs $50k-75k, 1844.3% for AGIs $75k-100k)
Taxable individual retirement arrangement distribution: $9,270 (reported on 11.9% of returns)
16255:
$9,270
Pennsylvania:
$18,583
(% of AGI for various income ranges: 112.8% for AGIs below $25k, 123.7% for AGIs $25k-50k, 698.6% for AGIs $75k-100k)
Earned income credit: $2,042 (reported on 14.3% of returns)
Here:
$2,042
State:
$2,100
(% of AGI for various income ranges: 71.7% for AGIs below $25k, 61.1% for AGIs $25k-50k)
Percentage of individuals using paid preparers for their 2020 taxes: 94.0%
Here:
94%
State:
92%
(% for various income ranges: 92.6% for AGIs below $25k, 95.8% for AGIs $25k-50k, 92.9% for AGIs $50k-75k, 100.0% for AGIs $75k-100k, 90.0% for AGIs $100k-200k)
Averages for the 2012 tax year for zip code 16255, filed in 2013:
Average Adjusted Gross Income (AGI) in 2012: $40,749 (Individual Income Tax Returns)
Here:
$40,749
State:
$61,346
Salary/wage: $34,607 (reported on 80.0% of returns)
Here:
$34,607
State:
$51,902
(% of AGI for various income ranges: 69.8% for AGIs below $25k, 72.0% for AGIs $25k-50k, 75.6% for AGIs $50k-75k, 65.5% for AGIs $75k-100k, 55.0% for AGIs $100k-200k)
Taxable interest for individuals: $828 (reported on 34.1% of returns)
This zip code:
$828
Pennsylvania:
$1,588
(% of AGI for various income ranges: 1.6% for AGIs below $25k, 0.7% for AGIs $25k-50k, 0.6% for AGIs $50k-75k, 0.3% for AGIs $75k-100k, 0.6% for AGIs $100k-200k)
Ordinary dividends: $1,800 (reported on 18.8% of returns)
Here:
$1,800
State:
$5,827
(% of AGI for various income ranges: 0.9% for AGIs below $25k, 1.3% for AGIs $25k-50k, 0.8% for AGIs $50k-75k, 1.3% for AGIs $75k-100k)
Net capital gain/loss in AGI: +$4,270 (reported on 11.8% of returns)
Here:
+$4,270
State:
+$14,495
(% of AGI for various income ranges: 8.2% for AGIs $75k-100k)
Profit/loss from business: +$7,917 (reported on 14.1% of returns)
Here:
+$7,917
State:
+$16,268
(% of AGI for various income ranges: 4.8% for AGIs below $25k, 3.3% for AGIs $25k-50k, 5.1% for AGIs $50k-75k)
Taxable individual retirement arrangement distribution: $7,990 (reported on 11.8% of returns)
16255:
$7,990
Pennsylvania:
$14,550
Total itemized deductions: $19,650 (22% of AGI, reported on 11.8% of returns)
Here:
$19,650
State:
$23,538
Here:
21.7% of AGI
State:
18.4% of AGI
(% of AGI for various income ranges: 5.1% for AGIs $25k-50k, 5.6% for AGIs $50k-75k, 8.6% for AGIs $75k-100k, 7.5% for AGIs $100k-200k)
Charity contributions: $4,686 (reported on 8.2% of returns)
Here:
$4,686
State:
$4,025
Taxes paid: $5,680 (reported on 11.8% of returns)
16255:
$5,680
State:
$9,982
(% of AGI for various income ranges: 1.0% for AGIs $25k-50k, 1.6% for AGIs $50k-75k, 2.2% for AGIs $75k-100k, 2.9% for AGIs $100k-200k)
Earned income credit: $1,953 (reported on 17.6% of returns)
Here:
$1,953
State:
$2,106
(% of AGI for various income ranges: 5.1% for AGIs below $25k, 0.9% for AGIs $25k-50k)
Percentage of individuals using paid preparers for their 2012 taxes: 55.3%
Here:
55%
State:
53%
(% for various income ranges: 45.9% for AGIs below $25k, 54.5% for AGIs $25k-50k, 66.7% for AGIs $50k-75k, 66.7% for AGIs $75k-100k, 80.0% for AGIs $100k-200k)
Averages for the 2004 tax year for zip code 16255, filed in 2005:
Average Adjusted Gross Income (AGI) in 2004: $32,127 (Individual Income Tax Returns)
Here:
$32,127
State:
$48,049
Salary/wage: $29,962 (reported on 82.4% of returns)
Here:
$29,962
State:
$42,646
(% of AGI for various income ranges: 73.0% for AGIs below $10k, 72.9% for AGIs $10k-25k, 80.9% for AGIs $25k-50k, 79.2% for AGIs $50k-75k, 74.9% for AGIs $75k-100k, 70.4% for AGIs over 100k)
Taxable interest for individuals: $1,457 (reported on 49.9% of returns)
This zip code:
$1,457
Pennsylvania:
$1,657
(% of AGI for various income ranges: 6.0% for AGIs below $10k, 3.5% for AGIs $10k-25k, 2.1% for AGIs $25k-50k, 1.7% for AGIs $50k-75k, 1.4% for AGIs $75k-100k, 2.3% for AGIs over 100k)
Taxable dividends: $1,429 (reported on 19.6% of returns)
Here:
$1,429
State:
$3,566
(% of AGI for various income ranges: 2.1% for AGIs below $10k, 1.0% for AGIs $10k-25k, 0.9% for AGIs $25k-50k, 0.5% for AGIs $50k-75k, 0.6% for AGIs $75k-100k, 1.4% for AGIs over 100k)
Net capital gain/loss: +$515 (reported on 15.7% of returns)
Here:
+$515
State:
+$9,716
(% of AGI for various income ranges: -1.6% for AGIs below $10k, -0.3% for AGIs $10k-25k, 0.4% for AGIs $25k-50k, 0.5% for AGIs $50k-75k, 0.7% for AGIs over 100k)
Profit/loss from business: +$6,725 (reported on 12.7% of returns)
Here:
+$6,725
State:
+$14,267
(% of AGI for various income ranges: 13.4% for AGIs below $10k, 3.2% for AGIs $10k-25k, 4.3% for AGIs $25k-50k, 1.6% for AGIs $50k-75k)
IRA payment deduction: $2,458 (reported on 2.8% of returns)
16255:
$2,458
Pennsylvania:
$2,903
Total itemized deductions: $14,775 (20% of AGI, reported on 11.9% of returns)
Here:
$14,775
State:
$18,804
Here:
20.0% of AGI
State:
19.5% of AGI
(% of AGI for various income ranges: 3.2% for AGIs $10k-25k, 4.2% for AGIs $25k-50k, 6.6% for AGIs $50k-75k, 7.9% for AGIs $75k-100k, 8.0% for AGIs over 100k)
Charity contributions deductions: $3,277 (4% of AGI, reported on 9.7% of returns)
Here:
$3,277
State:
$3,337
Here:
4.2% of AGI
State:
3.3% of AGI
(% of AGI for various income ranges: 0.4% for AGIs $10k-25k, 0.5% for AGIs $25k-50k, 0.5% for AGIs $50k-75k, 3.0% for AGIs $75k-100k, 1.8% for AGIs over 100k)
Total tax: $4,153 (reported on 68.7% of returns)
16255:
$4,153
State:
$8,008
(% of AGI for various income ranges: 2.7% for AGIs below $10k, 4.0% for AGIs $10k-25k, 6.7% for AGIs $25k-50k, 8.6% for AGIs $50k-75k, 10.4% for AGIs $75k-100k, 19.8% for AGIs over 100k)
Earned income credit: $1,699 (reported on 15.9% of returns)
Here:
$1,699
State:
$1,643
Percentage of individuals using paid preparers for their 2004 taxes: 61.4%
Here:
61%
State:
56%
(% for various income ranges: 55.8% for AGIs below $10k, 58.4% for AGIs $10k-25k, 66.5% for AGIs $25k-50k, 63.1% for AGIs $50k-75k, 63.6% for AGIs $75k-100k, 81.8% for AGIs over 100k)
Household received Food Stamps/SNAP in the past 12 months: 112 Household did not receive Food Stamps/SNAP in the past 12 months: 604
Women who had a birth in the past 12 months: 43 (46 now married, 0 unmarried) Women who did not have a birth in the past 12 months: 344 (140 now married, 203 unmarried)
Housing units in zip code 16255 with a mortgage: 239 (28 second mortgage, 1 home equity loan, 19 both second mortgage and home equity loan) Houses without a mortgage: 13
Median monthly owner costs for units with a mortgage: $1,095 Median monthly owner costs for units without a mortgage: $422
Residents with income below the poverty level in 2022:
This zip code:
13.3%
Whole state:
11.8%
Residents with income below 50% of the poverty level in 2022:
This zip code:
8.1%
Whole state:
6.1%
Median number of rooms in houses and condos:
Here:
7.1
State:
6.8
Median number of rooms in apartments:
Here:
5.2
State:
4.3
Notable locations in this zip code not listed on our city pages
Streams, rivers, and creeks: Brush Run (A), Piney Creek (B), Mineral Run (C), Craggs Run (D), Little Licking Creek (E), Beaver Creek (F), Reids Run (G), Anderson Run (H). Display/hide their locations on the map
In group quarters: 114 (-1 institutionalized population)
Size of family households: 245 2-persons, 76 3-persons, 60 4-persons, 25 5-persons, 37 6-persons, 21 7-or-more-persons
Size of nonfamily households: 220 1-person, 26 2-persons, 4 3-persons
333 married couples with children.
65 single-parent households (29 men, 36 women).
91.0% of residents of 16255 zip code speak English at home.
1.5% of residents speak Spanish at home (100% very well).
7.2% of residents speak other Indo-European language at home (72% very well, 21% well, 7% not well).
Foreign born population: 3 (0.2%) (0.0% of them are naturalized citizens)
:
0.2%
Whole state:
7.5%
33%France
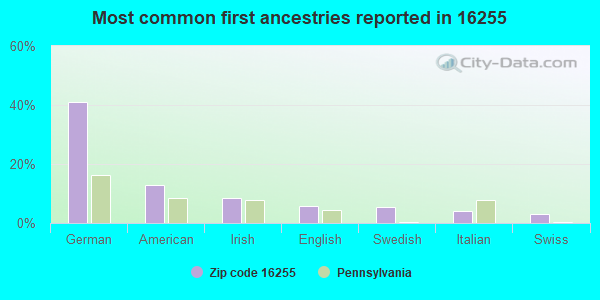
41%German
13%American
8%Irish
6%English
5%Swedish
4%Italian
3%Swiss
Year of entry for the foreign-born population
72010 or later
262000 to 2009
01990 to 1999
7Before 1990
Facilities with environmental interests located in this zip code:
ALLTEL - SLIGO (RTE 68 & 368 in SLIGO, PA)
(Integrated Compliance Information System) - ICIS-HQ-2000-6004, FORMAL ENFORCEMENT ACTION
Housing units lacking complete plumbing facilities: 5.8% Housing units lacking complete kitchen facilities: 9.9%
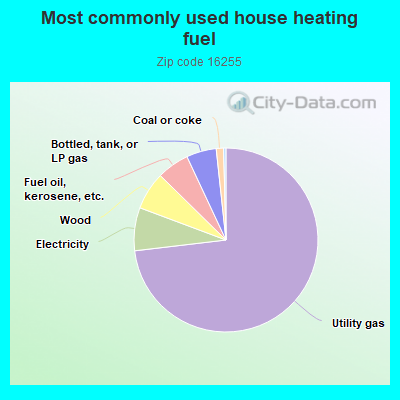
73.5%Utility gas
7.6%Electricity
6.7%Wood
5.7%Fuel oil, kerosene, etc.
5.3%Bottled, tank, or LP gas
1.3%Coal or coke
Population in 1990: 1,213. Population change in the 1990s: +863 (+71.1%).
Place of birth for U.S.-born residents:
This state: 1,534
Northeast: 74
Midwest: 99
South: 71
West: 16
62% of the 16255 zip code residents lived in the same house 5 years ago. Out of people who lived in different houses, 66% lived in this county. Out of people who lived in different counties, 50% lived in Pennsylvania.
96% of the 16255 zip code residents lived in the same house 1 year ago. Out of people who lived in different houses, 51% moved from this county. Out of people who lived in different houses, 49% moved from different county within same state. Out of people who lived in different houses, 4% moved from different state.
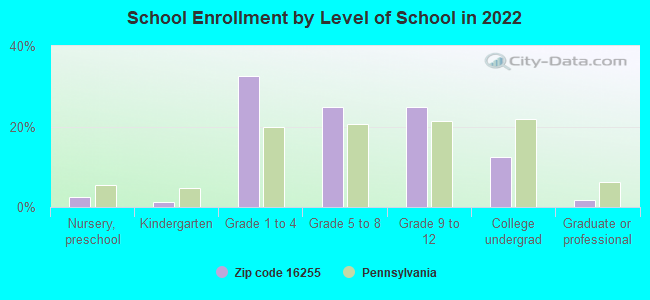
Private vs. public school enrollment:
Students in private schools in grades 1 to 8 (elementary and middle school): 27
Here:
16.2%
Pennsylvania:
15.7%
Students in private schools in grades 9 to 12 (high school): 12
Here:
17.2%
Pennsylvania:
13.4%
Students in private undergraduate colleges: 5
Here:
15.6%
Pennsylvania:
39.8%
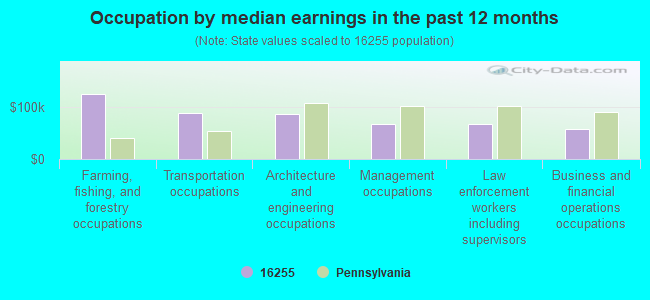
Occupation by median earnings in the past 12 months ($)
125,040Farming, fishing, and forestry occupations
88,762Transportation occupations
86,848Architecture and engineering occupations
67,765Management occupations
66,679Law enforcement workers including supervisors
57,433Business and financial operations occupations
Top industries in this zip code by the number of employees in 2005:
Health Care and Social Assistance: Residential Mental Retardation Facilities (100-249 employees: 1 establishment)
Health Care and Social Assistance: Nursing Care Facilities (100-249: 1)
Mining: Bituminous Coal and Lignite Surface Mining (50-99: 1)
Health Care and Social Assistance: Continuing Care Retirement Communities (10-19: 1)
Construction: Commercial and Institutional Building Construction (10-19: 1)
Other Services (except Public Administration): Labor Unions and Similar Labor Organizations (5-9: 1, 1-4: 2)
Other Services (except Public Administration): Religious Organizations (5-9: 1, 1-4: 2)
91 people in nursing facilities/skilled-nursing facilities
4 people in group homes intended for adults
People in group quarters in 2000:
128 people in nursing homes
Fatal accident statistics in 2013:
Fatal accident count: 2
Vehicles involved in fatal accidents: 3
Fatal accidents caused by drunken drivers: 1
Fatalities: 3
Persons involved in fatal accidents: 5
Pedestrians involved in fatal accidents: 0
Fatal accident statistics in 2012:
Fatal accident count: 1
Vehicles involved in fatal accidents: 1
Fatal accidents caused by drunken drivers: 0
Fatalities: 1
Persons involved in fatal accidents: 3
Pedestrians involved in fatal accidents: 1
2003 - 2018 National Fire Incident Reporting System (NFIRS) incidents
According to the data from the years 2003 - 2018 the average number of fires per year is 6. The highest number of fire incidents - 16 took place in 2016, and the least - 0 in 2010. The data has an increasing trend.
When looking into fire subcategories, the most incidents belonged to: Structure Fires (60.8%), and Outside Fires (20.6%).
Fire incident types reported to NFIRS in Zip Code 16255


 Nearest zip codes: 16213, 16248, 16232, 16254, 16214, 16242.


 According to the data from the years 2003 - 2018 the average number of fires per year is 6. The highest number of fire incidents - 16 took place in 2016, and the least - 0 in 2010. The data has an increasing trend.
 When looking into fire subcategories, the most incidents belonged to: Structure Fires (60.8%), and Outside Fires (20.6%).