Estimated zip code population in 2022: 2,951 Zip code population in 2010: 3,477 Zip code population in 2000: 3,418
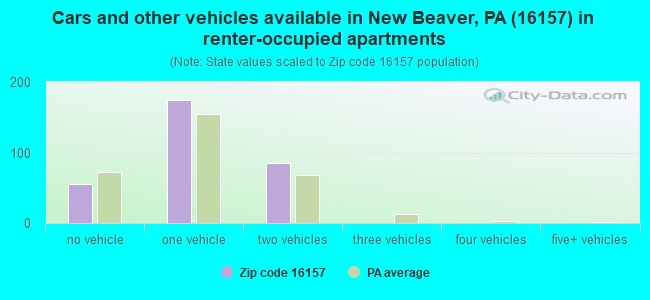
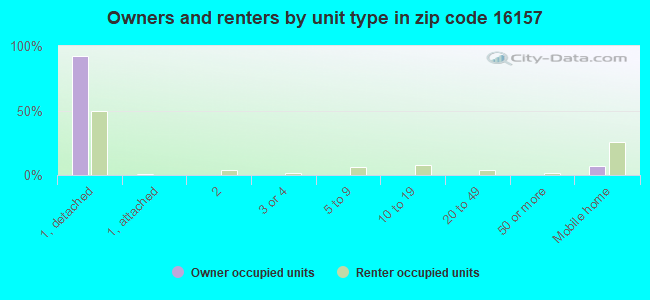
Houses and condos: 1,485 Renter-occupied apartments: 313
% of renters here:
23%
State:
31%
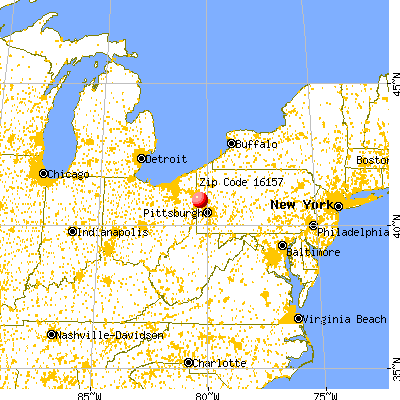
March 2022 cost of living index in zip code 16157: 90.2 (less than average, U.S. average is 100)
Land area: 25.0 sq. mi. Water area: 0.4 sq. mi.
Population density: 118 people per square mile
(very low).
OSM Map
General Map
Google Map
MSN Map
OSM Map
General Map
Google Map
MSN Map
OSM Map
General Map
Google Map
MSN Map
OSM Map
General Map
Google Map
MSN Map
Please wait while loading the map...
Real estate property taxes paid for housing units in 2022:
This zip code:
1.1% ($1,409)
Pennsylvania:
1.3% ($3,094)
Median real estate property taxes paid for housing units with mortgages in 2022: $1,419 (1.0%) Median real estate property taxes paid for housing units with no mortgage in 2022: $1,396 (1.2%)
Business Search- 14 Million verified businesses
Males: 1,458
(49.4%)
Females: 1,492
(50.6%)
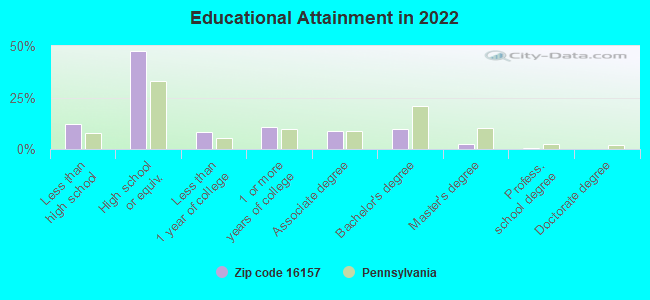
For population 25 years and over in 16157:
High school or higher: 86.7%
Bachelor's degree or higher: 12.7%
Graduate or professional degree: 3.0%
Unemployed: 6.6%
Mean travel time to work (commute): 25.9 minutes
For population 15 years and over in 16157:
Never married: 29.0%
Now married: 51.6%
Separated: 1.1%
Widowed: 7.4%
Divorced: 10.9%
Zip code 16157 compared to state average:
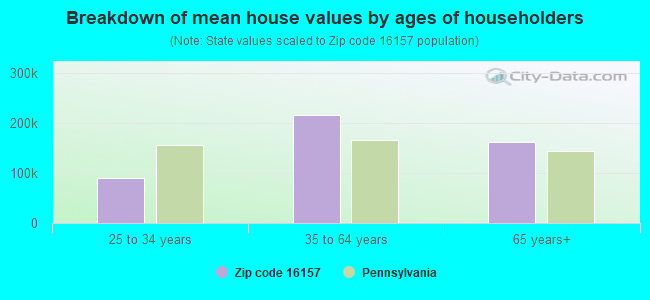
Median house value below state average.
Black race population percentage significantly below state average.
Hispanic race population percentage significantly below state average.
Median age significantly above state average.
Foreign-born population percentage significantly below state average.
Length of stay since moving in significantly above state average.
Percentage of population with a bachelor's degree or higher significantly below state average.
Estimated median house/condo value in 2022: $128,719
16157:
$128,719
Pennsylvania:
$245,500
According to our research of Pennsylvania and other state lists, there was 1 registered sex offender living in 16157 zip code as of May 26, 2024. The ratio of all residents to sex offenders in zip code 16157 is 3,032 to 1. The ratio of registered sex offenders to all residents in this zip code is much lower than the state average.
Median resident age:
This zip code:
51.2 years
Pennsylvania median age:
40.9 years
Average household size:
This zip code:
2.2 people
Pennsylvania:
2.4 people
Averages for the 2020 tax year for zip code 16157, filed in 2021:
Average Adjusted Gross Income (AGI) in 2020: $53,744 (Individual Income Tax Returns)
Here:
$53,744
State:
$75,707
Salary/wage: $48,603 (reported on 79.1% of returns)
Here:
$48,603
State:
$62,806
(% of AGI for various income ranges: 972.1% for AGIs below $25k, 3420.9% for AGIs $25k-50k, 6423.7% for AGIs $50k-75k, 8898.6% for AGIs $75k-100k, 14121.5% for AGIs $100k-200k)
Taxable interest for individuals: $563 (reported on 25.2% of returns)
This zip code:
$563
Pennsylvania:
$1,633
(% of AGI for various income ranges: 16.1% for AGIs below $25k, 15.2% for AGIs $25k-50k, 4.7% for AGIs $50k-75k, 8.6% for AGIs $75k-100k, 76.2% for AGIs $100k-200k)
Ordinary dividends: $1,700 (reported on 17.2% of returns)
Here:
$1,700
State:
$7,382
(% of AGI for various income ranges: 30.5% for AGIs below $25k, 23.6% for AGIs $25k-50k, 14.2% for AGIs $50k-75k, 62.9% for AGIs $75k-100k, 128.5% for AGIs $100k-200k)
Net capital gain/loss in AGI: +$4,030 (reported on 12.3% of returns)
Here:
+$4,030
State:
+$23,522
(% of AGI for various income ranges: 6.8% for AGIs below $25k, 24.2% for AGIs $25k-50k, 22.1% for AGIs $50k-75k, 77.9% for AGIs $75k-100k, 422.3% for AGIs $100k-200k)
Profit/loss from business: +$6,276 (reported on 10.4% of returns)
Here:
+$6,276
State:
+$16,274
(% of AGI for various income ranges: 43.4% for AGIs below $25k, 95.2% for AGIs $25k-50k, 120.0% for AGIs $50k-75k, 22.1% for AGIs $75k-100k, 253.1% for AGIs $100k-200k)
Taxable individual retirement arrangement distribution: $13,825 (reported on 12.3% of returns)
16157:
$13,825
Pennsylvania:
$18,583
(% of AGI for various income ranges: 109.5% for AGIs below $25k, 143.0% for AGIs $25k-50k, 252.1% for AGIs $50k-75k, 297.9% for AGIs $75k-100k, 754.6% for AGIs $100k-200k)
Total itemized deductions: $28,900 (reported on 1.2% of returns)
Here:
$28,900
State:
$34,850
(% of AGI for various income ranges: 412.9% for AGIs $75k-100k)
Charity contributions: $7,850 (reported on 1.2% of returns)
Here:
$7,850
State:
$12,392
(% of AGI for various income ranges: 82.6% for AGIs $50k-75k)
Taxes paid: $6,833 (reported on 1.8% of returns)
16157:
$6,833
State:
$8,200
(% of AGI for various income ranges: 146.4% for AGIs $75k-100k)
Earned income credit: $1,700 (reported on 11.7% of returns)
Here:
$1,700
State:
$2,100
(% of AGI for various income ranges: 55.8% for AGIs below $25k, 33.6% for AGIs $25k-50k)
Percentage of individuals using paid preparers for their 2020 taxes: 93.9%
Here:
94%
State:
92%
(% for various income ranges: 94.4% for AGIs below $25k, 95.2% for AGIs $25k-50k, 92.3% for AGIs $50k-75k, 94.7% for AGIs $75k-100k, 94.7% for AGIs $100k-200k, 66.7% for AGIs over 200k)
Averages for the 2012 tax year for zip code 16157, filed in 2013:
Average Adjusted Gross Income (AGI) in 2012: $43,875 (Individual Income Tax Returns)
Here:
$43,875
State:
$61,346
Salary/wage: $39,874 (reported on 82.5% of returns)
Here:
$39,874
State:
$51,902
(% of AGI for various income ranges: 66.8% for AGIs below $25k, 78.6% for AGIs $25k-50k, 78.6% for AGIs $50k-75k, 83.3% for AGIs $75k-100k, 66.9% for AGIs $100k-200k)
Taxable interest for individuals: $402 (reported on 32.2% of returns)
This zip code:
$402
Pennsylvania:
$1,588
(% of AGI for various income ranges: 1.1% for AGIs below $25k, 0.4% for AGIs $25k-50k, 0.2% for AGIs $50k-75k, 0.1% for AGIs $100k-200k)
Ordinary dividends: $1,132 (reported on 18.1% of returns)
Here:
$1,132
State:
$5,827
(% of AGI for various income ranges: 1.4% for AGIs below $25k, 0.6% for AGIs $25k-50k, 0.4% for AGIs $50k-75k, 0.3% for AGIs $75k-100k, 0.2% for AGIs $100k-200k)
Net capital gain/loss in AGI: +$347 (reported on 8.8% of returns)
Here:
+$347
State:
+$14,495
(% of AGI for various income ranges: 0.2% for AGIs $25k-50k, 0.4% for AGIs $50k-75k)
Profit/loss from business: +$7,211 (reported on 10.5% of returns)
Here:
+$7,211
State:
+$16,268
(% of AGI for various income ranges: 4.4% for AGIs below $25k, 2.8% for AGIs $25k-50k, 1.6% for AGIs $50k-75k, 1.8% for AGIs $75k-100k)
Taxable individual retirement arrangement distribution: $8,342 (reported on 11.1% of returns)
16157:
$8,342
Pennsylvania:
$14,550
(% of AGI for various income ranges: 4.4% for AGIs below $25k, 2.1% for AGIs $25k-50k, 3.3% for AGIs $50k-75k, 1.7% for AGIs $100k-200k)
Total itemized deductions: $16,587 (18% of AGI, reported on 17.5% of returns)
Here:
$16,587
State:
$23,538
Here:
18.4% of AGI
State:
18.4% of AGI
(% of AGI for various income ranges: 4.7% for AGIs below $25k, 4.5% for AGIs $25k-50k, 5.2% for AGIs $50k-75k, 7.4% for AGIs $75k-100k, 9.6% for AGIs $100k-200k)
Charity contributions: $2,600 (reported on 11.7% of returns)
Here:
$2,600
State:
$4,025
(% of AGI for various income ranges: 0.6% for AGIs $25k-50k, 0.6% for AGIs $50k-75k, 0.9% for AGIs $75k-100k, 0.9% for AGIs $100k-200k)
Taxes paid: $6,133 (reported on 17.5% of returns)
16157:
$6,133
State:
$9,982
(% of AGI for various income ranges: 0.9% for AGIs below $25k, 1.2% for AGIs $25k-50k, 1.7% for AGIs $50k-75k, 2.9% for AGIs $75k-100k, 4.3% for AGIs $100k-200k)
Earned income credit: $1,848 (reported on 14.6% of returns)
Here:
$1,848
State:
$2,106
(% of AGI for various income ranges: 4.2% for AGIs below $25k, 0.8% for AGIs $25k-50k)
Percentage of individuals using paid preparers for their 2012 taxes: 63.2%
Here:
63%
State:
53%
(% for various income ranges: 60.6% for AGIs below $25k, 61.9% for AGIs $25k-50k, 66.7% for AGIs $50k-75k, 64.7% for AGIs $75k-100k, 71.4% for AGIs $100k-200k)
Averages for the 2004 tax year for zip code 16157, filed in 2005:
Average Adjusted Gross Income (AGI) in 2004: $35,356 (Individual Income Tax Returns)
Here:
$35,356
State:
$48,049
Salary/wage: $34,541 (reported on 85.4% of returns)
Here:
$34,541
State:
$42,646
(% of AGI for various income ranges: 90.2% for AGIs below $10k, 73.9% for AGIs $10k-25k, 83.9% for AGIs $25k-50k, 89.1% for AGIs $50k-75k, 85.3% for AGIs $75k-100k, 74.9% for AGIs over 100k)
Taxable interest for individuals: $744 (reported on 47.0% of returns)
This zip code:
$744
Pennsylvania:
$1,657
(% of AGI for various income ranges: 5.8% for AGIs below $10k, 2.4% for AGIs $10k-25k, 1.0% for AGIs $25k-50k, 0.5% for AGIs $50k-75k, 0.3% for AGIs $75k-100k, 0.7% for AGIs over 100k)
Taxable dividends: $826 (reported on 20.6% of returns)
Here:
$826
State:
$3,566
(% of AGI for various income ranges: 3.4% for AGIs below $10k, 1.1% for AGIs $10k-25k, 0.5% for AGIs $25k-50k, 0.2% for AGIs $50k-75k, 0.1% for AGIs $75k-100k, 0.5% for AGIs over 100k)
Net capital gain/loss: +$1,035 (reported on 12.3% of returns)
Here:
+$1,035
State:
+$9,716
(% of AGI for various income ranges: -2.6% for AGIs below $10k, -0.5% for AGIs $10k-25k, 0.4% for AGIs $25k-50k, 0.1% for AGIs $50k-75k, 0.0% for AGIs $75k-100k, 2.7% for AGIs over 100k)
Profit/loss from business: +$6,074 (reported on 9.2% of returns)
Here:
+$6,074
State:
+$14,267
(% of AGI for various income ranges: -6.9% for AGIs below $10k, 3.7% for AGIs $10k-25k, 2.6% for AGIs $25k-50k, 1.8% for AGIs $50k-75k, 0.0% for AGIs $75k-100k)
IRA payment deduction: $2,196 (reported on 2.8% of returns)
16157:
$2,196
Pennsylvania:
$2,903
Total itemized deductions: $14,007 (21% of AGI, reported on 17.4% of returns)
Here:
$14,007
State:
$18,804
Here:
20.8% of AGI
State:
19.5% of AGI
(% of AGI for various income ranges: 3.2% for AGIs $10k-25k, 4.6% for AGIs $25k-50k, 7.9% for AGIs $50k-75k, 10.5% for AGIs $75k-100k, 10.5% for AGIs over 100k)
Charity contributions deductions: $1,868 (3% of AGI, reported on 13.6% of returns)
Here:
$1,868
State:
$3,337
Here:
2.6% of AGI
State:
3.3% of AGI
(% of AGI for various income ranges: 0.1% for AGIs $10k-25k, 0.4% for AGIs $25k-50k, 0.7% for AGIs $50k-75k, 1.1% for AGIs $75k-100k, 1.6% for AGIs over 100k)
Total tax: $4,083 (reported on 73.9% of returns)
16157:
$4,083
State:
$8,008
(% of AGI for various income ranges: 1.7% for AGIs below $10k, 3.7% for AGIs $10k-25k, 7.0% for AGIs $25k-50k, 8.5% for AGIs $50k-75k, 10.5% for AGIs $75k-100k, 15.6% for AGIs over 100k)
Earned income credit: $1,572 (reported on 13.7% of returns)
Here:
$1,572
State:
$1,643
Percentage of individuals using paid preparers for their 2004 taxes: 61.5%
Here:
61%
State:
56%
(% for various income ranges: 54.8% for AGIs below $10k, 59.3% for AGIs $10k-25k, 61.9% for AGIs $25k-50k, 68.1% for AGIs $50k-75k, 66.0% for AGIs $75k-100k, 73.6% for AGIs over 100k)
Household received Food Stamps/SNAP in the past 12 months: 264 Household did not receive Food Stamps/SNAP in the past 12 months: 1,086
Women who had a birth in the past 12 months: 6 (1 now married, 4 unmarried) Women who did not have a birth in the past 12 months: 594 (261 now married, 332 unmarried)
Housing units in zip code 16157 with a mortgage: 569 (72 second mortgage, 65 both second mortgage and home equity loan) Houses without a mortgage: 60
Median monthly owner costs for units with a mortgage: $1,100 Median monthly owner costs for units without a mortgage: $455
Residents with income below the poverty level in 2022:
This zip code:
13.6%
Whole state:
11.8%
Residents with income below 50% of the poverty level in 2022:
This zip code:
9.4%
Whole state:
6.1%
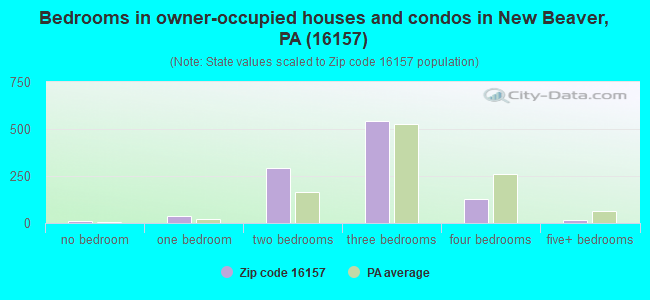
Median number of rooms in houses and condos:
Here:
5.9
State:
6.8
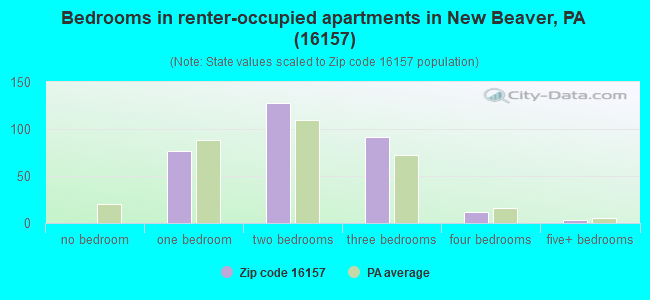
Median number of rooms in apartments:
Here:
4.4
State:
4.3
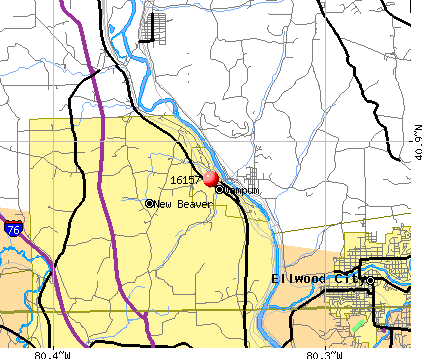
Notable locations in this zip code not listed on our city pages
Notable locations in zip code 16157: Del-Mar Golf Course (A), Stonecrest Golf Course (B), New Beaver Borough Volunteer Fire Department (C), Wampum Volunteer Fire Department (D), Chewton Volunteer Fire Department (E). Display/hide their locations on the map
In group quarters: 20 (-1 institutionalized population)
Size of family households: 415 2-persons, 189 3-persons, 143 4-persons, 46 5-persons, 3 6-persons, 8 7-or-more-persons
Size of nonfamily households: 445 1-person, 95 2-persons
244 married couples with children.
51 single-parent households (12 men, 39 women).
97.3% of residents of 16157 zip code speak English at home.
0.9% of residents speak Spanish at home (100% very well).
0.3% of residents speak other Indo-European language at home (60% very well, 20% well, 20% not well).
0.8% of residents speak Asian or Pacific Island language at home (42% very well, 33% not well, 25% not at all).
0.2% of residents speak other language at home (100% very well).
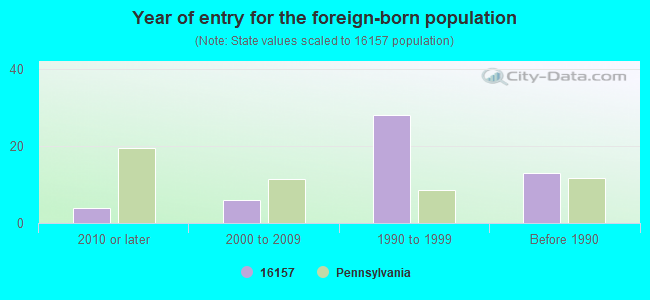
Foreign born population: 56 (1.9%) (91.1% of them are naturalized citizens)
This zip code:
1.9%
Whole state:
7.5%
36%Thailand
27%Honduras
7%Malaysia
5%Sweden
5%Greece
4%Bolivia
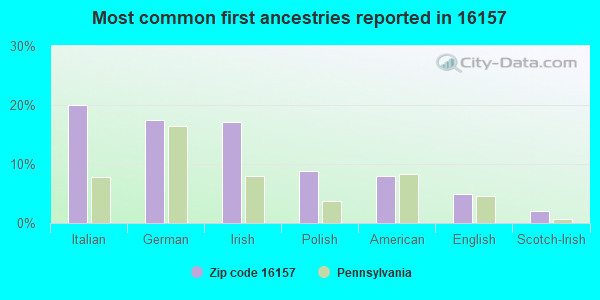
20%Italian
18%German
17%Irish
9%Polish
8%American
5%English
2%Scotch-Irish
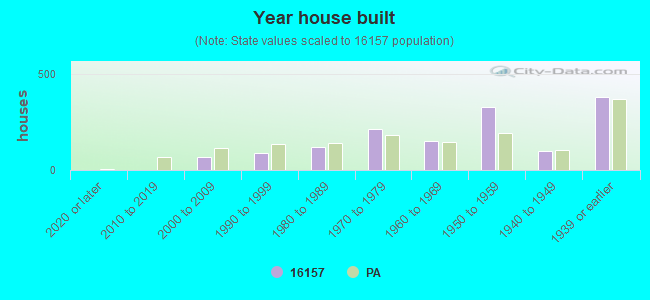
Year of entry for the foreign-born population
42010 or later
62000 to 2009
281990 to 1999
13Before 1990
Facilities with environmental interests located in this zip code:
ALARON MFG (PARK STREET POINT INDUSTRIAL PARK in WAMPUM, PA)
STATE MASTER (Pennsylvania database) - AFS-57-0756665-1, AIR PROGRAM, RCRIS-PAD987400157, HAZARDOUS WASTE PROGRAM, RCRIS-PAD987400167, (Resource Conservation and Recovery Act (tracking hazardous waste)) Business SIC classification: BUSINESS SERVICES Organizations: ALARON CORP (CONTACT/OWNER)
Alternative names: ALARON CORP, ALARON CORP MFG
Housing units lacking complete plumbing facilities: 5.0% Housing units lacking complete kitchen facilities: 2.7%
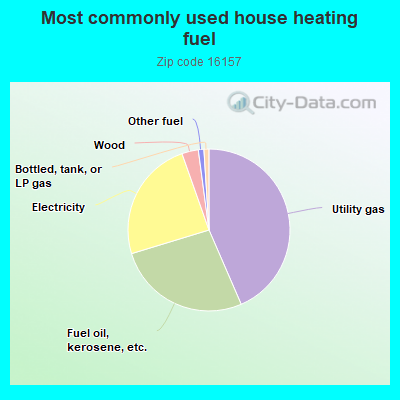
43.5%Utility gas
26.8%Fuel oil, kerosene, etc.
24.3%Electricity
3.3%Wood
1.1%Other fuel
1.0%Bottled, tank, or LP gas
Population in 1990: 5,466.
Place of birth for U.S.-born residents:
This state: 2,543
Northeast: 29
Midwest: 161
South: 92
West: 49
77% of the 16157 zip code residents lived in the same house 5 years ago. Out of people who lived in different houses, 65% lived in this county. Out of people who lived in different counties, 50% lived in Pennsylvania.
93% of the 16157 zip code residents lived in the same house 1 year ago. Out of people who lived in different houses, 41% moved from this county. Out of people who lived in different houses, 48% moved from different county within same state. Out of people who lived in different houses, 11% moved from different state.
Private vs. public school enrollment:
Students in private schools in grades 1 to 8 (elementary and middle school): 27
Here:
19.8%
Pennsylvania:
15.7%
Students in private schools in grades 9 to 12 (high school): 47
Here:
33.4%
Pennsylvania:
13.4%
Students in private undergraduate colleges: 18
Here:
24.7%
Pennsylvania:
39.8%
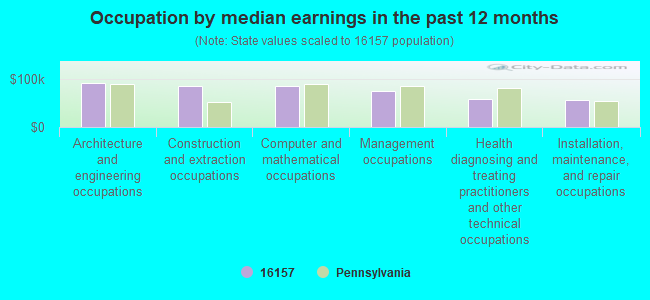
Occupation by median earnings in the past 12 months ($)
91,129Architecture and engineering occupations
85,713Construction and extraction occupations
85,515Computer and mathematical occupations
75,294Management occupations
57,694Health diagnosing and treating practitioners and other technical occupations
54,908Installation, maintenance, and repair occupations
Top industries in this zip code by the number of employees in 2005:
Administrative and Support and Waste Management and Remediation Services: Solid Waste Collection (20-49 employees: 1 establishment)
Arts, Entertainment, and Recreation: Racetracks (20-49: 1)
Management of Companies and Enterprises: Corporate, Subsidiary, and Regional Managing Offices (10-19: 1)
Mining: Bituminous Coal and Lignite Surface Mining (10-19: 1)
People in group quarters in 2000:
19 people in nursing homes
Fatal accident statistics in 2014:
Fatal accident count: 1
Vehicles involved in fatal accidents: 1
Fatal accidents caused by drunken drivers: 0
Fatalities: 1
Persons involved in fatal accidents: 1
Pedestrians involved in fatal accidents: 0
Fatal accident statistics in 2011:
Fatal accident count: 1
Vehicles involved in fatal accidents: 1
Fatal accidents caused by drunken drivers: 0
Fatalities: 1
Persons involved in fatal accidents: 1
Pedestrians involved in fatal accidents: 0
Home Mortgage Disclosure Act Aggregated Statistics For Year 2009 (Based on 2 partial tracts)
A) FHA, FSA/RHS & VA Home Purchase Loans
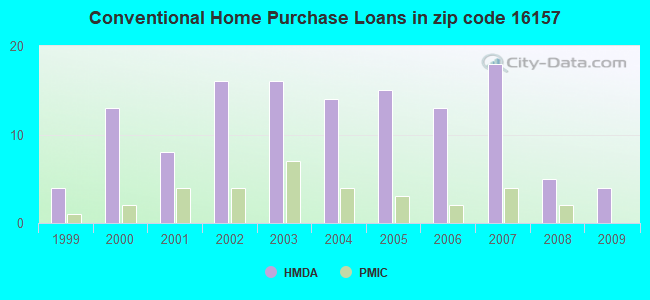
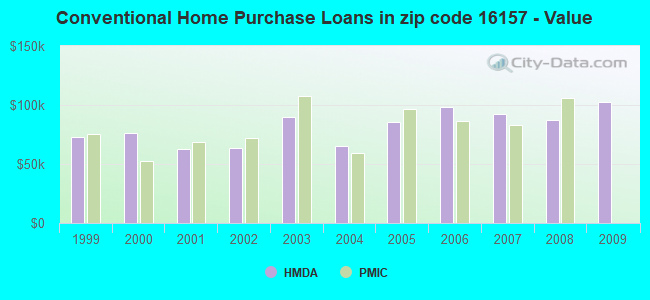
B) Conventional Home Purchase Loans
C) Refinancings
D) Home Improvement Loans
F) Non-occupant Loans on < 5 Family Dwellings (A B C & D)
G) Loans On Manufactured Home Dwelling (A B C & D)
Number
Average Value
Number
Average Value
Number
Average Value
Number
Average Value
Number
Average Value
Number
Average Value
LOANS ORIGINATED
3
$95,447
4
$102,228
16
$95,521
4
$39,290
1
$16,280
1
$92,570
APPLICATIONS APPROVED, NOT ACCEPTED
0
$0
1
$37,640
3
$102,567
0
$0
1
$20,340
0
$0
APPLICATIONS DENIED
1
$43,230
1
$59,000
14
$138,484
3
$50,860
1
$37,130
0
$0
APPLICATIONS WITHDRAWN
0
$0
0
$0
6
$97,652
2
$7,630
0
$0
1
$19,330
FILES CLOSED FOR INCOMPLETENESS
0
$0
0
$0
2
$110,875
1
$45,770
0
$0
0
$0
Aggregated Statistics For Year 2008 (Based on 2 partial tracts)
A) FHA, FSA/RHS & VA Home Purchase Loans
B) Conventional Home Purchase Loans
C) Refinancings
D) Home Improvement Loans
F) Non-occupant Loans on < 5 Family Dwellings (A B C & D)
G) Loans On Manufactured Home Dwelling (A B C & D)
Number
Average Value
Number
Average Value
Number
Average Value
Number
Average Value
Number
Average Value
Number
Average Value
LOANS ORIGINATED
3
$83,410
5
$87,580
11
$116,515
5
$27,160
1
$635,750
0
$0
APPLICATIONS APPROVED, NOT ACCEPTED
0
$0
1
$50,860
1
$30,520
1
$7,630
0
$0
0
$0
APPLICATIONS DENIED
1
$40,180
4
$46,538
24
$119,140
5
$59,710
0
$0
3
$55,607
APPLICATIONS WITHDRAWN
1
$75,270
1
$52,390
5
$115,350
0
$0
0
$0
0
$0
FILES CLOSED FOR INCOMPLETENESS
0
$0
1
$34,080
1
$78,830
0
$0
0
$0
0
$0
Aggregated Statistics For Year 2007 (Based on 2 partial tracts)
A) FHA, FSA/RHS & VA Home Purchase Loans
B) Conventional Home Purchase Loans
C) Refinancings
D) Home Improvement Loans
F) Non-occupant Loans on < 5 Family Dwellings (A B C & D)
G) Loans On Manufactured Home Dwelling (A B C & D)
Number
Average Value
Number
Average Value
Number
Average Value
Number
Average Value
Number
Average Value
Number
Average Value
LOANS ORIGINATED
3
$85,443
18
$92,198
22
$79,896
9
$34,077
2
$67,390
7
$78,106
APPLICATIONS APPROVED, NOT ACCEPTED
0
$0
4
$72,985
4
$143,425
2
$69,425
0
$0
1
$85,440
APPLICATIONS DENIED
1
$92,570
5
$58,998
31
$96,683
3
$58,827
0
$0
3
$81,883
APPLICATIONS WITHDRAWN
0
$0
1
$40,690
6
$88,073
1
$54,420
0
$0
0
$0
FILES CLOSED FOR INCOMPLETENESS
0
$0
1
$70,190
1
$68,660
0
$0
0
$0
0
$0
Aggregated Statistics For Year 2006 (Based on 2 partial tracts)
A) FHA, FSA/RHS & VA Home Purchase Loans
B) Conventional Home Purchase Loans
C) Refinancings
D) Home Improvement Loans
F) Non-occupant Loans on < 5 Family Dwellings (A B C & D)
G) Loans On Manufactured Home Dwelling (A B C & D)
Number
Average Value
Number
Average Value
Number
Average Value
Number
Average Value
Number
Average Value
Number
Average Value
LOANS ORIGINATED
2
$93,075
13
$98,629
25
$63,351
10
$28,787
3
$71,883
5
$55,844
APPLICATIONS APPROVED, NOT ACCEPTED
0
$0
3
$116,810
2
$106,550
1
$17,800
0
$0
1
$68,150
APPLICATIONS DENIED
1
$68,150
7
$88,933
27
$77,496
3
$76,967
3
$62,050
3
$73,577
APPLICATIONS WITHDRAWN
0
$0
2
$73,745
12
$94,176
2
$59,760
1
$49,840
0
$0
FILES CLOSED FOR INCOMPLETENESS
0
$0
1
$93,580
4
$79,722
0
$0
1
$32,550
1
$51,880
Aggregated Statistics For Year 2005 (Based on 2 partial tracts)
A) FHA, FSA/RHS & VA Home Purchase Loans
B) Conventional Home Purchase Loans
C) Refinancings
D) Home Improvement Loans
F) Non-occupant Loans on < 5 Family Dwellings (A B C & D)
G) Loans On Manufactured Home Dwelling (A B C & D)
Number
Average Value
Number
Average Value
Number
Average Value
Number
Average Value
Number
Average Value
Number
Average Value
LOANS ORIGINATED
4
$78,070
15
$85,309
26
$74,001
8
$40,688
2
$31,535
5
$67,236
APPLICATIONS APPROVED, NOT ACCEPTED
0
$0
1
$68,150
7
$88,133
1
$74,260
1
$22,890
1
$40,180
APPLICATIONS DENIED
0
$0
6
$42,128
26
$87,362
6
$31,278
1
$1,020
6
$52,725
APPLICATIONS WITHDRAWN
1
$16,280
1
$15,770
15
$81,715
2
$51,875
1
$16,280
1
$58,490
FILES CLOSED FOR INCOMPLETENESS
0
$0
0
$0
1
$45,770
0
$0
0
$0
0
$0
Aggregated Statistics For Year 2004 (Based on 2 partial tracts)
A) FHA, FSA/RHS & VA Home Purchase Loans
B) Conventional Home Purchase Loans
C) Refinancings
D) Home Improvement Loans
F) Non-occupant Loans on < 5 Family Dwellings (A B C & D)
G) Loans On Manufactured Home Dwelling (A B C & D)
Number
Average Value
Number
Average Value
Number
Average Value
Number
Average Value
Number
Average Value
Number
Average Value
LOANS ORIGINATED
1
$93,580
14
$65,101
28
$94,454
13
$23,395
2
$86,970
1
$49,840
APPLICATIONS APPROVED, NOT ACCEPTED
0
$0
2
$87,225
6
$88,073
3
$46,283
0
$0
1
$50,350
APPLICATIONS DENIED
2
$60,015
6
$45,690
26
$86,971
8
$28,228
1
$1,530
6
$52,810
APPLICATIONS WITHDRAWN
0
$0
2
$87,735
12
$88,284
1
$17,290
0
$0
1
$60,010
FILES CLOSED FOR INCOMPLETENESS
0
$0
1
$12,710
8
$84,682
0
$0
1
$42,720
0
$0
Aggregated Statistics For Year 2003 (Based on 2 partial tracts)
A) FHA, FSA/RHS & VA Home Purchase Loans
B) Conventional Home Purchase Loans
C) Refinancings
D) Home Improvement Loans
F) Non-occupant Loans on < 5 Family Dwellings (A B C & D)
Number
Average Value
Number
Average Value
Number
Average Value
Number
Average Value
Number
Average Value
LOANS ORIGINATED
1
$110,370
16
$90,181
58
$88,654
15
$39,196
2
$26,445
APPLICATIONS APPROVED, NOT ACCEPTED
0
$0
4
$59,632
9
$72,391
3
$27,293
0
$0
APPLICATIONS DENIED
0
$0
8
$65,291
43
$73,995
7
$22,741
2
$110,365
APPLICATIONS WITHDRAWN
0
$0
3
$50,690
15
$87,242
2
$27,975
1
$27,460
FILES CLOSED FOR INCOMPLETENESS
1
$56,450
0
$0
4
$83,920
1
$8,650
0
$0
Aggregated Statistics For Year 2002 (Based on 2 partial tracts)
A) FHA, FSA/RHS & VA Home Purchase Loans
B) Conventional Home Purchase Loans
C) Refinancings
D) Home Improvement Loans
F) Non-occupant Loans on < 5 Family Dwellings (A B C & D)
Number
Average Value
Number
Average Value
Number
Average Value
Number
Average Value
Number
Average Value
LOANS ORIGINATED
2
$85,700
16
$63,226
38
$75,594
6
$22,293
0
$0
APPLICATIONS APPROVED, NOT ACCEPTED
1
$40,690
4
$60,650
14
$57,472
1
$9,150
0
$0
APPLICATIONS DENIED
0
$0
4
$40,560
39
$75,234
5
$25,024
2
$60,780
APPLICATIONS WITHDRAWN
0
$0
1
$93,580
14
$96,816
2
$8,140
0
$0
FILES CLOSED FOR INCOMPLETENESS
0
$0
1
$30,520
7
$121,556
0
$0
0
$0
Aggregated Statistics For Year 2001 (Based on 2 partial tracts)
A) FHA, FSA/RHS & VA Home Purchase Loans
B) Conventional Home Purchase Loans
C) Refinancings
D) Home Improvement Loans
F) Non-occupant Loans on < 5 Family Dwellings (A B C & D)
Number
Average Value
Number
Average Value
Number
Average Value
Number
Average Value
Number
Average Value
LOANS ORIGINATED
1
$44,250
8
$62,368
42
$66,966
14
$16,966
1
$42,720
APPLICATIONS APPROVED, NOT ACCEPTED
1
$36,620
4
$70,440
10
$58,896
4
$31,152
0
$0
APPLICATIONS DENIED
1
$40,180
5
$52,894
26
$64,397
7
$37,200
0
$0
APPLICATIONS WITHDRAWN
0
$0
1
$71,710
9
$71,826
1
$12,710
0
$0
FILES CLOSED FOR INCOMPLETENESS
0
$0
0
$0
4
$82,520
0
$0
0
$0
Aggregated Statistics For Year 2000 (Based on 2 partial tracts)
A) FHA, FSA/RHS & VA Home Purchase Loans
B) Conventional Home Purchase Loans
C) Refinancings
D) Home Improvement Loans
F) Non-occupant Loans on < 5 Family Dwellings (A B C & D)
Number
Average Value
Number
Average Value
Number
Average Value
Number
Average Value
Number
Average Value
LOANS ORIGINATED
5
$68,356
13
$76,134
14
$55,764
7
$31,824
3
$74,933
APPLICATIONS APPROVED, NOT ACCEPTED
1
$32,040
6
$74,933
2
$36,110
3
$14,580
1
$22,890
APPLICATIONS DENIED
1
$57,980
10
$40,281
9
$57,923
4
$16,530
0
$0
APPLICATIONS WITHDRAWN
1
$41,200
1
$43,230
3
$62,050
3
$11,527
0
$0
FILES CLOSED FOR INCOMPLETENESS
0
$0
0
$0
2
$75,525
1
$5,090
0
$0
Aggregated Statistics For Year 1999 (Based on 1 full and 1 partial tracts)
A) FHA, FSA/RHS & VA Home Purchase Loans
B) Conventional Home Purchase Loans
C) Refinancings
D) Home Improvement Loans
F) Non-occupant Loans on < 5 Family Dwellings (A B C & D)


 Nearest zip codes: 16160, 16136, 16141, 16117, 16101, 16102.