Estimated zip code population in 2022: 2,262 Zip code population in 2010: 2,624 Zip code population in 2000: 2,440
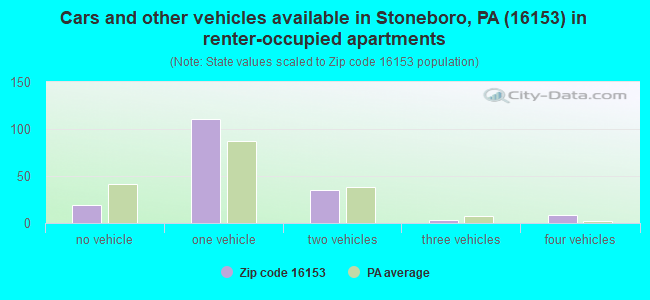
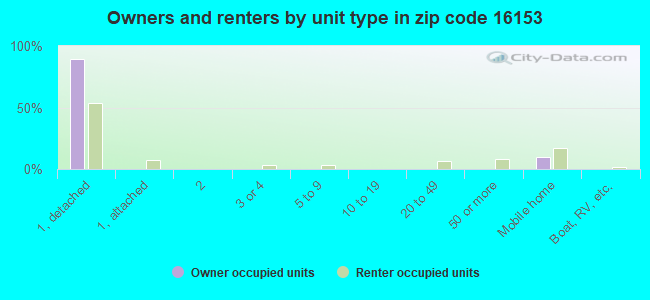
Houses and condos: 1,075 Renter-occupied apartments: 175
% of renters here:
19%
State:
31%
March 2022 cost of living index in zip code 16153: 91.3 (less than average, U.S. average is 100)
Land area: 43.2 sq. mi. Water area: 0.2 sq. mi.
Population density: 52 people per square mile
(very low).
OSM Map
General Map
Google Map
MSN Map
OSM Map
General Map
Google Map
MSN Map
OSM Map
General Map
Google Map
MSN Map
OSM Map
General Map
Google Map
MSN Map
Please wait while loading the map...
Real estate property taxes paid for housing units in 2022:
This zip code:
0.8% ($1,269)
Pennsylvania:
1.3% ($3,094)
Median real estate property taxes paid for housing units with mortgages in 2022: $1,415 (0.9%) Median real estate property taxes paid for housing units with no mortgage in 2022: $1,145 (0.9%)
Business Search- 14 Million verified businesses
Males: 1,231
(54.4%)
Females: 1,031
(45.6%)
For population 25 years and over in 16153:
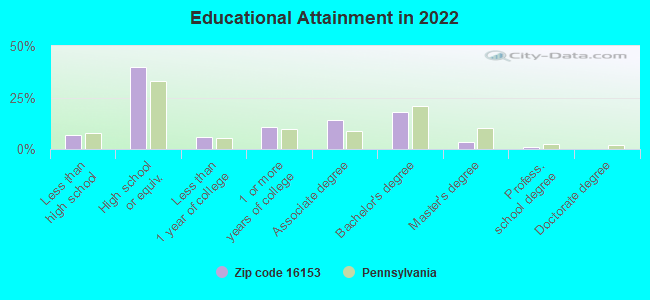
High school or higher: 91.9%
Bachelor's degree or higher: 22.2%
Graduate or professional degree: 4.7%
Unemployed: 1.5%
Mean travel time to work (commute): 27.9 minutes
For population 15 years and over in 16153:
Never married: 27.3%
Now married: 52.5%
Separated: 1.8%
Widowed: 5.0%
Divorced: 13.4%
Zip code 16153 compared to state average:
Median house value below state average.
Unemployed percentage below state average.
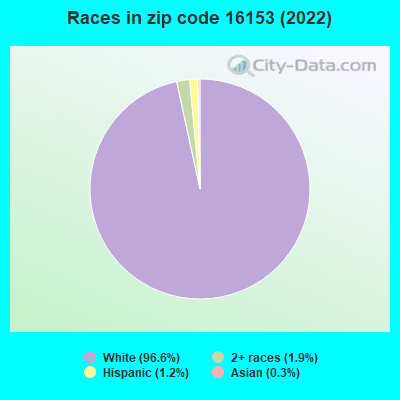
Black race population percentage significantly below state average.
Hispanic race population percentage significantly below state average.
Foreign-born population percentage significantly below state average.
Renting percentage below state average.
Length of stay since moving in significantly above state average.
Percentage of population with a bachelor's degree or higher below state average.
Estimated median house/condo value in 2022: $151,185
16153:
$151,185
Pennsylvania:
$245,500
According to our research of Pennsylvania and other state lists, there were 3 registered sex offenders living in 16153 zip code as of May 23, 2024. The ratio of all residents to sex offenders in zip code 16153 is 839 to 1. The ratio of registered sex offenders to all residents in this zip code is lower than the state average.
Median resident age:
This zip code:
40.8 years
Pennsylvania median age:
40.9 years
Average household size:
This zip code:
2.4 people
Pennsylvania:
2.4 people
Averages for the 2020 tax year for zip code 16153, filed in 2021:
Average Adjusted Gross Income (AGI) in 2020: $56,702 (Individual Income Tax Returns)
Here:
$56,702
State:
$75,707
Salary/wage: $46,232 (reported on 73.3% of returns)
Here:
$46,232
State:
$62,806
(% of AGI for various income ranges: 1003.3% for AGIs below $25k, 3235.2% for AGIs $25k-50k, 5755.7% for AGIs $50k-75k, 7308.9% for AGIs $75k-100k, 15552.0% for AGIs $100k-200k)
Taxable interest for individuals: $856 (reported on 30.0% of returns)
This zip code:
$856
Pennsylvania:
$1,633
(% of AGI for various income ranges: 26.2% for AGIs below $25k, 16.8% for AGIs $25k-50k, 15.7% for AGIs $50k-75k, 56.7% for AGIs $75k-100k, 130.0% for AGIs $100k-200k)
Ordinary dividends: $2,340 (reported on 20.8% of returns)
Here:
$2,340
State:
$7,382
(% of AGI for various income ranges: 34.6% for AGIs below $25k, 30.8% for AGIs $25k-50k, 69.3% for AGIs $50k-75k, 43.3% for AGIs $75k-100k, 289.0% for AGIs $100k-200k)
Net capital gain/loss in AGI: +$13,676 (reported on 17.5% of returns)
Here:
+$13,676
State:
+$23,522
(% of AGI for various income ranges: 18.3% for AGIs below $25k, 54.8% for AGIs $25k-50k, 44.3% for AGIs $50k-75k, 134.4% for AGIs $75k-100k, 2508.0% for AGIs $100k-200k)
Profit/loss from business: +$15,194 (reported on 14.2% of returns)
Here:
+$15,194
State:
+$16,274
(% of AGI for various income ranges: 268.8% for AGIs below $25k, 251.2% for AGIs $25k-50k, 475.0% for AGIs $50k-75k, 645.0% for AGIs $100k-200k)
Taxable individual retirement arrangement distribution: $13,553 (reported on 14.2% of returns)
16153:
$13,553
Pennsylvania:
$18,583
(% of AGI for various income ranges: 106.7% for AGIs below $25k, 148.4% for AGIs $25k-50k, 500.0% for AGIs $50k-75k, 977.0% for AGIs $100k-200k)
Total itemized deductions: $27,300 (reported on 1.7% of returns)
Here:
$27,300
State:
$34,850
(% of AGI for various income ranges: 218.4% for AGIs $25k-50k)
Taxes paid: $7,300 (reported on 1.7% of returns)
16153:
$7,300
State:
$8,200
(% of AGI for various income ranges: 58.4% for AGIs $25k-50k)
Earned income credit: $1,893 (reported on 11.7% of returns)
Here:
$1,893
State:
$2,100
(% of AGI for various income ranges: 66.7% for AGIs below $25k, 42.0% for AGIs $25k-50k)
Percentage of individuals using paid preparers for their 2020 taxes: 90.0%
Here:
90%
State:
92%
(% for various income ranges: 87.2% for AGIs below $25k, 88.2% for AGIs $25k-50k, 94.7% for AGIs $50k-75k, 91.7% for AGIs $75k-100k, 92.9% for AGIs $100k-200k, 100.0% for AGIs over 200k)
Averages for the 2012 tax year for zip code 16153, filed in 2013:
Average Adjusted Gross Income (AGI) in 2012: $47,337 (Individual Income Tax Returns)
Here:
$47,337
State:
$61,346
Salary/wage: $37,710 (reported on 77.8% of returns)
Here:
$37,710
State:
$51,902
(% of AGI for various income ranges: 63.2% for AGIs below $25k, 69.9% for AGIs $25k-50k, 71.2% for AGIs $50k-75k, 67.3% for AGIs $75k-100k, 46.7% for AGIs $100k-200k)
Taxable interest for individuals: $572 (reported on 37.3% of returns)
This zip code:
$572
Pennsylvania:
$1,588
(% of AGI for various income ranges: 1.3% for AGIs below $25k, 0.7% for AGIs $25k-50k, 0.2% for AGIs $50k-75k, 0.2% for AGIs $75k-100k, 0.3% for AGIs $100k-200k)
Ordinary dividends: $2,112 (reported on 19.8% of returns)
Here:
$2,112
State:
$5,827
(% of AGI for various income ranges: 1.9% for AGIs below $25k, 1.1% for AGIs $25k-50k, 0.5% for AGIs $50k-75k, 1.2% for AGIs $75k-100k, 0.5% for AGIs $100k-200k)
Net capital gain/loss in AGI: +$2,962 (reported on 12.7% of returns)
Here:
+$2,962
State:
+$14,495
(% of AGI for various income ranges: 0.9% for AGIs $25k-50k, 0.9% for AGIs $50k-75k, 1.0% for AGIs $75k-100k, 0.8% for AGIs $100k-200k)
Profit/loss from business: +$14,650 (reported on 15.9% of returns)
Here:
+$14,650
State:
+$16,268
(% of AGI for various income ranges: 8.8% for AGIs below $25k, 6.5% for AGIs $25k-50k, 4.5% for AGIs $50k-75k, 10.0% for AGIs $75k-100k)
Taxable individual retirement arrangement distribution: $7,938 (reported on 12.7% of returns)
16153:
$7,938
Pennsylvania:
$14,550
(% of AGI for various income ranges: 3.4% for AGIs below $25k, 2.3% for AGIs $25k-50k, 2.3% for AGIs $50k-75k, 4.7% for AGIs $75k-100k)
Total itemized deductions: $17,319 (16% of AGI, reported on 12.7% of returns)
Here:
$17,319
State:
$23,538
Here:
16.4% of AGI
State:
18.4% of AGI
(% of AGI for various income ranges: 5.5% for AGIs $25k-50k, 4.1% for AGIs $50k-75k, 5.3% for AGIs $75k-100k, 5.7% for AGIs $100k-200k)
Charity contributions: $4,317 (reported on 9.5% of returns)
Here:
$4,317
State:
$4,025
(% of AGI for various income ranges: 0.6% for AGIs $25k-50k, 0.9% for AGIs $50k-75k, 1.1% for AGIs $75k-100k, 1.2% for AGIs $100k-200k)
Taxes paid: $5,931 (reported on 12.7% of returns)
16153:
$5,931
State:
$9,982
(% of AGI for various income ranges: 0.9% for AGIs $25k-50k, 1.1% for AGIs $50k-75k, 1.8% for AGIs $75k-100k, 2.8% for AGIs $100k-200k)
Earned income credit: $1,859 (reported on 13.5% of returns)
Here:
$1,859
State:
$2,106
(% of AGI for various income ranges: 3.4% for AGIs below $25k, 0.9% for AGIs $25k-50k)
Percentage of individuals using paid preparers for their 2012 taxes: 53.2%
Here:
53%
State:
53%
(% for various income ranges: 50.0% for AGIs below $25k, 53.1% for AGIs $25k-50k, 50.0% for AGIs $50k-75k, 58.3% for AGIs $75k-100k, 70.0% for AGIs $100k-200k)
Averages for the 2004 tax year for zip code 16153, filed in 2005:
Average Adjusted Gross Income (AGI) in 2004: $36,962 (Individual Income Tax Returns)
Here:
$36,962
State:
$48,049
Salary/wage: $33,821 (reported on 82.2% of returns)
Here:
$33,821
State:
$42,646
(% of AGI for various income ranges: 75.7% for AGIs below $10k, 63.7% for AGIs $10k-25k, 81.0% for AGIs $25k-50k, 82.3% for AGIs $50k-75k, 80.9% for AGIs $75k-100k, 56.9% for AGIs over 100k)
Taxable interest for individuals: $839 (reported on 49.8% of returns)
This zip code:
$839
Pennsylvania:
$1,657
(% of AGI for various income ranges: 5.5% for AGIs below $10k, 2.5% for AGIs $10k-25k, 1.3% for AGIs $25k-50k, 0.4% for AGIs $50k-75k, 0.7% for AGIs $75k-100k, 1.0% for AGIs over 100k)
Taxable dividends: $1,495 (reported on 24.3% of returns)
Here:
$1,495
State:
$3,566
(% of AGI for various income ranges: 6.7% for AGIs below $10k, 1.4% for AGIs $10k-25k, 0.8% for AGIs $25k-50k, 0.6% for AGIs $50k-75k, 0.5% for AGIs $75k-100k, 1.2% for AGIs over 100k)
Net capital gain/loss: +$2,984 (reported on 15.6% of returns)
Here:
+$2,984
State:
+$9,716
(% of AGI for various income ranges: 2.7% for AGIs below $10k, 0.7% for AGIs $10k-25k, 1.0% for AGIs $25k-50k, 1.2% for AGIs $50k-75k, 0.2% for AGIs $75k-100k, 2.9% for AGIs over 100k)
Profit/loss from business: +$12,554 (reported on 18.7% of returns)
Here:
+$12,554
State:
+$14,267
(% of AGI for various income ranges: 6.8% for AGIs below $10k, 11.2% for AGIs $10k-25k, 4.7% for AGIs $25k-50k, 3.9% for AGIs $50k-75k, 6.7% for AGIs $75k-100k, 9.3% for AGIs over 100k)
IRA payment deduction: $2,488 (reported on 3.4% of returns)
16153:
$2,488
Pennsylvania:
$2,903
Total itemized deductions: $14,204 (19% of AGI, reported on 16.4% of returns)
Here:
$14,204
State:
$18,804
Here:
18.9% of AGI
State:
19.5% of AGI
(% of AGI for various income ranges: 3.5% for AGIs $10k-25k, 4.4% for AGIs $25k-50k, 7.1% for AGIs $50k-75k, 9.8% for AGIs $75k-100k, 7.7% for AGIs over 100k)
Charity contributions deductions: $3,611 (5% of AGI, reported on 13.9% of returns)
Here:
$3,611
State:
$3,337
Here:
4.6% of AGI
State:
3.3% of AGI
(% of AGI for various income ranges: 0.5% for AGIs $10k-25k, 0.8% for AGIs $25k-50k, 1.2% for AGIs $50k-75k, 2.1% for AGIs $75k-100k, 2.5% for AGIs over 100k)
Total tax: $4,753 (reported on 76.4% of returns)
16153:
$4,753
State:
$8,008
(% of AGI for various income ranges: 3.3% for AGIs below $10k, 4.4% for AGIs $10k-25k, 6.8% for AGIs $25k-50k, 8.6% for AGIs $50k-75k, 11.0% for AGIs $75k-100k, 20.0% for AGIs over 100k)
Earned income credit: $1,378 (reported on 12.4% of returns)
Here:
$1,378
State:
$1,643
Percentage of individuals using paid preparers for their 2004 taxes: 56.2%
Here:
56%
State:
56%
(% for various income ranges: 49.8% for AGIs below $10k, 59.2% for AGIs $10k-25k, 54.4% for AGIs $25k-50k, 57.0% for AGIs $50k-75k, 61.0% for AGIs $75k-100k, 75.6% for AGIs over 100k)
Household received Food Stamps/SNAP in the past 12 months: 148 Household did not receive Food Stamps/SNAP in the past 12 months: 795
Women who had a birth in the past 12 months: 11 (12 now married, 0 unmarried) Women who did not have a birth in the past 12 months: 451 (206 now married, 244 unmarried)
Housing units in zip code 16153 with a mortgage: 399 (42 second mortgage, 39 both second mortgage and home equity loan) Houses without a mortgage: 21
Median monthly owner costs for units with a mortgage: $1,042 Median monthly owner costs for units without a mortgage: $428
Residents with income below the poverty level in 2022:
This zip code:
14.1%
Whole state:
11.8%
Residents with income below 50% of the poverty level in 2022:
This zip code:
6.0%
Whole state:
6.1%
Median number of rooms in houses and condos:
Here:
6.2
State:
6.8
Median number of rooms in apartments:
Here:
6.0
State:
4.3
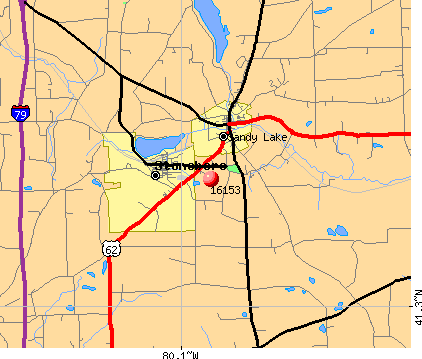
Notable locations in this zip code not listed on our city pages
Notable locations in zip code 16153: Fiddlers Green (A), Wesleyan Campground (B), Woods Corners (C), Carpenter Corners (D), Stoneboro Volunteer Fire Department (E). Display/hide their locations on the map
Size of family households: 258 2-persons, 121 3-persons, 109 4-persons, 34 5-persons, 26 6-persons, 28 7-or-more-persons
Size of nonfamily households: 281 1-person, 65 2-persons, 18 3-persons
376 married couples with children.
145 single-parent households (54 men, 91 women).
93.3% of residents of 16153 zip code speak English at home.
5.8% of residents speak other Indo-European language at home (79% very well, 19% well, 2% not well).
0.2% of residents speak Asian or Pacific Island language at home (100% very well).
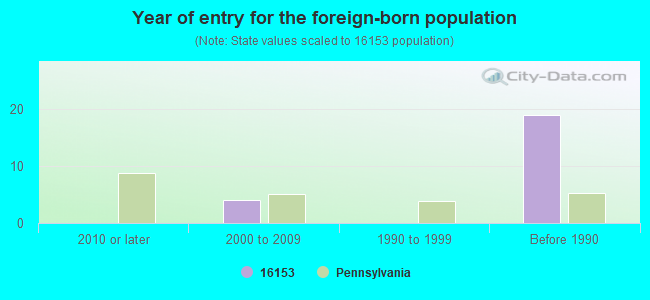
Foreign born population: 21 (0.9%) (90.4% of them are naturalized citizens)
This zip code:
0.9%
Whole state:
7.5%
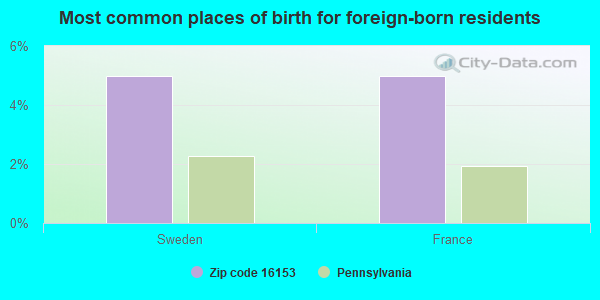
5%Sweden
5%France
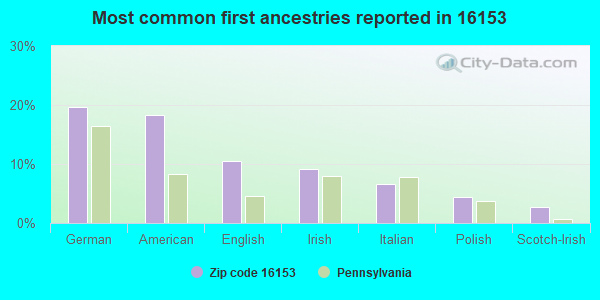
20%German
18%American
11%English
9%Irish
7%Italian
4%Polish
3%Scotch-Irish
Year of entry for the foreign-born population
02010 or later
42000 to 2009
01990 to 1999
19Before 1990
Facilities with environmental interests located in this zip code:
BRUCE & CHRISTINE HENDERSON (328 LYONS RD in STONEBORO, PA)
National Pollutant Discharge Elimination System NON-MAJOR (Tracking pollutant discharge elimination systems) - permit Business SIC classification: OPERATORS OF DWELLINGS OTHER THAN APARTMENT BUILDINGS Alternative names: HENDERSON, BRUCE & CHRISTINE
Housing units lacking complete plumbing facilities: 3.2% Housing units lacking complete kitchen facilities: 3.2%
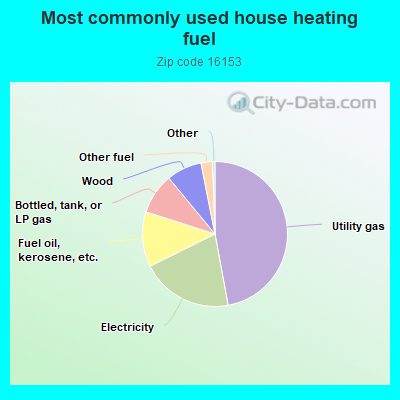
47.2%Utility gas
20.6%Electricity
12.3%Fuel oil, kerosene, etc.
9.1%Bottled, tank, or LP gas
7.9%Wood
2.6%Other fuel
Population in 1990: 2,249. Population change in the 1990s: +191 (+8.5%).
Place of birth for U.S.-born residents:
This state: 2,037
Northeast: 13
Midwest: 68
South: 76
West: 21
73% of the 16153 zip code residents lived in the same house 5 years ago. Out of people who lived in different houses, 67% lived in this county. Out of people who lived in different counties, 50% lived in Pennsylvania.
92% of the 16153 zip code residents lived in the same house 1 year ago. Out of people who lived in different houses, 77% moved from this county. Out of people who lived in different houses, 12% moved from different county within same state. Out of people who lived in different houses, 8% moved from different state. Out of people who lived in different houses, 2% moved from abroad.
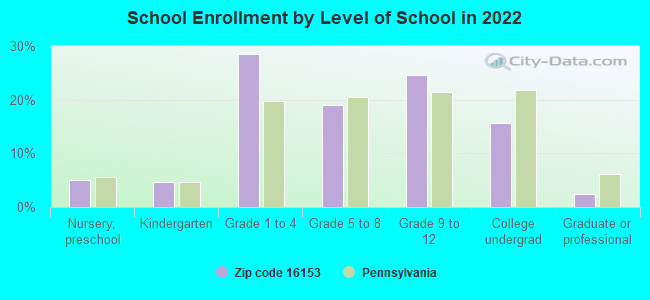
Private vs. public school enrollment:
Students in private schools in grades 1 to 8 (elementary and middle school): 55
Here:
22.8%
Pennsylvania:
15.7%
Students in private schools in grades 9 to 12 (high school): 24
Here:
19.0%
Pennsylvania:
13.4%
Students in private undergraduate colleges: 31
Here:
38.4%
Pennsylvania:
39.8%
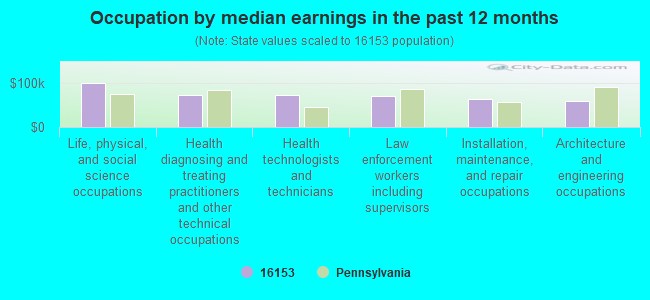
Occupation by median earnings in the past 12 months ($)
98,986Life, physical, and social science occupations
72,603Health diagnosing and treating practitioners and other technical occupations
70,891Health technologists and technicians
70,189Law enforcement workers including supervisors
62,041Installation, maintenance, and repair occupations
58,714Architecture and engineering occupations
Top industries in this zip code by the number of employees in 2005:
Wholesale Trade: Farm and Garden Machinery and Equipment Merchant Wholesalers (20-49 employees: 1 establishment)
Other Services (except Public Administration): Religious Organizations (10-19: 1, 1-4: 5)
Mining: Construction Sand and Gravel Mining (10-19: 1)
Wholesale Trade: Other Construction Material Merchant Wholesalers (5-9: 1)
Utilities: Natural Gas Distribution (5-9: 1)
Fatal accident statistics in 2012:
Fatal accident count: 1
Vehicles involved in fatal accidents: 1
Fatal accidents caused by drunken drivers: 1
Fatalities: 1
Persons involved in fatal accidents: 2
Pedestrians involved in fatal accidents: 0
Fatal accident statistics in 2011:
Fatal accident count: 2
Vehicles involved in fatal accidents: 4
Fatal accidents caused by drunken drivers: 1
Fatalities: 2
Persons involved in fatal accidents: 5
Pedestrians involved in fatal accidents: 0
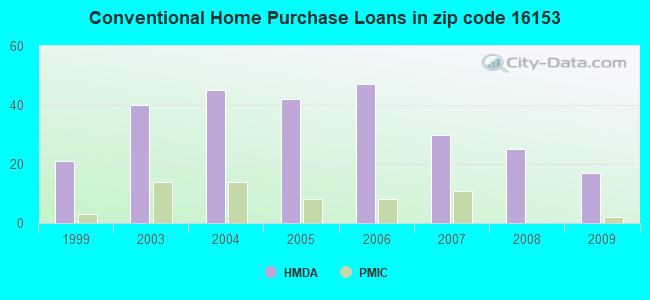
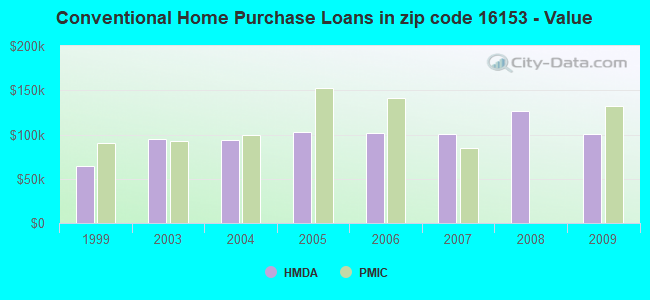
Home Mortgage Disclosure Act Aggregated Statistics For Year 2009 (Based on 4 partial tracts)
A) FHA, FSA/RHS & VA Home Purchase Loans
B) Conventional Home Purchase Loans
C) Refinancings
D) Home Improvement Loans
F) Non-occupant Loans on < 5 Family Dwellings (A B C & D)
G) Loans On Manufactured Home Dwelling (A B C & D)
Number
Average Value
Number
Average Value
Number
Average Value
Number
Average Value
Number
Average Value
Number
Average Value
LOANS ORIGINATED
8
$112,748
17
$100,335
81
$110,792
15
$34,348
6
$97,302
10
$52,317
APPLICATIONS APPROVED, NOT ACCEPTED
1
$83,830
1
$84,610
6
$140,158
2
$6,115
1
$50,380
0
$0
APPLICATIONS DENIED
1
$155,660
3
$94,553
28
$123,162
7
$35,327
0
$0
2
$73,325
APPLICATIONS WITHDRAWN
1
$171,050
3
$66,757
9
$128,496
0
$0
0
$0
0
$0
FILES CLOSED FOR INCOMPLETENESS
0
$0
0
$0
3
$153,510
1
$23,320
0
$0
0
$0
Aggregated Statistics For Year 2008 (Based on 4 partial tracts)
A) FHA, FSA/RHS & VA Home Purchase Loans
B) Conventional Home Purchase Loans
C) Refinancings
D) Home Improvement Loans
F) Non-occupant Loans on < 5 Family Dwellings (A B C & D)
G) Loans On Manufactured Home Dwelling (A B C & D)
Number
Average Value
Number
Average Value
Number
Average Value
Number
Average Value
Number
Average Value
Number
Average Value
LOANS ORIGINATED
8
$95,255
25
$126,256
46
$121,250
31
$33,906
7
$135,319
6
$42,313
APPLICATIONS APPROVED, NOT ACCEPTED
1
$35,870
2
$215,440
7
$109,549
1
$8,470
1
$284,680
1
$40,350
APPLICATIONS DENIED
1
$143,110
7
$102,336
40
$111,152
14
$31,580
2
$147,850
5
$58,238
APPLICATIONS WITHDRAWN
2
$95,510
3
$123,607
9
$144,446
1
$50,380
0
$0
0
$0
FILES CLOSED FOR INCOMPLETENESS
0
$0
0
$0
1
$201,940
0
$0
0
$0
0
$0
Aggregated Statistics For Year 2007 (Based on 4 partial tracts)
A) FHA, FSA/RHS & VA Home Purchase Loans
B) Conventional Home Purchase Loans
C) Refinancings
D) Home Improvement Loans
F) Non-occupant Loans on < 5 Family Dwellings (A B C & D)
G) Loans On Manufactured Home Dwelling (A B C & D)
Number
Average Value
Number
Average Value
Number
Average Value
Number
Average Value
Number
Average Value
Number
Average Value
LOANS ORIGINATED
3
$67,130
30
$100,397
61
$87,896
33
$31,729
4
$58,865
8
$35,612
APPLICATIONS APPROVED, NOT ACCEPTED
0
$0
5
$134,436
9
$116,904
5
$45,626
1
$308,280
2
$44,675
APPLICATIONS DENIED
0
$0
10
$73,412
51
$94,251
16
$31,106
3
$75,483
6
$39,955
APPLICATIONS WITHDRAWN
0
$0
4
$121,502
21
$123,713
1
$69,680
1
$30,060
0
$0
FILES CLOSED FOR INCOMPLETENESS
0
$0
3
$77,633
4
$118,930
0
$0
0
$0
0
$0
Aggregated Statistics For Year 2006 (Based on 4 partial tracts)
A) FHA, FSA/RHS & VA Home Purchase Loans
B) Conventional Home Purchase Loans
C) Refinancings
D) Home Improvement Loans
F) Non-occupant Loans on < 5 Family Dwellings (A B C & D)
G) Loans On Manufactured Home Dwelling (A B C & D)
Number
Average Value
Number
Average Value
Number
Average Value
Number
Average Value
Number
Average Value
Number
Average Value
LOANS ORIGINATED
4
$94,318
47
$101,986
66
$80,384
32
$29,983
9
$122,840
10
$57,721
APPLICATIONS APPROVED, NOT ACCEPTED
0
$0
4
$94,185
15
$101,271
5
$52,008
1
$119,370
4
$41,625
APPLICATIONS DENIED
0
$0
15
$81,486
64
$95,103
20
$42,277
1
$83,740
12
$56,857
APPLICATIONS WITHDRAWN
1
$77,910
5
$107,200
32
$99,780
1
$57,160
0
$0
1
$48,690
FILES CLOSED FOR INCOMPLETENESS
0
$0
1
$168,320
3
$100,580
1
$33,620
0
$0
0
$0
Aggregated Statistics For Year 2005 (Based on 4 partial tracts)
A) FHA, FSA/RHS & VA Home Purchase Loans
B) Conventional Home Purchase Loans
C) Refinancings
D) Home Improvement Loans
F) Non-occupant Loans on < 5 Family Dwellings (A B C & D)
G) Loans On Manufactured Home Dwelling (A B C & D)
Number
Average Value
Number
Average Value
Number
Average Value
Number
Average Value
Number
Average Value
Number
Average Value
LOANS ORIGINATED
3
$63,840
42
$102,300
75
$78,308
32
$28,400
9
$72,162
7
$51,250
APPLICATIONS APPROVED, NOT ACCEPTED
0
$0
4
$93,372
10
$108,882
6
$37,635
1
$560
1
$131,970
APPLICATIONS DENIED
1
$35,870
17
$72,156
93
$93,204
16
$41,627
5
$27,076
15
$53,741
APPLICATIONS WITHDRAWN
1
$78,750
9
$119,097
39
$109,278
2
$121,385
1
$178,400
0
$0
FILES CLOSED FOR INCOMPLETENESS
0
$0
2
$61,135
8
$136,674
0
$0
0
$0
0
$0
Aggregated Statistics For Year 2004 (Based on 4 partial tracts)
A) FHA, FSA/RHS & VA Home Purchase Loans
B) Conventional Home Purchase Loans
C) Refinancings
D) Home Improvement Loans
F) Non-occupant Loans on < 5 Family Dwellings (A B C & D)
G) Loans On Manufactured Home Dwelling (A B C & D)
Number
Average Value
Number
Average Value
Number
Average Value
Number
Average Value
Number
Average Value
Number
Average Value
LOANS ORIGINATED
4
$84,650
45
$93,281
81
$83,542
29
$39,217
5
$109,268
9
$52,604
APPLICATIONS APPROVED, NOT ACCEPTED
0
$0
7
$73,833
19
$88,734
4
$27,675
1
$55,890
3
$39,990
APPLICATIONS DENIED
1
$89,720
14
$77,421
80
$84,042
25
$32,009
5
$38,022
9
$36,428
APPLICATIONS WITHDRAWN
0
$0
5
$102,778
57
$82,373
5
$48,486
0
$0
4
$65,340
FILES CLOSED FOR INCOMPLETENESS
0
$0
1
$97,330
14
$95,690
1
$40,160
0
$0
1
$54,620
Aggregated Statistics For Year 2003 (Based on 4 partial tracts)
A) FHA, FSA/RHS & VA Home Purchase Loans
B) Conventional Home Purchase Loans
C) Refinancings
D) Home Improvement Loans
F) Non-occupant Loans on < 5 Family Dwellings (A B C & D)
Number
Average Value
Number
Average Value
Number
Average Value
Number
Average Value
Number
Average Value
LOANS ORIGINATED
4
$86,270
40
$94,422
162
$81,799
30
$30,105
7
$150,799
APPLICATIONS APPROVED, NOT ACCEPTED
0
$0
6
$67,063
28
$79,083
8
$48,525
2
$72,725
APPLICATIONS DENIED
2
$56,735
14
$56,973
68
$98,638
11
$26,080
4
$53,710
APPLICATIONS WITHDRAWN
0
$0
5
$83,522
33
$96,501
3
$33,043
0
$0
FILES CLOSED FOR INCOMPLETENESS
0
$0
1
$41,070
5
$80,846
3
$50,227
0
$0
Aggregated Statistics For Year 1999 (Based on 1 partial tract)
A) FHA, FSA/RHS & VA Home Purchase Loans
B) Conventional Home Purchase Loans
C) Refinancings
D) Home Improvement Loans
F) Non-occupant Loans on < 5 Family Dwellings (A B C & D)


 Nearest zip codes: 16145, 16133, 16114, 16342, 16311, 16127.