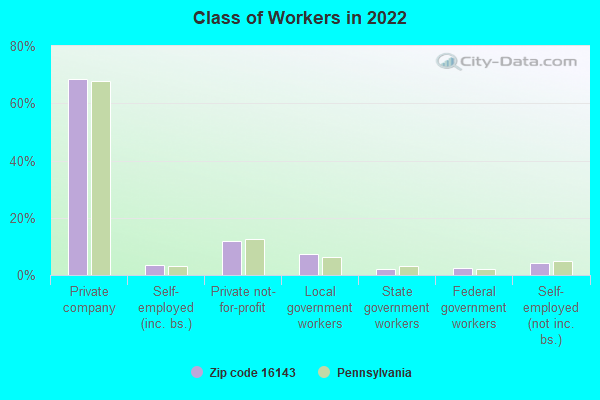
Estimated zip code population in 2022: 1,976 Zip code population in 2010: 2,901 Zip code population in 2000: 3,058
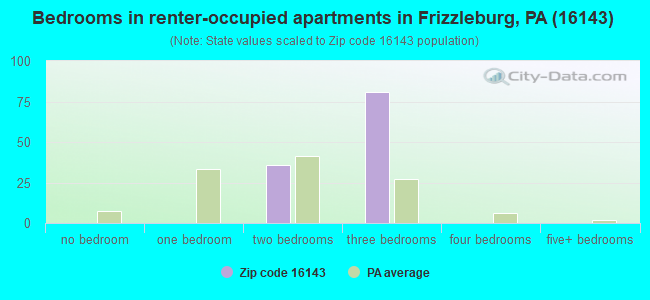
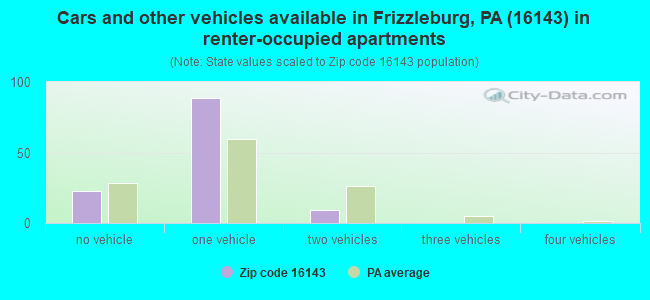
Houses and condos: 988 Renter-occupied apartments: 120
% of renters here:
13%
State:
31%
March 2022 cost of living index in zip code 16143: 91.2 (less than average, U.S. average is 100)
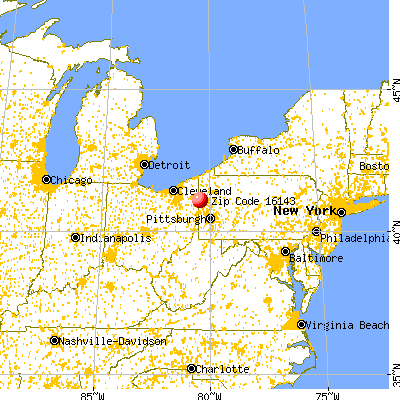
Land area: 26.1 sq. mi. Water area: 0.2 sq. mi.
Population density: 76 people per square mile
(very low).
OSM Map
General Map
Google Map
MSN Map
OSM Map
General Map
Google Map
MSN Map
OSM Map
General Map
Google Map
MSN Map
OSM Map
General Map
Google Map
MSN Map
Please wait while loading the map...
Real estate property taxes paid for housing units in 2022:
This zip code:
1.2% ($2,259)
Pennsylvania:
1.3% ($3,094)
Median real estate property taxes paid for housing units with mortgages in 2022: $2,409 (1.4%) Median real estate property taxes paid for housing units with no mortgage in 2022: $2,020 (0.9%)
Business Search- 14 Million verified businesses
Males: 1,051
(53.2%)
Females: 925
(46.8%)
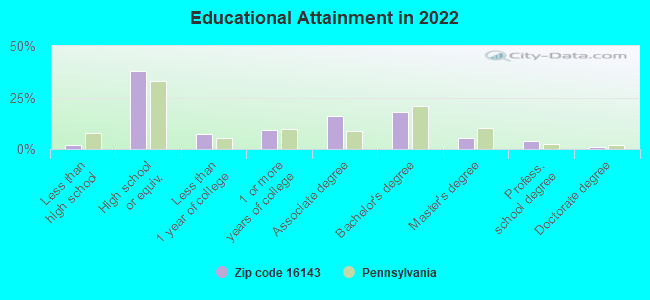
For population 25 years and over in 16143:
High school or higher: 97.8%
Bachelor's degree or higher: 28.1%
Graduate or professional degree: 10.4%
Unemployed: 2.2%
Mean travel time to work (commute): 27.9 minutes
For population 15 years and over in 16143:
Never married: 22.6%
Now married: 60.9%
Separated: 2.2%
Widowed: 3.8%
Divorced: 10.6%
Zip code 16143 compared to state average:
Unemployed percentage below state average.
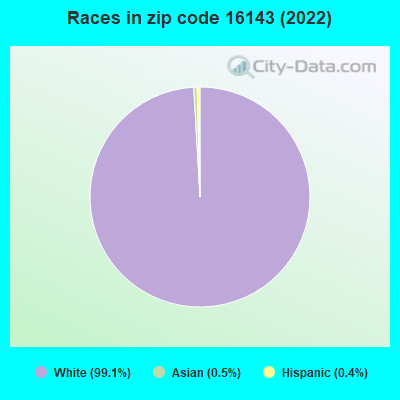
Black race population percentage significantly below state average.
Hispanic race population percentage significantly below state average.
Median age significantly above state average.
Foreign-born population percentage significantly below state average.
Renting percentage significantly below state average.
Length of stay since moving in significantly above state average.
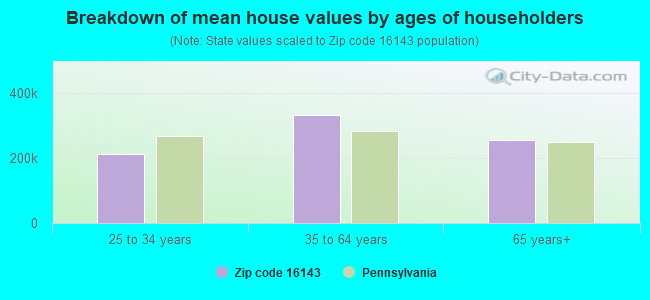
Estimated median house/condo value in 2022: $187,327
16143:
$187,327
Pennsylvania:
$245,500
According to our research of Pennsylvania and other state lists, there were 3 registered sex offenders living in 16143 zip code as of May 23, 2024. The ratio of all residents to sex offenders in zip code 16143 is 1,031 to 1. The ratio of registered sex offenders to all residents in this zip code is lower than the state average.
Median resident age:
This zip code:
55.2 years
Pennsylvania median age:
40.9 years
Average household size:
This zip code:
2.2 people
Pennsylvania:
2.4 people
Averages for the 2020 tax year for zip code 16143, filed in 2021:
Average Adjusted Gross Income (AGI) in 2020: $57,988 (Individual Income Tax Returns)
Here:
$57,988
State:
$75,707
Salary/wage: $50,887 (reported on 76.5% of returns)
Here:
$50,887
State:
$62,806
(% of AGI for various income ranges: 1072.2% for AGIs below $25k, 3147.6% for AGIs $25k-50k, 5995.6% for AGIs $50k-75k, 8471.8% for AGIs $75k-100k, 14405.8% for AGIs $100k-200k)
Taxable interest for individuals: $711 (reported on 28.8% of returns)
This zip code:
$711
Pennsylvania:
$1,633
(% of AGI for various income ranges: 17.0% for AGIs below $25k, 24.8% for AGIs $25k-50k, 36.2% for AGIs $50k-75k, 12.7% for AGIs $75k-100k, 51.7% for AGIs $100k-200k)
Ordinary dividends: $4,118 (reported on 21.2% of returns)
Here:
$4,118
State:
$7,382
(% of AGI for various income ranges: 40.4% for AGIs below $25k, 64.4% for AGIs $25k-50k, 60.6% for AGIs $50k-75k, 52.7% for AGIs $75k-100k, 175.0% for AGIs $100k-200k)
Net capital gain/loss in AGI: +$3,648 (reported on 17.4% of returns)
Here:
+$3,648
State:
+$23,522
(% of AGI for various income ranges: 8.5% for AGIs below $25k, 23.6% for AGIs $25k-50k, 23.1% for AGIs $50k-75k, 75.5% for AGIs $75k-100k, 530.8% for AGIs $100k-200k)
Profit/loss from business: +$7,612 (reported on 12.9% of returns)
Here:
+$7,612
State:
+$16,274
(% of AGI for various income ranges: 98.1% for AGIs below $25k, 153.6% for AGIs $25k-50k, 178.8% for AGIs $50k-75k, 130.9% for AGIs $75k-100k, 179.2% for AGIs $100k-200k)
Taxable individual retirement arrangement distribution: $14,888 (reported on 12.9% of returns)
16143:
$14,888
Pennsylvania:
$18,583
(% of AGI for various income ranges: 66.7% for AGIs below $25k, 150.8% for AGIs $25k-50k, 176.9% for AGIs $50k-75k, 468.2% for AGIs $75k-100k, 980.0% for AGIs $100k-200k)
Total itemized deductions: $31,367 (reported on 2.3% of returns)
Here:
$31,367
State:
$34,850
(% of AGI for various income ranges: 784.2% for AGIs $100k-200k)
Charity contributions: $6,233 (reported on 2.3% of returns)
Here:
$6,233
State:
$12,392
(% of AGI for various income ranges: 170.0% for AGIs $75k-100k)
Taxes paid: $7,967 (reported on 2.3% of returns)
16143:
$7,967
State:
$8,200
(% of AGI for various income ranges: 199.2% for AGIs $100k-200k)
Earned income credit: $2,014 (reported on 10.6% of returns)
Here:
$2,014
State:
$2,100
(% of AGI for various income ranges: 64.4% for AGIs below $25k, 43.2% for AGIs $25k-50k)
Percentage of individuals using paid preparers for their 2020 taxes: 93.9%
Here:
94%
State:
92%
(% for various income ranges: 93.0% for AGIs below $25k, 93.8% for AGIs $25k-50k, 95.5% for AGIs $50k-75k, 92.9% for AGIs $75k-100k, 94.4% for AGIs $100k-200k, 100.0% for AGIs over 200k)
Averages for the 2012 tax year for zip code 16143, filed in 2013:
Average Adjusted Gross Income (AGI) in 2012: $54,510 (Individual Income Tax Returns)
Here:
$54,510
State:
$61,346
Salary/wage: $41,459 (reported on 82.0% of returns)
Here:
$41,459
State:
$51,902
(% of AGI for various income ranges: 65.0% for AGIs below $25k, 72.0% for AGIs $25k-50k, 72.2% for AGIs $50k-75k, 73.9% for AGIs $75k-100k, 64.8% for AGIs $100k-200k, 30.7% for AGIs over 200k)
Taxable interest for individuals: $663 (reported on 36.7% of returns)
This zip code:
$663
Pennsylvania:
$1,588
(% of AGI for various income ranges: 0.9% for AGIs below $25k, 0.6% for AGIs $25k-50k, 0.4% for AGIs $50k-75k, 0.2% for AGIs $75k-100k, 0.3% for AGIs $100k-200k, 0.7% for AGIs over 200k)
Ordinary dividends: $2,352 (reported on 19.4% of returns)
Here:
$2,352
State:
$5,827
(% of AGI for various income ranges: 1.7% for AGIs below $25k, 0.3% for AGIs $25k-50k, 1.4% for AGIs $50k-75k, 0.5% for AGIs $75k-100k, 0.7% for AGIs $100k-200k, 0.9% for AGIs over 200k)
Net capital gain/loss in AGI: +$971 (reported on 12.2% of returns)
Here:
+$971
State:
+$14,495
(% of AGI for various income ranges: 0.2% for AGIs $50k-75k, 0.1% for AGIs $75k-100k, 0.8% for AGIs $100k-200k)
Profit/loss from business: +$8,329 (reported on 10.1% of returns)
Here:
+$8,329
State:
+$16,268
(% of AGI for various income ranges: 4.4% for AGIs below $25k, 1.6% for AGIs $25k-50k, 1.8% for AGIs $50k-75k, 1.0% for AGIs $75k-100k, 1.9% for AGIs $100k-200k)
Taxable individual retirement arrangement distribution: $7,427 (reported on 10.8% of returns)
16143:
$7,427
Pennsylvania:
$14,550
(% of AGI for various income ranges: 3.8% for AGIs below $25k, 1.9% for AGIs $25k-50k, 2.0% for AGIs $50k-75k, 3.3% for AGIs $75k-100k)
Total itemized deductions: $18,693 (17% of AGI, reported on 20.9% of returns)
Here:
$18,693
State:
$23,538
Here:
16.6% of AGI
State:
18.4% of AGI
(% of AGI for various income ranges: 7.6% for AGIs $25k-50k, 7.1% for AGIs $50k-75k, 8.6% for AGIs $75k-100k, 8.3% for AGIs $100k-200k, 7.1% for AGIs over 200k)
Charity contributions: $3,505 (reported on 15.1% of returns)
Here:
$3,505
State:
$4,025
(% of AGI for various income ranges: 0.8% for AGIs $25k-50k, 0.6% for AGIs $50k-75k, 0.8% for AGIs $75k-100k, 1.1% for AGIs $100k-200k, 1.9% for AGIs over 200k)
Taxes paid: $7,490 (reported on 20.9% of returns)
16143:
$7,490
State:
$9,982
(% of AGI for various income ranges: 1.9% for AGIs $25k-50k, 2.5% for AGIs $50k-75k, 3.0% for AGIs $75k-100k, 3.5% for AGIs $100k-200k, 4.2% for AGIs over 200k)
Earned income credit: $2,094 (reported on 12.2% of returns)
Here:
$2,094
State:
$2,106
(% of AGI for various income ranges: 4.3% for AGIs below $25k, 0.8% for AGIs $25k-50k)
Percentage of individuals using paid preparers for their 2012 taxes: 59.7%
Here:
60%
State:
53%
(% for various income ranges: 49.1% for AGIs below $25k, 60.6% for AGIs $25k-50k, 68.4% for AGIs $50k-75k, 66.7% for AGIs $75k-100k, 73.3% for AGIs $100k-200k, 75.0% for AGIs over 200k)
Averages for the 2004 tax year for zip code 16143, filed in 2005:
Average Adjusted Gross Income (AGI) in 2004: $38,690 (Individual Income Tax Returns)
Here:
$38,690
State:
$48,049
Salary/wage: $35,133 (reported on 84.6% of returns)
Here:
$35,133
State:
$42,646
(% of AGI for various income ranges: 78.7% for AGIs below $10k, 73.0% for AGIs $10k-25k, 79.7% for AGIs $25k-50k, 85.1% for AGIs $50k-75k, 90.2% for AGIs $75k-100k, 58.7% for AGIs over 100k)
Taxable interest for individuals: $1,300 (reported on 48.6% of returns)
This zip code:
$1,300
Pennsylvania:
$1,657
(% of AGI for various income ranges: 5.9% for AGIs below $10k, 2.4% for AGIs $10k-25k, 1.1% for AGIs $25k-50k, 0.7% for AGIs $50k-75k, 0.5% for AGIs $75k-100k, 3.0% for AGIs over 100k)
Taxable dividends: $1,702 (reported on 25.7% of returns)
Here:
$1,702
State:
$3,566
(% of AGI for various income ranges: 3.6% for AGIs below $10k, 1.3% for AGIs $10k-25k, 0.7% for AGIs $25k-50k, 0.7% for AGIs $50k-75k, 1.2% for AGIs $75k-100k, 1.7% for AGIs over 100k)
Net capital gain/loss: +$1,664 (reported on 16.5% of returns)
Here:
+$1,664
State:
+$9,716
(% of AGI for various income ranges: -2.2% for AGIs below $10k, -0.5% for AGIs $10k-25k, 0.0% for AGIs $25k-50k, 0.4% for AGIs $50k-75k, 0.4% for AGIs $75k-100k, 2.9% for AGIs over 100k)
Profit/loss from business: +$6,013 (reported on 12.0% of returns)
Here:
+$6,013
State:
+$14,267
(% of AGI for various income ranges: 2.8% for AGIs below $10k, 4.4% for AGIs $10k-25k, 2.7% for AGIs $25k-50k, 0.4% for AGIs $50k-75k, 2.3% for AGIs over 100k)
IRA payment deduction: $2,057 (reported on 2.7% of returns)
16143:
$2,057
Pennsylvania:
$2,903
Total itemized deductions: $14,872 (19% of AGI, reported on 21.9% of returns)
Here:
$14,872
State:
$18,804
Here:
18.9% of AGI
State:
19.5% of AGI
(% of AGI for various income ranges: 5.3% for AGIs $10k-25k, 6.7% for AGIs $25k-50k, 10.2% for AGIs $50k-75k, 10.4% for AGIs $75k-100k, 9.6% for AGIs over 100k)
Charity contributions deductions: $2,452 (3% of AGI, reported on 18.1% of returns)
Here:
$2,452
State:
$3,337
Here:
3.0% of AGI
State:
3.3% of AGI
(% of AGI for various income ranges: 0.6% for AGIs $10k-25k, 0.7% for AGIs $25k-50k, 0.9% for AGIs $50k-75k, 1.4% for AGIs $75k-100k, 2.1% for AGIs over 100k)
Total tax: $5,294 (reported on 74.2% of returns)
16143:
$5,294
State:
$8,008
(% of AGI for various income ranges: 2.4% for AGIs below $10k, 3.9% for AGIs $10k-25k, 7.1% for AGIs $25k-50k, 8.2% for AGIs $50k-75k, 10.0% for AGIs $75k-100k, 19.6% for AGIs over 100k)
Earned income credit: $1,790 (reported on 13.7% of returns)
Here:
$1,790
State:
$1,643
Percentage of individuals using paid preparers for their 2004 taxes: 58.7%
Here:
59%
State:
56%
(% for various income ranges: 53.0% for AGIs below $10k, 58.9% for AGIs $10k-25k, 61.5% for AGIs $25k-50k, 59.6% for AGIs $50k-75k, 54.5% for AGIs $75k-100k, 69.7% for AGIs over 100k)
Household received Food Stamps/SNAP in the past 12 months: 83 Household did not receive Food Stamps/SNAP in the past 12 months: 825
Women who had a birth in the past 12 months: 6 (6 now married, 0 unmarried) Women who did not have a birth in the past 12 months: 304 (114 now married, 190 unmarried)
Housing units in zip code 16143 with a mortgage: 439 (47 second mortgage, 46 both second mortgage and home equity loan) Houses without a mortgage: 117
Median monthly owner costs for units with a mortgage: $1,306 Median monthly owner costs for units without a mortgage: $550
Residents with income below the poverty level in 2022:
This zip code:
7.3%
Whole state:
11.8%
Residents with income below 50% of the poverty level in 2022:
This zip code:
5.4%
Whole state:
6.1%
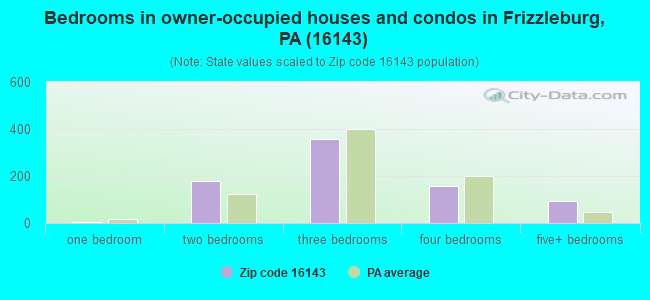
Median number of rooms in houses and condos:
Here:
6.9
State:
6.8
Median number of rooms in apartments:
Here:
5.0
State:
4.3
Notable locations in this zip code not listed on our city pages
Notable locations in zip code 16143: Pulaski Township Volunteer Fire Department Station 2 (A), Pulaski Township Volunteer Fire Department Station 1 Headquarters (B). Display/hide their locations on the map
Size of family households: 426 2-persons, 123 3-persons, 38 4-persons, 10 5-persons, 14 6-persons, 7 7-or-more-persons
Size of nonfamily households: 243 1-person, 50 2-persons
65 married couples with children.
75 single-parent households (75 women).
97.9% of residents of 16143 zip code speak English at home.
0.9% of residents speak Spanish at home (100% very well).
0.9% of residents speak other Indo-European language at home (100% very well).
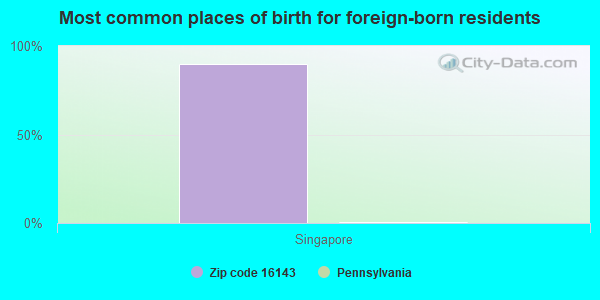
Foreign born population: 10 (0.5%) (100.0% of them are naturalized citizens)
This zip code:
0.5%
Whole state:
7.5%
90%Singapore
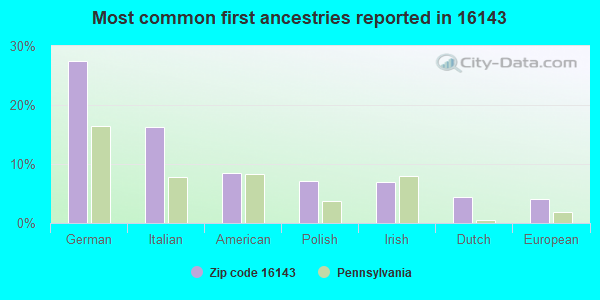
27%German
16%Italian
9%American
7%Polish
7%Irish
4%Dutch
4%European
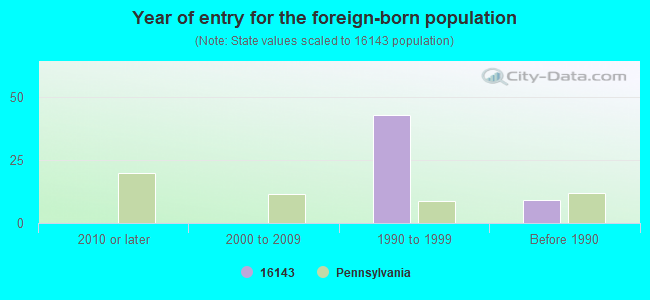
Year of entry for the foreign-born population
02010 or later
02000 to 2009
431990 to 1999
9Before 1990
Public elementary/middle school in in zip code 16143 not listed on the city page:
PULASKI EL SCH(Students: 129, Location: 320 SHENANGO ST, Grades: KG-3)
Housing units lacking complete plumbing facilities: 2.9% Housing units lacking complete kitchen facilities: 3.1%
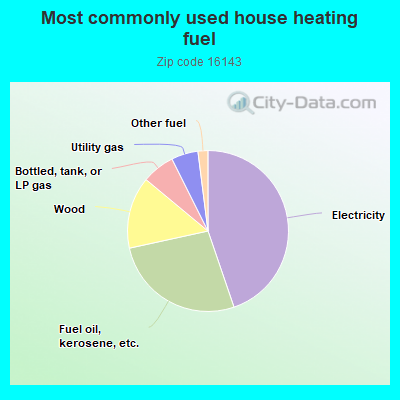
44.9%Electricity
26.9%Fuel oil, kerosene, etc.
14.5%Wood
6.6%Bottled, tank, or LP gas
5.4%Utility gas
2.0%Other fuel
Population in 1990: 3,898.
Place of birth for U.S.-born residents:
This state: 1,472
Northeast: 54
Midwest: 309
South: 52
West: 27
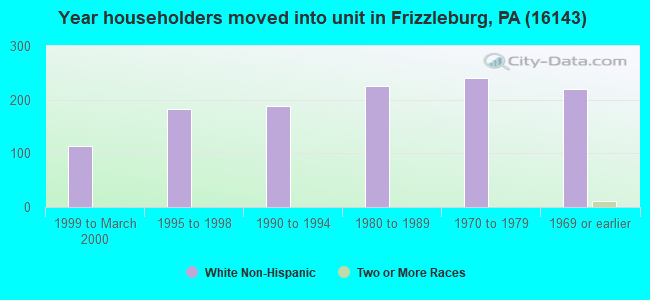
77% of the 16143 zip code residents lived in the same house 5 years ago. Out of people who lived in different houses, 54% lived in this county. Out of people who lived in different counties, 50% lived in Pennsylvania.
93% of the 16143 zip code residents lived in the same house 1 year ago. Out of people who lived in different houses, 25% moved from this county. Out of people who lived in different houses, 35% moved from different county within same state. Out of people who lived in different houses, 43% moved from different state.
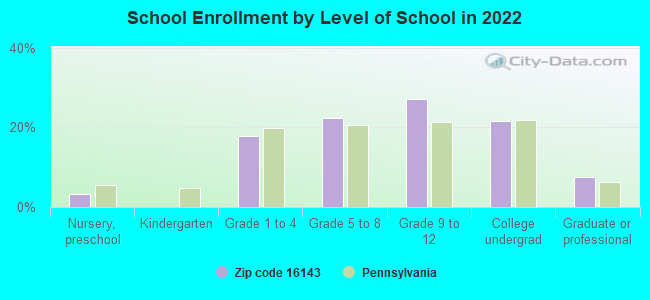
Private vs. public school enrollment:
Students in private schools in grades 1 to 8 (elementary and middle school):
Here:
0.0%
Pennsylvania:
15.7%
Students in private schools in grades 9 to 12 (high school):
Here:
0.0%
Pennsylvania:
13.4%
Students in private undergraduate colleges:
Here:
0.0%
Pennsylvania:
39.8%
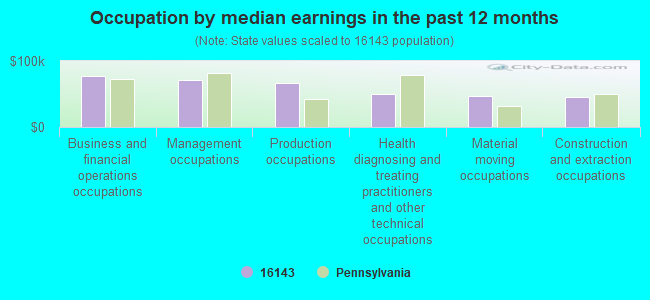
Occupation by median earnings in the past 12 months ($)
76,929Business and financial operations occupations
71,869Management occupations
66,991Production occupations
50,675Health diagnosing and treating practitioners and other technical occupations
46,769Material moving occupations
45,798Construction and extraction occupations
Companies with federal contracts located in this zip code:
LANE ENTERPRISES INC (RTE 551N in PULASKI, PA)
$4,740 with Army for Pipe, Tube and Rigid Tubing. Signed on 2004-08-27. Completion date: 2004-09-10.
Top industries in this zip code by the number of employees in 2005:
Educational Services: Other Technical and Trade Schools (50-99 employees: 1 establishment)
Other Services (except Public Administration): Religious Organizations (5-9: 2, 1-4: 1)
Administrative and Support and Waste Management and Remediation Services: Janitorial Services (10-19: 1)
Other Services (except Public Administration): Reupholstery and Furniture Repair (5-9: 1, 1-4: 1)
Construction: Water and Sewer Line and Related Structures Construction (5-9: 1)
Real Estate and Rental and Leasing: Lessors of Nonresidential Buildings (except Miniwarehouses) (5-9: 1)
Fatal accident statistics in 2013:
Fatal accident count: 1
Vehicles involved in fatal accidents: 1
Fatal accidents caused by drunken drivers: 0
Fatalities: 1
Persons involved in fatal accidents: 2
Pedestrians involved in fatal accidents: 0
Fatal accident statistics in 2012:
Fatal accident count: 2
Vehicles involved in fatal accidents: 3
Fatal accidents caused by drunken drivers: 0
Fatalities: 3
Persons involved in fatal accidents: 4
Pedestrians involved in fatal accidents: 0
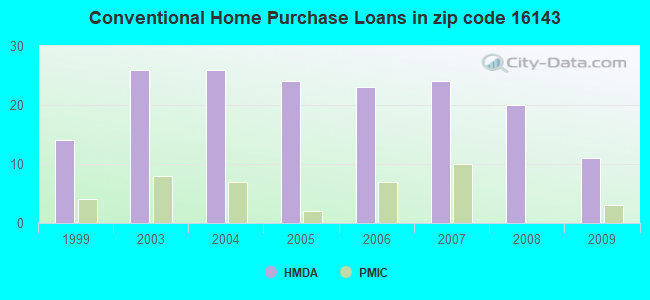
Home Mortgage Disclosure Act Aggregated Statistics For Year 2009 (Based on 2 partial tracts)
A) FHA, FSA/RHS & VA Home Purchase Loans
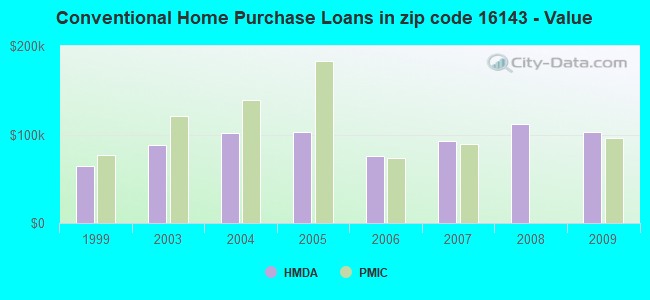
B) Conventional Home Purchase Loans
C) Refinancings
D) Home Improvement Loans
F) Non-occupant Loans on < 5 Family Dwellings (A B C & D)
G) Loans On Manufactured Home Dwelling (A B C & D)
Number
Average Value
Number
Average Value
Number
Average Value
Number
Average Value
Number
Average Value
Number
Average Value
LOANS ORIGINATED
5
$99,602
11
$102,395
36
$117,557
9
$36,498
2
$47,945
1
$23,840
APPLICATIONS APPROVED, NOT ACCEPTED
0
$0
0
$0
3
$128,210
1
$1,590
0
$0
0
$0
APPLICATIONS DENIED
0
$0
3
$44,150
14
$159,999
3
$41,147
0
$0
1
$27,550
APPLICATIONS WITHDRAWN
0
$0
1
$21,720
12
$131,038
1
$5,830
0
$0
1
$21,720
FILES CLOSED FOR INCOMPLETENESS
0
$0
0
$0
3
$131,037
0
$0
0
$0
0
$0
Aggregated Statistics For Year 2008 (Based on 2 partial tracts)
A) FHA, FSA/RHS & VA Home Purchase Loans
B) Conventional Home Purchase Loans
C) Refinancings
D) Home Improvement Loans
F) Non-occupant Loans on < 5 Family Dwellings (A B C & D)
G) Loans On Manufactured Home Dwelling (A B C & D)
Number
Average Value
Number
Average Value
Number
Average Value
Number
Average Value
Number
Average Value
Number
Average Value
LOANS ORIGINATED
6
$99,602
20
$112,344
25
$102,484
20
$44,821
2
$42,650
1
$2,650
APPLICATIONS APPROVED, NOT ACCEPTED
1
$72,050
2
$145,695
7
$81,816
2
$25,960
0
$0
0
$0
APPLICATIONS DENIED
1
$56,690
6
$145,695
25
$123,020
6
$36,468
1
$38,680
2
$22,780
APPLICATIONS WITHDRAWN
0
$0
2
$112,320
7
$118,676
1
$37,090
0
$0
0
$0
FILES CLOSED FOR INCOMPLETENESS
0
$0
1
$82,120
0
$0
1
$126,090
0
$0
0
$0
Aggregated Statistics For Year 2007 (Based on 2 partial tracts)
A) FHA, FSA/RHS & VA Home Purchase Loans
B) Conventional Home Purchase Loans
C) Refinancings
D) Home Improvement Loans
F) Non-occupant Loans on < 5 Family Dwellings (A B C & D)
G) Loans On Manufactured Home Dwelling (A B C & D)
Number
Average Value
Number
Average Value
Number
Average Value
Number
Average Value
Number
Average Value
Number
Average Value
LOANS ORIGINATED
3
$95,893
24
$93,135
47
$94,395
23
$43,167
5
$76,610
4
$49,668
APPLICATIONS APPROVED, NOT ACCEPTED
0
$0
3
$89,360
7
$138,201
2
$13,775
0
$0
0
$0
APPLICATIONS DENIED
1
$69,930
5
$52,450
30
$112,847
9
$65,166
1
$7,950
4
$29,405
APPLICATIONS WITHDRAWN
1
$32,850
2
$95,100
14
$132,374
1
$30,200
1
$7,950
1
$32,850
FILES CLOSED FOR INCOMPLETENESS
1
$32,850
1
$75,760
4
$163,178
0
$0
0
$0
1
$32,850
Aggregated Statistics For Year 2006 (Based on 2 partial tracts)
A) FHA, FSA/RHS & VA Home Purchase Loans
B) Conventional Home Purchase Loans
C) Refinancings
D) Home Improvement Loans
E) Loans on Dwellings For 5+ Families
F) Non-occupant Loans on < 5 Family Dwellings (A B C & D)
G) Loans On Manufactured Home Dwelling (A B C & D)
Number
Average Value
Number
Average Value
Number
Average Value
Number
Average Value
Number
Average Value
Number
Average Value
Number
Average Value
LOANS ORIGINATED
2
$78,145
23
$75,738
47
$87,755
21
$39,584
0
$0
3
$128,740
2
$30,995
APPLICATIONS APPROVED, NOT ACCEPTED
0
$0
3
$39,560
17
$122,228
2
$57,750
0
$0
1
$59,340
0
$0
APPLICATIONS DENIED
0
$0
10
$75,496
46
$101,952
15
$49,943
1
$48,740
0
$0
3
$34,260
APPLICATIONS WITHDRAWN
0
$0
2
$145,960
32
$100,149
1
$8,480
0
$0
3
$114,083
1
$32,850
FILES CLOSED FOR INCOMPLETENESS
0
$0
1
$149,400
5
$106,066
0
$0
0
$0
0
$0
0
$0
Aggregated Statistics For Year 2005 (Based on 2 partial tracts)
A) FHA, FSA/RHS & VA Home Purchase Loans
B) Conventional Home Purchase Loans
C) Refinancings
D) Home Improvement Loans
E) Loans on Dwellings For 5+ Families
F) Non-occupant Loans on < 5 Family Dwellings (A B C & D)
G) Loans On Manufactured Home Dwelling (A B C & D)
Number
Average Value
Number
Average Value
Number
Average Value
Number
Average Value
Number
Average Value
Number
Average Value
Number
Average Value
LOANS ORIGINATED
2
$101,720
24
$103,311
57
$93,115
16
$49,404
0
$0
3
$80,707
1
$31,790
APPLICATIONS APPROVED, NOT ACCEPTED
0
$0
4
$61,855
21
$81,614
2
$15,630
0
$0
1
$38,150
0
$0
APPLICATIONS DENIED
0
$0
10
$67,285
42
$97,900
8
$41,986
1
$137,750
1
$63,580
2
$36,820
APPLICATIONS WITHDRAWN
0
$0
3
$78,940
23
$113,423
3
$66,753
0
$0
1
$37,090
2
$116,555
FILES CLOSED FOR INCOMPLETENESS
0
$0
0
$0
8
$119,868
1
$69,930
0
$0
0
$0
0
$0
Aggregated Statistics For Year 2004 (Based on 2 partial tracts)
A) FHA, FSA/RHS & VA Home Purchase Loans
B) Conventional Home Purchase Loans
C) Refinancings
D) Home Improvement Loans
E) Loans on Dwellings For 5+ Families
F) Non-occupant Loans on < 5 Family Dwellings (A B C & D)
G) Loans On Manufactured Home Dwelling (A B C & D)
Number
Average Value
Number
Average Value
Number
Average Value
Number
Average Value
Number
Average Value
Number
Average Value
Number
Average Value
LOANS ORIGINATED
3
$79,470
26
$101,885
54
$86,554
20
$38,516
0
$0
5
$71,418
2
$43,975
APPLICATIONS APPROVED, NOT ACCEPTED
0
$0
5
$52,450
16
$89,205
2
$9,005
1
$63,580
0
$0
2
$26,755
APPLICATIONS DENIED
0
$0
8
$92,052
38
$103,032
13
$33,052
1
$44,500
2
$77,085
4
$45,032
APPLICATIONS WITHDRAWN
1
$45,560
3
$65,343
31
$96,629
2
$41,590
0
$0
1
$72,050
2
$75,495
FILES CLOSED FOR INCOMPLETENESS
0
$0
2
$61,985
8
$114,370
1
$77,350
0
$0
2
$67,815
0
$0
Aggregated Statistics For Year 2003 (Based on 2 partial tracts)
A) FHA, FSA/RHS & VA Home Purchase Loans
B) Conventional Home Purchase Loans
C) Refinancings
D) Home Improvement Loans
F) Non-occupant Loans on < 5 Family Dwellings (A B C & D)
Number
Average Value
Number
Average Value
Number
Average Value
Number
Average Value
Number
Average Value
LOANS ORIGINATED
1
$117,620
26
$88,090
108
$81,349
28
$38,089
5
$73,430
APPLICATIONS APPROVED, NOT ACCEPTED
0
$0
1
$61,990
24
$92,450
6
$53,687
0
$0
APPLICATIONS DENIED
1
$32,320
5
$46,834
57
$94,128
7
$38,600
2
$33,905
APPLICATIONS WITHDRAWN
0
$0
3
$95,187
25
$108,164
1
$31,790
1
$29,670
FILES CLOSED FOR INCOMPLETENESS
0
$0
0
$0
4
$67,418
0
$0
0
$0
Aggregated Statistics For Year 1999 (Based on 1 partial tract)
A) FHA, FSA/RHS & VA Home Purchase Loans
B) Conventional Home Purchase Loans
C) Refinancings
D) Home Improvement Loans
F) Non-occupant Loans on < 5 Family Dwellings (A B C & D)


 Nearest zip codes: 16159, 16116, 16140, 16155, 44436, 16161.


 (Students: 129, Location: 320 SHENANGO ST, Grades: KG-3)