Estimated zip code population in 2022: 4,303 Zip code population in 2010: 4,941 Zip code population in 2000: 6,170
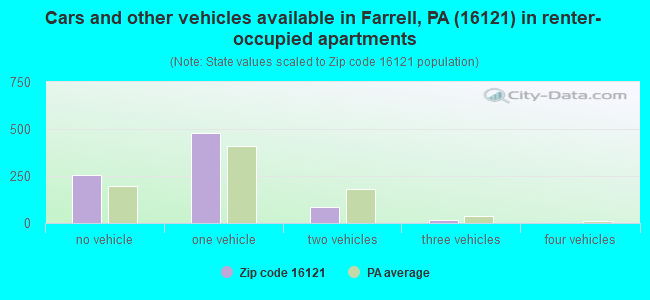
Houses and condos: 2,241 Renter-occupied apartments: 837
% of renters here:
41%
State:
31%
March 2022 cost of living index in zip code 16121: 93.2 (less than average, U.S. average is 100)
Land area: 2.3 sq. mi. Water area: 0.0 sq. mi.
Population density: 1,897 people per square mile
(low).
OSM Map
General Map
Google Map
MSN Map
OSM Map
General Map
Google Map
MSN Map
OSM Map
General Map
Google Map
MSN Map
OSM Map
General Map
Google Map
MSN Map
Please wait while loading the map...
Real estate property taxes paid for housing units in 2022:
This zip code:
1.6% ($1,283)
Pennsylvania:
1.3% ($3,094)
Median real estate property taxes paid for housing units with mortgages in 2022: $1,901 (2.2%) Median real estate property taxes paid for housing units with no mortgage in 2022: $996 (1.6%)
Business Search- 14 Million verified businesses
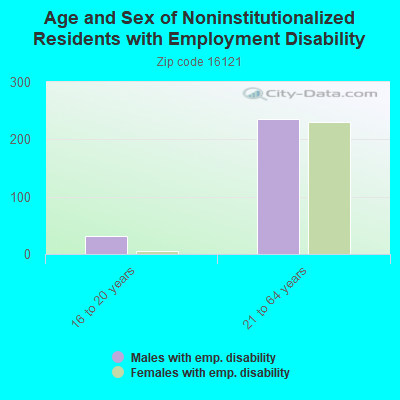
Males: 2,101
(48.8%)
Females: 2,201
(51.2%)
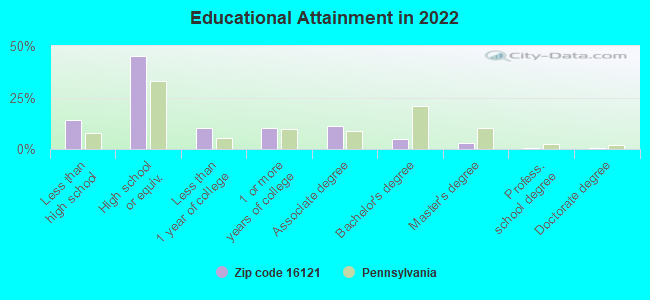
For population 25 years and over in 16121:
High school or higher: 84.3%
Bachelor's degree or higher: 9.0%
Graduate or professional degree: 4.1%
Unemployed: 6.1%
Mean travel time to work (commute): 15.6 minutes
For population 15 years and over in 16121:
Never married: 41.9%
Now married: 32.4%
Separated: 2.8%
Widowed: 12.8%
Divorced: 10.2%
Zip code 16121 compared to state average:
Median household income significantly below state average.
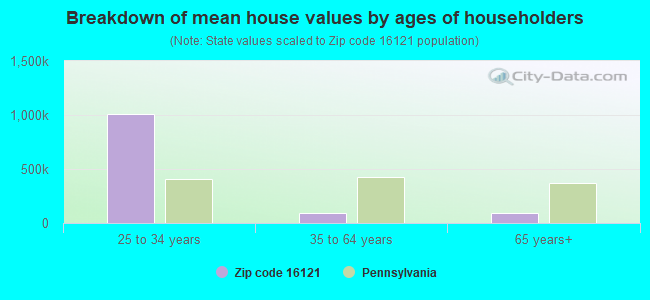
Median house value significantly below state average.
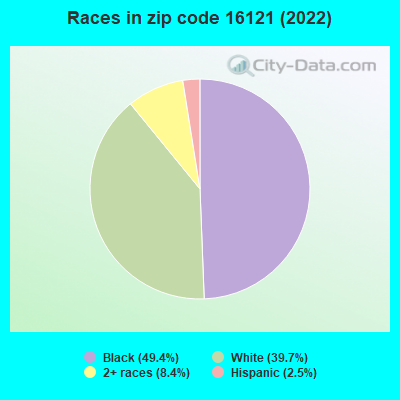
Black race population percentage significantly above state average.
Hispanic race population percentage significantly below state average.
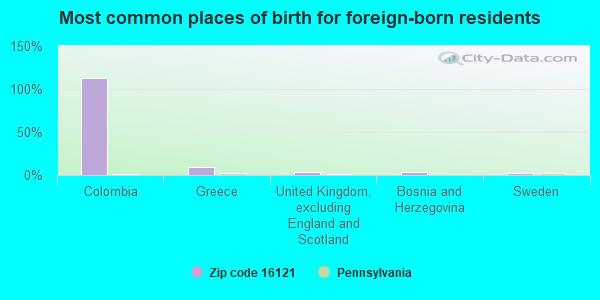
Foreign-born population percentage significantly below state average.
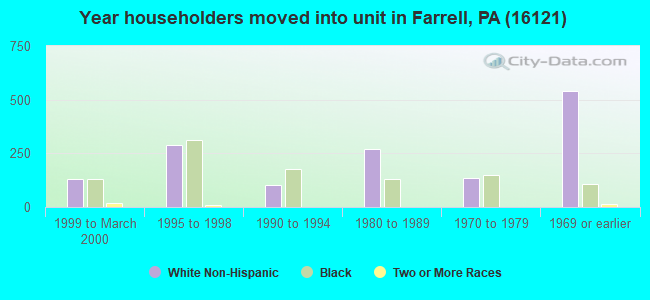
Length of stay since moving in significantly above state average.
Number of college students below state average.
Percentage of population with a bachelor's degree or higher significantly below state average.
Estimated median house/condo value in 2022: $79,988
16121:
$79,988
Pennsylvania:
$245,500
According to our research of Pennsylvania and other state lists, there were 9 registered sex offenders living in 16121 zip code as of May 23, 2024. The ratio of all residents to sex offenders in zip code 16121 is 537 to 1. The ratio of registered sex offenders to all residents in this zip code is near the state average.
Median resident age:
This zip code:
41.0 years
Pennsylvania median age:
40.9 years
Average household size:
This zip code:
2.1 people
Pennsylvania:
2.4 people
Averages for the 2020 tax year for zip code 16121, filed in 2021:
Average Adjusted Gross Income (AGI) in 2020: $33,812 (Individual Income Tax Returns)
Here:
$33,812
State:
$75,707
Salary/wage: $29,261 (reported on 81.5% of returns)
Here:
$29,261
State:
$62,806
(% of AGI for various income ranges: 991.4% for AGIs below $25k, 3200.8% for AGIs $25k-50k, 6040.0% for AGIs $50k-75k, 8922.9% for AGIs $75k-100k, 13098.0% for AGIs $100k-200k)
Taxable interest for individuals: $757 (reported on 15.4% of returns)
This zip code:
$757
Pennsylvania:
$1,633
(% of AGI for various income ranges: 8.8% for AGIs below $25k, 19.0% for AGIs $25k-50k, 10.6% for AGIs $50k-75k, 60.0% for AGIs $75k-100k, 14.0% for AGIs $100k-200k)
Ordinary dividends: $1,808 (reported on 6.2% of returns)
Here:
$1,808
State:
$7,382
(% of AGI for various income ranges: 7.6% for AGIs below $25k, 7.6% for AGIs $25k-50k, 45.9% for AGIs $50k-75k, 64.3% for AGIs $75k-100k)
Net capital gain/loss in AGI: +$1,222 (reported on 4.6% of returns)
Here:
+$1,222
State:
+$23,522
(% of AGI for various income ranges: 0.6% for AGIs below $25k, 0.6% for AGIs $25k-50k, 60.6% for AGIs $50k-75k)
Profit/loss from business: +$6,979 (reported on 7.2% of returns)
Here:
+$6,979
State:
+$16,274
(% of AGI for various income ranges: 40.8% for AGIs below $25k, 56.9% for AGIs $25k-50k, 231.2% for AGIs $50k-75k)
Taxable individual retirement arrangement distribution: $10,667 (reported on 7.7% of returns)
16121:
$10,667
Pennsylvania:
$18,583
(% of AGI for various income ranges: 45.8% for AGIs below $25k, 57.8% for AGIs $25k-50k, 211.2% for AGIs $50k-75k, 880.0% for AGIs $75k-100k)
Earned income credit: $2,246 (reported on 30.3% of returns)
Here:
$2,246
State:
$2,100
(% of AGI for various income ranges: 116.7% for AGIs below $25k, 95.1% for AGIs $25k-50k)
Percentage of individuals using paid preparers for their 2020 taxes: 92.8%
Here:
93%
State:
92%
(% for various income ranges: 92.5% for AGIs below $25k, 95.1% for AGIs $25k-50k, 91.3% for AGIs $50k-75k, 90.0% for AGIs $75k-100k, 87.5% for AGIs $100k-200k)
Averages for the 2012 tax year for zip code 16121, filed in 2013:
Average Adjusted Gross Income (AGI) in 2012: $30,158 (Individual Income Tax Returns)
Here:
$30,158
State:
$61,346
Salary/wage: $27,004 (reported on 81.0% of returns)
Here:
$27,004
State:
$51,902
(% of AGI for various income ranges: 71.5% for AGIs below $25k, 78.8% for AGIs $25k-50k, 79.0% for AGIs $50k-75k, 83.0% for AGIs $75k-100k, 43.3% for AGIs $100k-200k)
Taxable interest for individuals: $1,196 (reported on 22.9% of returns)
This zip code:
$1,196
Pennsylvania:
$1,588
(% of AGI for various income ranges: 1.1% for AGIs below $25k, 1.1% for AGIs $25k-50k, 1.0% for AGIs $50k-75k, 0.1% for AGIs $75k-100k, 0.7% for AGIs $100k-200k)
Ordinary dividends: $1,575 (reported on 9.8% of returns)
Here:
$1,575
State:
$5,827
(% of AGI for various income ranges: 0.9% for AGIs below $25k, 0.6% for AGIs $25k-50k, 0.4% for AGIs $50k-75k, 0.3% for AGIs $75k-100k)
Profit/loss from business: +$4,981 (reported on 7.8% of returns)
Here:
+$4,981
State:
+$16,268
(% of AGI for various income ranges: 2.7% for AGIs below $25k, 1.0% for AGIs $25k-50k, 1.8% for AGIs $50k-75k)
Taxable individual retirement arrangement distribution: $7,017 (reported on 8.8% of returns)
16121:
$7,017
Pennsylvania:
$14,550
(% of AGI for various income ranges: 2.5% for AGIs below $25k, 3.1% for AGIs $25k-50k, 4.5% for AGIs $75k-100k)
Total itemized deductions: $15,100 (25% of AGI, reported on 9.8% of returns)
Here:
$15,100
State:
$23,538
Here:
24.9% of AGI
State:
18.4% of AGI
(% of AGI for various income ranges: 2.8% for AGIs below $25k, 4.6% for AGIs $25k-50k, 5.9% for AGIs $50k-75k, 6.6% for AGIs $75k-100k, 5.8% for AGIs $100k-200k)
Charity contributions: $3,343 (reported on 6.8% of returns)
Here:
$3,343
State:
$4,025
(% of AGI for various income ranges: 0.3% for AGIs below $25k, 0.4% for AGIs $25k-50k, 1.0% for AGIs $50k-75k, 1.2% for AGIs $75k-100k, 1.3% for AGIs $100k-200k)
Taxes paid: $4,690 (reported on 9.8% of returns)
16121:
$4,690
State:
$9,982
(% of AGI for various income ranges: 0.4% for AGIs below $25k, 1.1% for AGIs $25k-50k, 1.8% for AGIs $50k-75k, 2.8% for AGIs $75k-100k, 2.3% for AGIs $100k-200k)
Earned income credit: $2,373 (reported on 31.2% of returns)
Here:
$2,373
State:
$2,106
(% of AGI for various income ranges: 9.0% for AGIs below $25k, 1.3% for AGIs $25k-50k)
Percentage of individuals using paid preparers for their 2012 taxes: 41.0%
Here:
41%
State:
53%
(% for various income ranges: 37.0% for AGIs below $25k, 42.0% for AGIs $25k-50k, 52.4% for AGIs $50k-75k, 55.6% for AGIs $75k-100k, 50.0% for AGIs $100k-200k)
Averages for the 2004 tax year for zip code 16121, filed in 2005:
Average Adjusted Gross Income (AGI) in 2004: $25,021 (Individual Income Tax Returns)
Here:
$25,021
State:
$48,049
Salary/wage: $23,946 (reported on 80.9% of returns)
Here:
$23,946
State:
$42,646
(% of AGI for various income ranges: 74.3% for AGIs below $10k, 69.0% for AGIs $10k-25k, 78.2% for AGIs $25k-50k, 86.0% for AGIs $50k-75k, 82.9% for AGIs $75k-100k, 68.1% for AGIs over 100k)
Taxable interest for individuals: $1,475 (reported on 33.7% of returns)
This zip code:
$1,475
Pennsylvania:
$1,657
(% of AGI for various income ranges: 3.4% for AGIs below $10k, 2.9% for AGIs $10k-25k, 2.0% for AGIs $25k-50k, 1.8% for AGIs $50k-75k, 0.4% for AGIs $75k-100k, 0.3% for AGIs over 100k)
Taxable dividends: $1,204 (reported on 15.1% of returns)
Here:
$1,204
State:
$3,566
(% of AGI for various income ranges: 1.7% for AGIs below $10k, 0.9% for AGIs $10k-25k, 0.8% for AGIs $25k-50k, 0.4% for AGIs $50k-75k, 0.6% for AGIs $75k-100k)
Net capital gain/loss: +$283 (reported on 8.2% of returns)
Here:
+$283
State:
+$9,716
(% of AGI for various income ranges: -0.9% for AGIs below $10k, 0.1% for AGIs $10k-25k, 0.2% for AGIs $25k-50k, 0.3% for AGIs $50k-75k, -0.2% for AGIs $75k-100k)
Profit/loss from business: +$3,428 (reported on 7.7% of returns)
Here:
+$3,428
State:
+$14,267
(% of AGI for various income ranges: 1.9% for AGIs below $10k, 1.3% for AGIs $10k-25k, 1.6% for AGIs $25k-50k, 0.5% for AGIs $50k-75k)
IRA payment deduction: $1,850 (reported on 1.8% of returns)
16121:
$1,850
Pennsylvania:
$2,903
Total itemized deductions: $13,065 (25% of AGI, reported on 11.6% of returns)
Here:
$13,065
State:
$18,804
Here:
24.8% of AGI
State:
19.5% of AGI
(% of AGI for various income ranges: 3.6% for AGIs below $10k, 2.3% for AGIs $10k-25k, 6.5% for AGIs $25k-50k, 6.6% for AGIs $50k-75k, 11.2% for AGIs $75k-100k, 10.4% for AGIs over 100k)
Charity contributions deductions: $2,676 (5% of AGI, reported on 9.9% of returns)
Here:
$2,676
State:
$3,337
Here:
4.8% of AGI
State:
3.3% of AGI
(% of AGI for various income ranges: 0.4% for AGIs $10k-25k, 1.2% for AGIs $25k-50k, 0.9% for AGIs $50k-75k, 2.1% for AGIs $75k-100k, 2.4% for AGIs over 100k)
Total tax: $2,907 (reported on 59.6% of returns)
16121:
$2,907
State:
$8,008
(% of AGI for various income ranges: 1.1% for AGIs below $10k, 2.9% for AGIs $10k-25k, 6.5% for AGIs $25k-50k, 9.0% for AGIs $50k-75k, 10.7% for AGIs $75k-100k, 16.5% for AGIs over 100k)
Earned income credit: $1,847 (reported on 28.0% of returns)
Here:
$1,847
State:
$1,643
Percentage of individuals using paid preparers for their 2004 taxes: 57.6%
Here:
58%
State:
56%
(% for various income ranges: 56.1% for AGIs below $10k, 61.1% for AGIs $10k-25k, 54.6% for AGIs $25k-50k, 58.0% for AGIs $50k-75k, 54.9% for AGIs $75k-100k, 52.2% for AGIs over 100k)
Household received Food Stamps/SNAP in the past 12 months: 633 Household did not receive Food Stamps/SNAP in the past 12 months: 1,415
Women who had a birth in the past 12 months: 64 (37 now married, 25 unmarried) Women who did not have a birth in the past 12 months: 693 (250 now married, 443 unmarried)
Housing units in zip code 16121 with a mortgage: 500 (18 second mortgage, 7 both second mortgage and home equity loan) Median monthly owner costs for units with a mortgage: $763 Median monthly owner costs for units without a mortgage: $422
Residents with income below the poverty level in 2022:
This zip code:
34.9%
Whole state:
11.8%
Residents with income below 50% of the poverty level in 2022:
This zip code:
18.0%
Whole state:
6.1%
Median number of rooms in houses and condos:
Here:
6.2
State:
6.8
Median number of rooms in apartments:
Here:
4.5
State:
4.3
Notable locations in this zip code not listed on our city pages
In group quarters: 63 (-1 institutionalized population)
Size of family households: 556 2-persons, 286 3-persons, 141 4-persons, 42 5-persons, 21 6-persons
Size of nonfamily households: 877 1-person, 100 2-persons, 5 4-persons
246 married couples with children.
755 single-parent households (202 men, 553 women).
96.8% of residents of 16121 zip code speak English at home.
1.9% of residents speak Spanish at home (39% very well, 10% well, 51% not well).
0.2% of residents speak other Indo-European language at home (89% very well, 11% not well).
0.7% of residents speak other language at home (100% very well).
Foreign born population: 54 (1.3%) (29.1% of them are naturalized citizens)
This zip code:
1.3%
Whole state:
7.5%
113%Colombia
9%Greece
4%United Kingdom, excluding England and Scotland
4%Bosnia and Herzegovina
2%Sweden
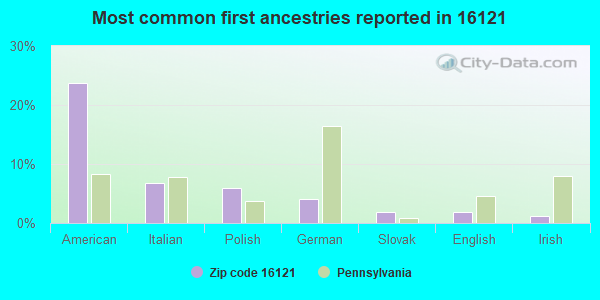
24%American
7%Italian
6%Polish
4%German
2%Slovak
2%English
1%Irish
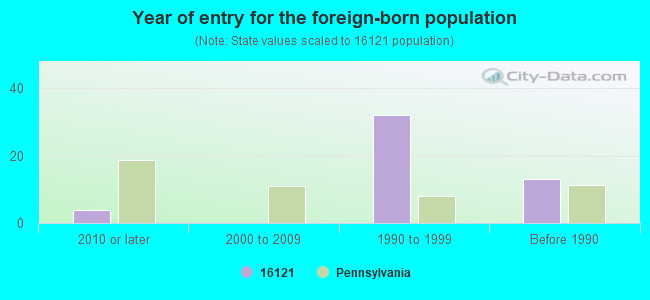
Year of entry for the foreign-born population
42010 or later
02000 to 2009
321990 to 1999
13Before 1990
Facilities with environmental interests located in this zip code:
BIG THREE INDUSTRIES GAS (ROEMER BLVD in FARRELL, PA)
(Integrated Compliance Information System) - ICIS-03-1985-0173, FORMAL ENFORCEMENT ACTION, ICIS-03-1986-0063, ICIS-03-1978-0035, ICIS-03-1978-0045, ICIS-03-1986-0471, Conditionally Exempt Small Quantity Generators, less than 100 kg/month of hazardous waste (Resource Conservation and Recovery Act (tracking hazardous waste)) - notification Business SIC classification: STEEL WORKS, BLAST FURNACES (INCLUDING COKE OVENS), AND ROLLING MILLS Organizations: OPERNAME (CONTACT/OPERATOR)
, BIG THREE INDUSTRIES, INC (CONTACT/OWNER)
BERTRAM TOOL & MACH (1201 BROADWAY AVE in FARRELL, PA)
STATE MASTER (Pennsylvania database) - RCRIS-PAR000012153, HAZARDOUS WASTE PROGRAM Conditionally Exempt Small Quantity Generators, less than 100 kg/month of hazardous waste (Resource Conservation and Recovery Act (tracking hazardous waste)) - notification Organizations: BERTRAM TOOL & MACHINE CO INC (CONTACT/OWNER)
BENCHMARK INDUSTRIES INC (11 WALLIS AVE in FARRELL, PA)
Small Quantity Generators, between 100 kg and 1000 kg of hazardous waste/month (Resource Conservation and Recovery Act (tracking hazardous waste)) - notification Organizations: OPERNAME (CONTACT/OPERATOR)
, CLEMENT, H L JR (CONTACT/OWNER)
Housing units lacking complete plumbing facilities: 5.4% Housing units lacking complete kitchen facilities: 3.2%
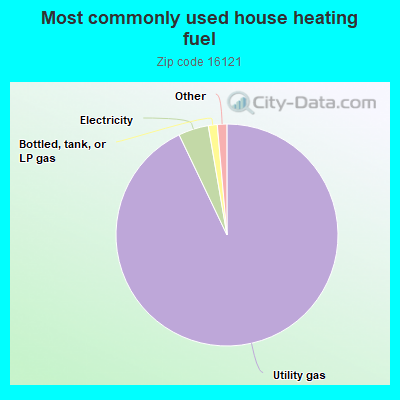
93.1%Utility gas
4.4%Electricity
1.3%Bottled, tank, or LP gas
0.7%Fuel oil, kerosene, etc.
0.7%No fuel used
Population in 1990: 7,619.
Place of birth for U.S.-born residents:
This state: 3,097
Northeast: 131
Midwest: 530
South: 412
West: 77
62% of the 16121 zip code residents lived in the same house 5 years ago. Out of people who lived in different houses, 79% lived in this county. Out of people who lived in different counties, 50% lived in Pennsylvania.
92% of the 16121 zip code residents lived in the same house 1 year ago. Out of people who lived in different houses, 66% moved from this county. Out of people who lived in different houses, 13% moved from different county within same state. Out of people who lived in different houses, 20% moved from different state.
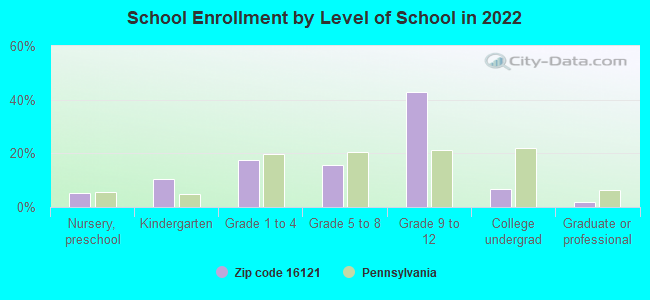
Private vs. public school enrollment:
Students in private schools in grades 1 to 8 (elementary and middle school): 2
Here:
0.6%
Pennsylvania:
15.7%
Students in private schools in grades 9 to 12 (high school): 10
Here:
2.5%
Pennsylvania:
13.4%
Students in private undergraduate colleges: 48
Here:
71.5%
Pennsylvania:
39.8%
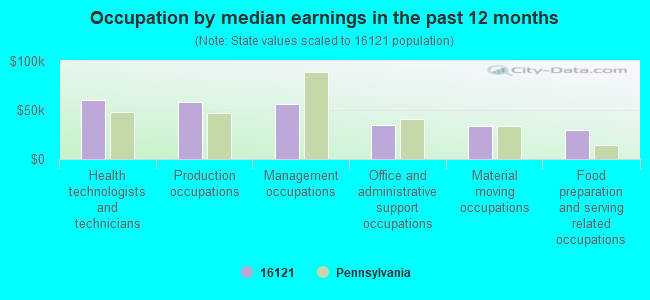
Occupation by median earnings in the past 12 months ($)
59,921Health technologists and technicians
58,549Production occupations
55,697Management occupations
34,508Office and administrative support occupations
34,017Material moving occupations
29,964Food preparation and serving related occupations
Companies with federal contracts located in this zip code:
FARBEN INC (1151 OVERLOOK AVE in FARRELL, PA; small business) : $159,800 in 2 contractsin 2005
$79,900 with Army for Maintenance, Repair or Alteration of Real Property -- Highways, Roads, Streets, Bridges, and Railways (includes resurfacing). Signed on 2005-06-03. Completion date: 2005-09-30.
$79,900 with U.S. Army Corps of Engineers - civil program financing only for Maintenance, Repair or Alteration of Real Property -- Highways, Roads, Streets, Bridges, and Railways (includes resurfacing). Signed on 2005-06-03. Completion date: 2005-09-30.
Top industries in this zip code by the number of employees in 2005:
Health Care and Social Assistance: General Medical and Surgical Hospitals (250-499 employees: 1 establishment)
Health Care and Social Assistance: Other Residential Care Facilities (50-99: 1)
Health Care and Social Assistance: Offices of Physicians (except Mental Health Specialists) (20-49: 1, 10-19: 1, 1-4: 2)
Other Services (except Public Administration): Religious Organizations (10-19: 2, 5-9: 1, 1-4: 3)
Other Services (except Public Administration): Civic and Social Organizations (5-9: 3, 1-4: 7)
People in group quarters in 2010:
135 people in other noninstitutional facilities
18 people in group homes for juveniles (non-correctional)
10 people in emergency and transitional shelters (with sleeping facilities) for people experiencing homelessness
3 people in nursing facilities/skilled-nursing facilities
3 people in group homes intended for adults
3 people in residential treatment centers for adults
People in group quarters in 2000:
50 people in nursing homes
48 people in other noninstitutional group quarters
12 people in homes for the mentally retarded
4 people in religious group quarters
Fatal accident statistics in 2013:
Fatal accident count: 1
Vehicles involved in fatal accidents: 1
Fatal accidents caused by drunken drivers: 0
Fatalities: 1
Persons involved in fatal accidents: 2
Pedestrians involved in fatal accidents: 0
Fatal accident statistics in 2012:
Fatal accident count: 1
Vehicles involved in fatal accidents: 1
Fatal accidents caused by drunken drivers: 1
Fatalities: 1
Persons involved in fatal accidents: 1
Pedestrians involved in fatal accidents: 0
Home Mortgage Disclosure Act Aggregated Statistics For Year 2009 (Based on 4 full and 4 partial tracts)
A) FHA, FSA/RHS & VA Home Purchase Loans
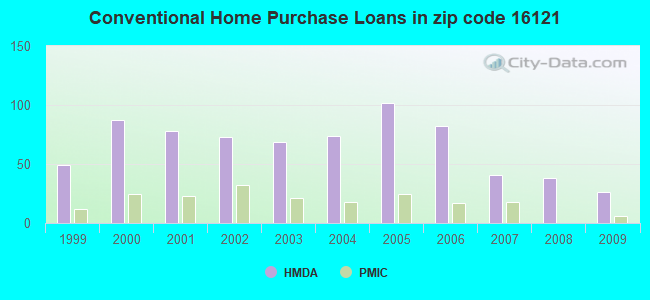
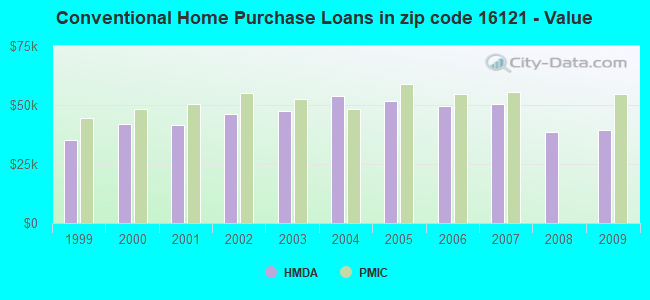
B) Conventional Home Purchase Loans
C) Refinancings
D) Home Improvement Loans
F) Non-occupant Loans on < 5 Family Dwellings (A B C & D)
Number
Average Value
Number
Average Value
Number
Average Value
Number
Average Value
Number
Average Value
LOANS ORIGINATED
23
$55,691
26
$39,418
33
$66,240
8
$34,384
10
$38,546
APPLICATIONS APPROVED, NOT ACCEPTED
0
$0
4
$8,580
8
$32,216
6
$20,150
0
$0
APPLICATIONS DENIED
6
$47,430
6
$28,373
57
$55,062
34
$14,694
8
$43,305
APPLICATIONS WITHDRAWN
2
$68,420
2
$66,960
16
$72,247
2
$20,460
0
$0
FILES CLOSED FOR INCOMPLETENESS
2
$31,620
0
$0
6
$39,500
2
$21,230
0
$0
Aggregated Statistics For Year 2008 (Based on 4 full and 4 partial tracts)
A) FHA, FSA/RHS & VA Home Purchase Loans
B) Conventional Home Purchase Loans
C) Refinancings
D) Home Improvement Loans
F) Non-occupant Loans on < 5 Family Dwellings (A B C & D)
Number
Average Value
Number
Average Value
Number
Average Value
Number
Average Value
Number
Average Value
LOANS ORIGINATED
34
$54,415
38
$38,685
44
$52,230
22
$24,525
13
$34,083
APPLICATIONS APPROVED, NOT ACCEPTED
0
$0
0
$0
29
$39,571
11
$20,056
6
$29,450
APPLICATIONS DENIED
11
$41,765
8
$49,892
104
$66,573
51
$31,958
8
$24,864
APPLICATIONS WITHDRAWN
2
$40,920
4
$39,060
20
$55,478
0
$0
2
$51,150
FILES CLOSED FOR INCOMPLETENESS
0
$0
0
$0
4
$124,068
2
$41,850
2
$29,760
Aggregated Statistics For Year 2007 (Based on 4 full and 4 partial tracts)
A) FHA, FSA/RHS & VA Home Purchase Loans
B) Conventional Home Purchase Loans
C) Refinancings
D) Home Improvement Loans
F) Non-occupant Loans on < 5 Family Dwellings (A B C & D)
G) Loans On Manufactured Home Dwelling (A B C & D)
Number
Average Value
Number
Average Value
Number
Average Value
Number
Average Value
Number
Average Value
Number
Average Value
LOANS ORIGINATED
10
$66,826
41
$50,622
79
$49,018
60
$24,872
19
$41,352
0
$0
APPLICATIONS APPROVED, NOT ACCEPTED
4
$49,290
13
$27,612
31
$59,151
6
$17,190
6
$18,285
0
$0
APPLICATIONS DENIED
0
$0
28
$48,911
212
$64,183
55
$24,505
25
$21,029
2
$30,525
APPLICATIONS WITHDRAWN
2
$31,620
2
$35,340
39
$89,369
0
$0
0
$0
0
$0
FILES CLOSED FOR INCOMPLETENESS
0
$0
0
$0
10
$67,252
0
$0
2
$54,870
0
$0
Aggregated Statistics For Year 2006 (Based on 4 full and 4 partial tracts)
A) FHA, FSA/RHS & VA Home Purchase Loans
B) Conventional Home Purchase Loans
C) Refinancings
D) Home Improvement Loans
F) Non-occupant Loans on < 5 Family Dwellings (A B C & D)
Number
Average Value
Number
Average Value
Number
Average Value
Number
Average Value
Number
Average Value
LOANS ORIGINATED
23
$64,671
82
$49,718
123
$54,551
48
$25,919
29
$35,221
APPLICATIONS APPROVED, NOT ACCEPTED
0
$0
3
$44,653
36
$54,873
4
$41,670
0
$0
APPLICATIONS DENIED
0
$0
19
$44,947
256
$57,702
71
$26,774
12
$31,924
APPLICATIONS WITHDRAWN
0
$0
10
$50,629
87
$70,932
2
$8,000
2
$39,990
FILES CLOSED FOR INCOMPLETENESS
0
$0
2
$49,290
16
$76,177
4
$30,225
2
$41,850
Aggregated Statistics For Year 2005 (Based on 4 full and 4 partial tracts)
A) FHA, FSA/RHS & VA Home Purchase Loans
B) Conventional Home Purchase Loans
C) Refinancings
D) Home Improvement Loans
F) Non-occupant Loans on < 5 Family Dwellings (A B C & D)
G) Loans On Manufactured Home Dwelling (A B C & D)
Number
Average Value
Number
Average Value
Number
Average Value
Number
Average Value
Number
Average Value
Number
Average Value
LOANS ORIGINATED
16
$57,261
102
$51,642
140
$54,212
50
$24,872
19
$38,303
2
$44,985
APPLICATIONS APPROVED, NOT ACCEPTED
0
$0
27
$54,223
45
$57,408
16
$34,901
8
$54,602
0
$0
APPLICATIONS DENIED
0
$0
30
$46,118
290
$59,389
85
$15,625
22
$15,400
0
$0
APPLICATIONS WITHDRAWN
0
$0
10
$76,892
97
$75,489
22
$101,711
12
$32,299
0
$0
FILES CLOSED FOR INCOMPLETENESS
0
$0
2
$49,290
18
$82,912
4
$46,500
0
$0
0
$0
Aggregated Statistics For Year 2004 (Based on 4 full and 4 partial tracts)
A) FHA, FSA/RHS & VA Home Purchase Loans
B) Conventional Home Purchase Loans
C) Refinancings
D) Home Improvement Loans
F) Non-occupant Loans on < 5 Family Dwellings (A B C & D)
G) Loans On Manufactured Home Dwelling (A B C & D)
Number
Average Value
Number
Average Value
Number
Average Value
Number
Average Value
Number
Average Value
Number
Average Value
LOANS ORIGINATED
9
$46,974
74
$53,883
137
$53,523
40
$24,744
26
$36,467
0
$0
APPLICATIONS APPROVED, NOT ACCEPTED
0
$0
12
$56,561
49
$48,884
10
$12,923
6
$22,217
0
$0
APPLICATIONS DENIED
2
$47,280
37
$53,116
317
$54,668
99
$14,731
41
$18,162
2
$84,770
APPLICATIONS WITHDRAWN
0
$0
16
$39,546
124
$57,747
13
$45,648
4
$31,620
0
$0
FILES CLOSED FOR INCOMPLETENESS
0
$0
2
$108,810
40
$74,541
2
$15,810
0
$0
0
$0
Aggregated Statistics For Year 2003 (Based on 4 full and 4 partial tracts)
A) FHA, FSA/RHS & VA Home Purchase Loans
B) Conventional Home Purchase Loans
C) Refinancings
D) Home Improvement Loans
F) Non-occupant Loans on < 5 Family Dwellings (A B C & D)
Number
Average Value
Number
Average Value
Number
Average Value
Number
Average Value
Number
Average Value
LOANS ORIGINATED
18
$61,264
69
$47,414
240
$47,680
44
$24,026
29
$34,394
APPLICATIONS APPROVED, NOT ACCEPTED
0
$0
13
$62,583
70
$54,278
16
$22,407
0
$0
APPLICATIONS DENIED
4
$43,710
31
$54,047
326
$56,686
49
$8,034
18
$35,686
APPLICATIONS WITHDRAWN
0
$0
14
$37,131
97
$61,849
2
$5,790
6
$29,787
FILES CLOSED FOR INCOMPLETENESS
0
$0
0
$0
8
$32,556
0
$0
2
$23,250
Aggregated Statistics For Year 2002 (Based on 4 full and 4 partial tracts)
A) FHA, FSA/RHS & VA Home Purchase Loans
B) Conventional Home Purchase Loans
C) Refinancings
D) Home Improvement Loans
F) Non-occupant Loans on < 5 Family Dwellings (A B C & D)
Number
Average Value
Number
Average Value
Number
Average Value
Number
Average Value
Number
Average Value
LOANS ORIGINATED
21
$65,780
73
$45,980
156
$46,254
47
$19,003
15
$33,358
APPLICATIONS APPROVED, NOT ACCEPTED
0
$0
15
$62,992
88
$45,694
14
$23,064
6
$36,065
APPLICATIONS DENIED
2
$68,820
26
$51,181
298
$53,107
86
$15,648
10
$51,732
APPLICATIONS WITHDRAWN
0
$0
13
$64,148
100
$53,110
12
$9,437
2
$13,995
FILES CLOSED FOR INCOMPLETENESS
0
$0
4
$51,880
41
$52,115
0
$0
0
$0
Aggregated Statistics For Year 2001 (Based on 4 full and 4 partial tracts)
A) FHA, FSA/RHS & VA Home Purchase Loans
B) Conventional Home Purchase Loans
C) Refinancings
D) Home Improvement Loans
F) Non-occupant Loans on < 5 Family Dwellings (A B C & D)
Number
Average Value
Number
Average Value
Number
Average Value
Number
Average Value
Number
Average Value
LOANS ORIGINATED
7
$67,757
78
$41,727
216
$42,799
73
$16,960
27
$25,719
APPLICATIONS APPROVED, NOT ACCEPTED
0
$0
8
$58,062
82
$38,670
22
$20,731
6
$41,432
APPLICATIONS DENIED
4
$51,232
21
$36,906
241
$40,079
108
$10,398
12
$31,066
APPLICATIONS WITHDRAWN
0
$0
6
$25,818
70
$42,395
2
$5,295
0
$0
FILES CLOSED FOR INCOMPLETENESS
0
$0
2
$66,030
31
$51,078
0
$0
2
$66,030
Aggregated Statistics For Year 2000 (Based on 4 full and 4 partial tracts)
A) FHA, FSA/RHS & VA Home Purchase Loans
B) Conventional Home Purchase Loans
C) Refinancings
D) Home Improvement Loans
F) Non-occupant Loans on < 5 Family Dwellings (A B C & D)
Number
Average Value
Number
Average Value
Number
Average Value
Number
Average Value
Number
Average Value
LOANS ORIGINATED
11
$43,221
87
$41,941
171
$35,431
50
$14,098
24
$21,658
APPLICATIONS APPROVED, NOT ACCEPTED
0
$0
15
$46,867
51
$41,250
21
$13,077
4
$28,388
APPLICATIONS DENIED
2
$43,710
41
$39,656
208
$39,046
84
$16,258
10
$16,375
APPLICATIONS WITHDRAWN
0
$0
13
$36,752
97
$37,009
12
$13,480
13
$27,548
FILES CLOSED FOR INCOMPLETENESS
2
$26,050
8
$40,519
31
$40,679
2
$37,415
2
$24,990
Aggregated Statistics For Year 1999 (Based on 2 full and 2 partial tracts)
A) FHA, FSA/RHS & VA Home Purchase Loans
B) Conventional Home Purchase Loans
C) Refinancings
D) Home Improvement Loans
F) Non-occupant Loans on < 5 Family Dwellings (A B C & D)
2003 - 2018 National Fire Incident Reporting System (NFIRS) incidents
According to the data from the years 2003 - 2018 the average number of fire incidents per year is 14. The highest number of reported fires - 29 took place in 2017, and the least - 0 in 2012. The data has a decreasing trend.
When looking into fire subcategories, the most reports belonged to: Structure Fires (53.7%), and Outside Fires (19.4%).
Fire incident types reported to NFIRS in Zip Code 16121


 Nearest zip codes: 16161, 16146, 44438, 16159, 16148, 16150.


 According to the data from the years 2003 - 2018 the average number of fire incidents per year is 14. The highest number of reported fires - 29 took place in 2017, and the least - 0 in 2012. The data has a decreasing trend.
 When looking into fire subcategories, the most reports belonged to: Structure Fires (53.7%), and Outside Fires (19.4%).