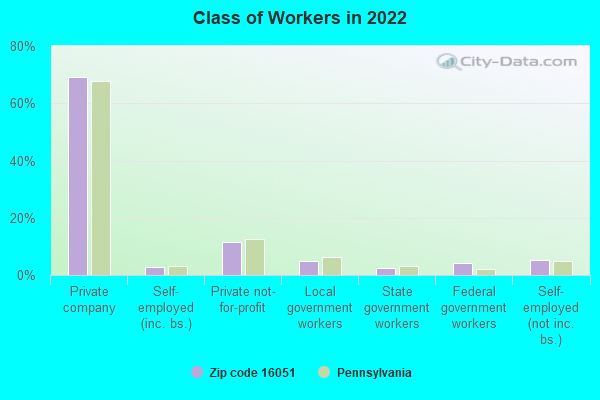
Estimated zip code population in 2022: 3,030 Zip code population in 2010: 3,043 Zip code population in 2000: 3,359
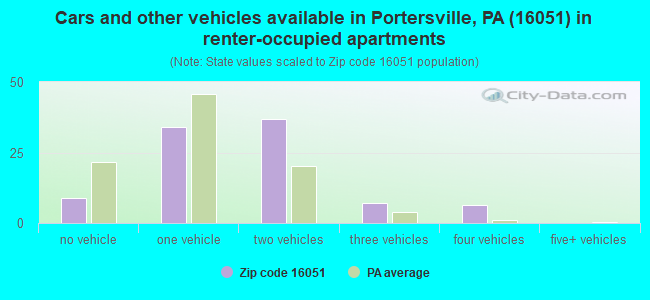
Houses and condos: 1,333 Renter-occupied apartments: 93
% of renters here:
7%
State:
31%
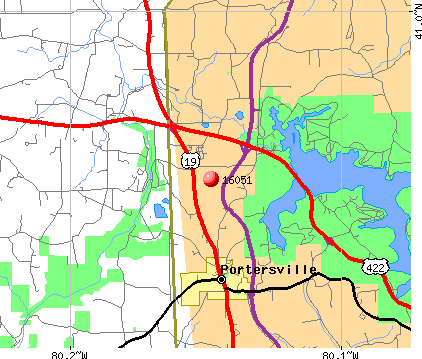
March 2022 cost of living index in zip code 16051: 87.8 (less than average, U.S. average is 100)
Land area: 38.9 sq. mi. Water area: 3.0 sq. mi.
Population density: 78 people per square mile
(very low).
OSM Map
General Map
Google Map
MSN Map
OSM Map
General Map
Google Map
MSN Map
OSM Map
General Map
Google Map
MSN Map
OSM Map
General Map
Google Map
MSN Map
Please wait while loading the map...
Real estate property taxes paid for housing units in 2022:
This zip code:
0.8% ($1,704)
Pennsylvania:
1.3% ($3,094)
Median real estate property taxes paid for housing units with mortgages in 2022: $2,340 (0.8%) Median real estate property taxes paid for housing units with no mortgage in 2022: $1,172 (1.1%)
Estimated median house/condo value in 2022: $212,072
16051:
$212,072
Pennsylvania:
$245,500
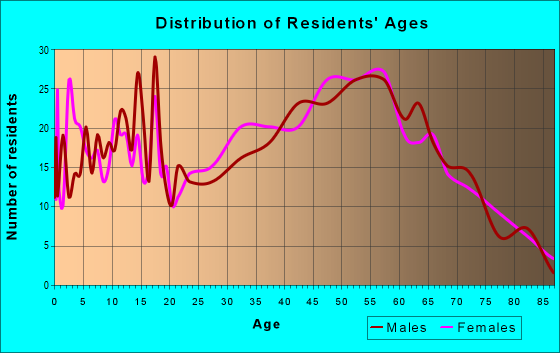
Median resident age:
This zip code:
42.2 years
Pennsylvania median age:
40.9 years
Average household size:
This zip code:
2.4 people
Pennsylvania:
2.4 people
Averages for the 2020 tax year for zip code 16051, filed in 2021:
Average Adjusted Gross Income (AGI) in 2020: $64,850 (Individual Income Tax Returns)
Here:
$64,850
State:
$75,707
Salary/wage: $53,550 (reported on 79.6% of returns)
Here:
$53,550
State:
$62,806
(% of AGI for various income ranges: 964.5% for AGIs below $25k, 3371.5% for AGIs $25k-50k, 5783.7% for AGIs $50k-75k, 9257.0% for AGIs $75k-100k, 13432.5% for AGIs $100k-200k)
Taxable interest for individuals: $1,128 (reported on 32.0% of returns)
This zip code:
$1,128
Pennsylvania:
$1,633
(% of AGI for various income ranges: 28.8% for AGIs below $25k, 24.4% for AGIs $25k-50k, 13.2% for AGIs $50k-75k, 47.0% for AGIs $75k-100k, 104.4% for AGIs $100k-200k)
Ordinary dividends: $4,624 (reported on 22.4% of returns)
Here:
$4,624
State:
$7,382
(% of AGI for various income ranges: 21.2% for AGIs below $25k, 39.6% for AGIs $25k-50k, 59.5% for AGIs $50k-75k, 185.0% for AGIs $75k-100k, 316.9% for AGIs $100k-200k)
Net capital gain/loss in AGI: +$6,500 (reported on 17.7% of returns)
Here:
+$6,500
State:
+$23,522
(% of AGI for various income ranges: 15.2% for AGIs below $25k, 60.0% for AGIs $25k-50k, 26.3% for AGIs $50k-75k, 133.0% for AGIs $75k-100k, 428.1% for AGIs $100k-200k)
Profit/loss from business: +$10,878 (reported on 12.2% of returns)
Here:
+$10,878
State:
+$16,274
(% of AGI for various income ranges: 70.6% for AGIs below $25k, 143.3% for AGIs $25k-50k, 244.2% for AGIs $50k-75k, 546.2% for AGIs $100k-200k)
Taxable individual retirement arrangement distribution: $14,320 (reported on 13.6% of returns)
16051:
$14,320
Pennsylvania:
$18,583
(% of AGI for various income ranges: 117.0% for AGIs below $25k, 135.9% for AGIs $25k-50k, 132.6% for AGIs $50k-75k, 441.0% for AGIs $75k-100k, 886.3% for AGIs $100k-200k)
Total itemized deductions: $31,633 (reported on 4.1% of returns)
Here:
$31,633
State:
$34,850
(% of AGI for various income ranges: 165.6% for AGIs $25k-50k, 906.9% for AGIs $100k-200k)
Charity contributions: $11,640 (reported on 3.4% of returns)
Here:
$11,640
State:
$12,392
(% of AGI for various income ranges: 363.8% for AGIs $100k-200k)
Taxes paid: $7,200 (reported on 4.8% of returns)
16051:
$7,200
State:
$8,200
(% of AGI for various income ranges: 44.1% for AGIs $25k-50k, 240.6% for AGIs $100k-200k)
Earned income credit: $1,727 (reported on 10.2% of returns)
Here:
$1,727
State:
$2,100
(% of AGI for various income ranges: 47.0% for AGIs below $25k, 38.5% for AGIs $25k-50k)
Percentage of individuals using paid preparers for their 2020 taxes: 93.9%
Here:
94%
State:
92%
(% for various income ranges: 91.5% for AGIs below $25k, 97.1% for AGIs $25k-50k, 95.7% for AGIs $50k-75k, 93.3% for AGIs $75k-100k, 95.5% for AGIs $100k-200k, 80.0% for AGIs over 200k)
Averages for the 2012 tax year for zip code 16051, filed in 2013:
Average Adjusted Gross Income (AGI) in 2012: $55,081 (Individual Income Tax Returns)
Here:
$55,081
State:
$61,346
Salary/wage: $43,849 (reported on 83.4% of returns)
Here:
$43,849
State:
$51,902
(% of AGI for various income ranges: 70.4% for AGIs below $25k, 77.8% for AGIs $25k-50k, 78.0% for AGIs $50k-75k, 75.0% for AGIs $75k-100k, 75.0% for AGIs $100k-200k, 27.6% for AGIs over 200k)
Taxable interest for individuals: $743 (reported on 34.4% of returns)
This zip code:
$743
Pennsylvania:
$1,588
(% of AGI for various income ranges: 1.2% for AGIs below $25k, 0.3% for AGIs $25k-50k, 0.4% for AGIs $50k-75k, 0.2% for AGIs $75k-100k, 0.3% for AGIs $100k-200k, 0.7% for AGIs over 200k)
Ordinary dividends: $2,590 (reported on 19.7% of returns)
Here:
$2,590
State:
$5,827
(% of AGI for various income ranges: 1.6% for AGIs below $25k, 0.8% for AGIs $25k-50k, 1.4% for AGIs $50k-75k, 0.7% for AGIs $75k-100k, 1.2% for AGIs $100k-200k)
Net capital gain/loss in AGI: +$2,957 (reported on 13.4% of returns)
Here:
+$2,957
State:
+$14,495
(% of AGI for various income ranges: 1.0% for AGIs $50k-75k, 2.4% for AGIs $100k-200k)
Profit/loss from business: +$9,495 (reported on 12.1% of returns)
Here:
+$9,495
State:
+$16,268
(% of AGI for various income ranges: 4.2% for AGIs below $25k, 3.2% for AGIs $25k-50k, 2.9% for AGIs $50k-75k, 3.0% for AGIs $100k-200k)
Taxable individual retirement arrangement distribution: $8,756 (reported on 11.5% of returns)
16051:
$8,756
Pennsylvania:
$14,550
(% of AGI for various income ranges: 5.0% for AGIs below $25k, 1.6% for AGIs $25k-50k, 3.7% for AGIs $50k-75k, 2.1% for AGIs $100k-200k)
Total itemized deductions: $19,319 (19% of AGI, reported on 22.9% of returns)
Here:
$19,319
State:
$23,538
Here:
18.7% of AGI
State:
18.4% of AGI
(% of AGI for various income ranges: 7.1% for AGIs below $25k, 4.6% for AGIs $25k-50k, 6.8% for AGIs $50k-75k, 8.6% for AGIs $75k-100k, 10.8% for AGIs $100k-200k, 8.2% for AGIs over 200k)
Charity contributions: $2,904 (reported on 17.8% of returns)
Here:
$2,904
State:
$4,025
(% of AGI for various income ranges: 0.8% for AGIs $25k-50k, 0.8% for AGIs $50k-75k, 0.9% for AGIs $75k-100k, 1.6% for AGIs $100k-200k, 0.6% for AGIs over 200k)
Taxes paid: $7,466 (reported on 22.3% of returns)
16051:
$7,466
State:
$9,982
(% of AGI for various income ranges: 1.9% for AGIs below $25k, 1.2% for AGIs $25k-50k, 2.4% for AGIs $50k-75k, 3.0% for AGIs $75k-100k, 4.5% for AGIs $100k-200k, 3.6% for AGIs over 200k)
Earned income credit: $1,710 (reported on 13.4% of returns)
Here:
$1,710
State:
$2,106
(% of AGI for various income ranges: 3.2% for AGIs below $25k, 0.9% for AGIs $25k-50k)
Percentage of individuals using paid preparers for their 2012 taxes: 57.3%
Here:
57%
State:
53%
(% for various income ranges: 51.6% for AGIs below $25k, 60.0% for AGIs $25k-50k, 62.5% for AGIs $50k-75k, 60.0% for AGIs $75k-100k, 58.8% for AGIs $100k-200k, 75.0% for AGIs over 200k)
Averages for the 2004 tax year for zip code 16051, filed in 2005:
Average Adjusted Gross Income (AGI) in 2004: $39,863 (Individual Income Tax Returns)
Here:
$39,863
State:
$48,049
Salary/wage: $34,026 (reported on 86.0% of returns)
Here:
$34,026
State:
$42,646
(% of AGI for various income ranges: 75.0% for AGIs below $10k, 73.6% for AGIs $10k-25k, 82.6% for AGIs $25k-50k, 83.1% for AGIs $50k-75k, 80.7% for AGIs $75k-100k, 51.6% for AGIs over 100k)
Taxable interest for individuals: $1,615 (reported on 46.8% of returns)
This zip code:
$1,615
Pennsylvania:
$1,657
(% of AGI for various income ranges: 4.5% for AGIs below $10k, 1.8% for AGIs $10k-25k, 1.0% for AGIs $25k-50k, 1.0% for AGIs $50k-75k, 0.8% for AGIs $75k-100k, 3.9% for AGIs over 100k)
Taxable dividends: $1,453 (reported on 22.2% of returns)
Here:
$1,453
State:
$3,566
(% of AGI for various income ranges: 1.6% for AGIs below $10k, 1.5% for AGIs $10k-25k, 0.6% for AGIs $25k-50k, 0.5% for AGIs $50k-75k, 0.5% for AGIs $75k-100k, 1.1% for AGIs over 100k)
Net capital gain/loss: +$5,541 (reported on 15.3% of returns)
Here:
+$5,541
State:
+$9,716
(% of AGI for various income ranges: -2.1% for AGIs below $10k, 0.1% for AGIs $10k-25k, 0.4% for AGIs $25k-50k, 0.4% for AGIs $50k-75k, 1.2% for AGIs $75k-100k, 7.2% for AGIs over 100k)
Profit/loss from business: +$6,556 (reported on 14.5% of returns)
Here:
+$6,556
State:
+$14,267
(% of AGI for various income ranges: 9.3% for AGIs below $10k, 5.5% for AGIs $10k-25k, 3.8% for AGIs $25k-50k, 2.7% for AGIs $50k-75k, 1.7% for AGIs $75k-100k, -0.9% for AGIs over 100k)
IRA payment deduction: $2,200 (reported on 2.8% of returns)
16051:
$2,200
Pennsylvania:
$2,903
Total itemized deductions: $15,461 (21% of AGI, reported on 23.3% of returns)
Here:
$15,461
State:
$18,804
Here:
20.6% of AGI
State:
19.5% of AGI
(% of AGI for various income ranges: 6.7% for AGIs $10k-25k, 7.1% for AGIs $25k-50k, 9.5% for AGIs $50k-75k, 11.7% for AGIs $75k-100k, 11.0% for AGIs over 100k)
Charity contributions deductions: $2,313 (3% of AGI, reported on 19.8% of returns)
Here:
$2,313
State:
$3,337
Here:
2.9% of AGI
State:
3.3% of AGI
(% of AGI for various income ranges: 0.8% for AGIs $10k-25k, 0.9% for AGIs $25k-50k, 1.0% for AGIs $50k-75k, 1.8% for AGIs $75k-100k, 1.4% for AGIs over 100k)
Total tax: $5,398 (reported on 76.3% of returns)
16051:
$5,398
State:
$8,008
(% of AGI for various income ranges: 2.4% for AGIs below $10k, 4.7% for AGIs $10k-25k, 7.2% for AGIs $25k-50k, 8.6% for AGIs $50k-75k, 10.5% for AGIs $75k-100k, 18.1% for AGIs over 100k)
Earned income credit: $1,475 (reported on 12.5% of returns)
Here:
$1,475
State:
$1,643
Percentage of individuals using paid preparers for their 2004 taxes: 55.6%
Here:
56%
State:
56%
(% for various income ranges: 45.9% for AGIs below $10k, 53.9% for AGIs $10k-25k, 60.2% for AGIs $25k-50k, 62.4% for AGIs $50k-75k, 57.8% for AGIs $75k-100k, 55.2% for AGIs over 100k)
Household received Food Stamps/SNAP in the past 12 months: 140 Household did not receive Food Stamps/SNAP in the past 12 months: 1,129
Women who had a birth in the past 12 months: 62 (66 now married, 0 unmarried) Women who did not have a birth in the past 12 months: 669 (335 now married, 331 unmarried)
Housing units in zip code 16051 with a mortgage: 561 (56 second mortgage, 52 both second mortgage and home equity loan) Houses without a mortgage: 8
Median monthly owner costs for units with a mortgage: $1,463 Median monthly owner costs for units without a mortgage: $458
Residents with income below the poverty level in 2022:
This zip code:
10.2%
Whole state:
11.8%
Residents with income below 50% of the poverty level in 2022:
This zip code:
5.4%
Whole state:
6.1%
Median number of rooms in houses and condos:
Here:
6.4
State:
6.8
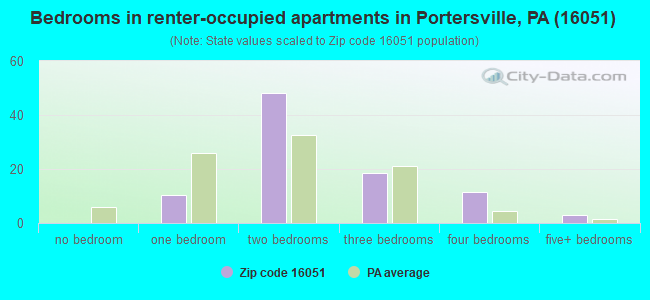
Median number of rooms in apartments:
Here:
4.9
State:
4.3
Notable locations in this zip code not listed on our city pages
In group quarters: 9 (-1 institutionalized population)
Size of family households: 363 2-persons, 149 3-persons, 188 4-persons, 80 5-persons, 20 6-persons, 13 7-or-more-persons
Size of nonfamily households: 395 1-person, 57 2-persons
583 married couples with children.
65 single-parent households (32 men, 33 women).
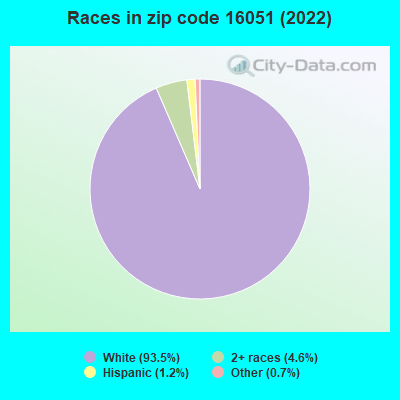
98.8% of residents of 16051 zip code speak English at home.
0.3% of residents speak other Indo-European language at home (100% not well).
0.1% of residents speak Asian or Pacific Island language at home (100% very well).
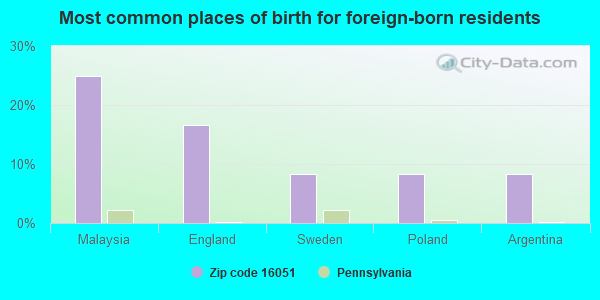
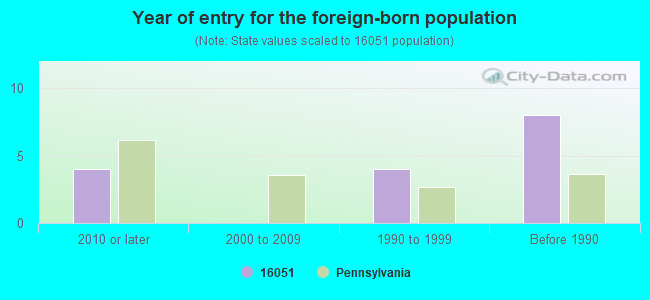
Foreign born population: 12 (0.4%) (67.6% of them are naturalized citizens)
This zip code:
0.4%
Whole state:
7.5%
25%Malaysia
17%England
8%Sweden
8%Poland
8%Argentina
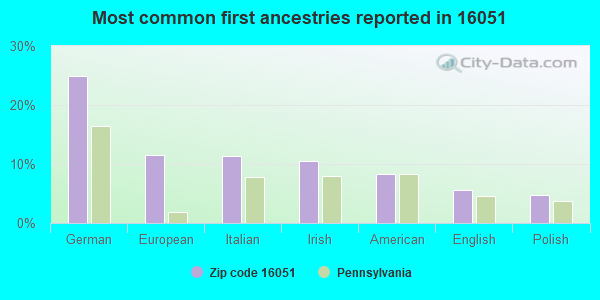
25%German
12%European
11%Italian
10%Irish
8%American
6%English
5%Polish
Year of entry for the foreign-born population
42010 or later
02000 to 2009
41990 to 1999
8Before 1990
Facilities with environmental interests located in this zip code:
ADAMS MFG. PLANT 1 (109 W. PARK RD. in PORTERSVILLE, PA)
STATE MASTER (Pennsylvania database) - RCRIS-PAD987398823, HAZARDOUS WASTE PROGRAM TRI REPORTER (Tracking of toxic chemicals releasing facilities) Business SIC classification: PLASTICS PRODUCTS Alternative names: ADAMS MANUFACTURING
ADAMS MFG (3 W PARK RD in PORTERSVILLE, PA)
Small Quantity Generators, between 100 kg and 1000 kg of hazardous waste/month (Resource Conservation and Recovery Act (tracking hazardous waste)) - notification Organizations: CORPORATION (CONTACT/OWNER)
Housing units lacking complete plumbing facilities: 2.0% Housing units lacking complete kitchen facilities: 1.3%
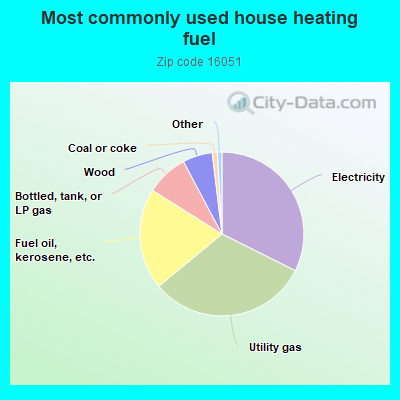
32.5%Electricity
31.7%Utility gas
20.0%Fuel oil, kerosene, etc.
8.3%Bottled, tank, or LP gas
5.9%Wood
1.0%Coal or coke
Population in 1990: 3,642.
Place of birth for U.S.-born residents:
This state: 2,525
Northeast: 124
Midwest: 170
South: 89
West: 88
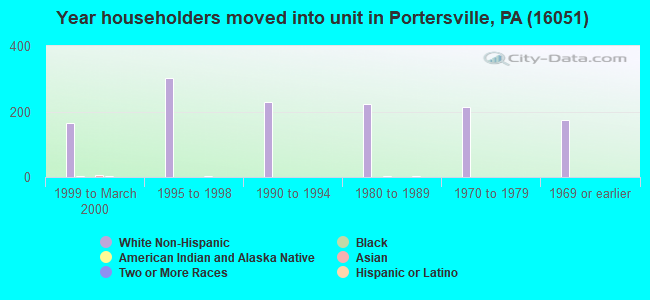
68% of the 16051 zip code residents lived in the same house 5 years ago. Out of people who lived in different houses, 44% lived in this county. Out of people who lived in different counties, 50% lived in Pennsylvania.
95% of the 16051 zip code residents lived in the same house 1 year ago. Out of people who lived in different houses, 35% moved from this county. Out of people who lived in different houses, 63% moved from different county within same state. Out of people who lived in different houses, 5% moved from different state.
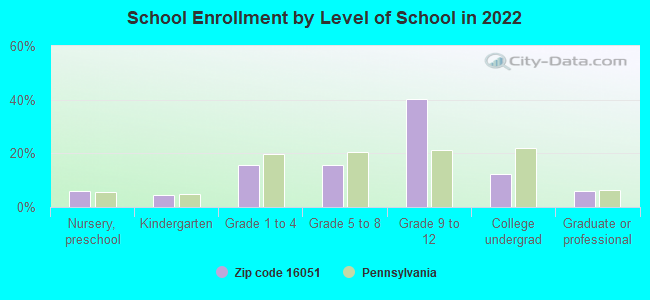
Private vs. public school enrollment:
Students in private schools in grades 1 to 8 (elementary and middle school): 55
Here:
26.7%
Pennsylvania:
15.7%
Students in private schools in grades 9 to 12 (high school): 48
Here:
18.6%
Pennsylvania:
13.4%
Students in private undergraduate colleges: 39
Here:
49.4%
Pennsylvania:
39.8%
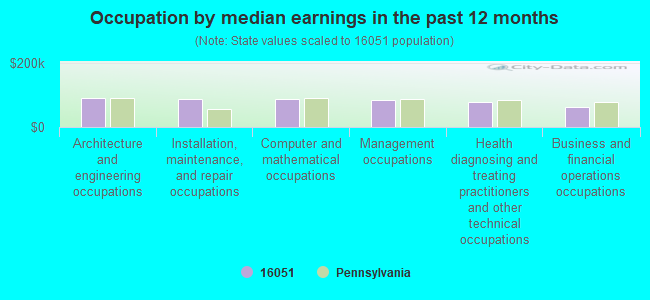
Occupation by median earnings in the past 12 months ($)
91,944Architecture and engineering occupations
88,983Installation, maintenance, and repair occupations
86,542Computer and mathematical occupations
84,834Management occupations
77,678Health diagnosing and treating practitioners and other technical occupations
61,913Business and financial operations occupations
Companies with federal contracts located in this zip code:
PORTERSVILLE SALES & TESTING (1406 PERRY HWY in PORTERSVILLE, PA; small business)
$47,447 with Air Force for Equipment and Materials Testing -- Weapons. Signed on 2001-09-27. Completion date: 2001-09-30.
Top industries in this zip code by the number of employees in 2005:
Other Services (except Public Administration): General Automotive Repair (50-99 employees: 1 establishment, 1-4 employees: 2 establishments)
Mining: Crushed and Broken Limestone Mining and Quarrying (50-99: 1)
Educational Services: Elementary and Secondary Schools (50-99: 1)
Accommodation and Food Services: Full-Service Restaurants (20-49: 1)
Other Services (except Public Administration): Commercial and Industrial Machinery and Equipment (except Automotive and Electronic) Repair and Maintenance (20-49: 1)
Other Services (except Public Administration): Religious Organizations (5-9: 3, 1-4: 2)
People in group quarters in 2000:
8 people in other group homes
Fatal accident statistics in 2014:
Fatal accident count: 2
Vehicles involved in fatal accidents: 4
Fatal accidents caused by drunken drivers: 1
Fatalities: 2
Persons involved in fatal accidents: 5
Pedestrians involved in fatal accidents: 0
Fatal accident statistics in 2012:
Fatal accident count: 2
Vehicles involved in fatal accidents: 3
Fatal accidents caused by drunken drivers: 0
Fatalities: 2
Persons involved in fatal accidents: 3
Pedestrians involved in fatal accidents: 1
Home Mortgage Disclosure Act Aggregated Statistics For Year 2009 (Based on 4 partial tracts)
A) FHA, FSA/RHS & VA Home Purchase Loans
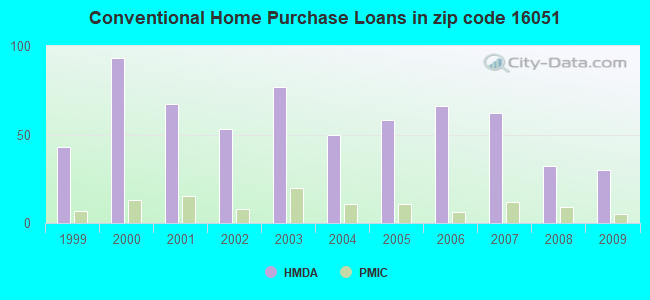
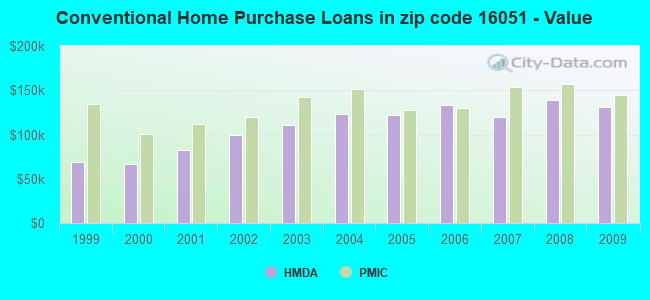
B) Conventional Home Purchase Loans
C) Refinancings
D) Home Improvement Loans
F) Non-occupant Loans on < 5 Family Dwellings (A B C & D)
G) Loans On Manufactured Home Dwelling (A B C & D)
Number
Average Value
Number
Average Value
Number
Average Value
Number
Average Value
Number
Average Value
Number
Average Value
LOANS ORIGINATED
11
$139,800
30
$131,597
120
$129,901
22
$43,514
3
$131,277
14
$61,156
APPLICATIONS APPROVED, NOT ACCEPTED
1
$129,650
5
$144,392
9
$145,434
1
$58,610
0
$0
1
$36,980
APPLICATIONS DENIED
2
$164,395
6
$99,843
29
$129,642
11
$31,489
2
$49,985
8
$47,540
APPLICATIONS WITHDRAWN
0
$0
2
$113,210
15
$141,503
2
$58,170
0
$0
2
$67,290
FILES CLOSED FOR INCOMPLETENESS
1
$36,110
0
$0
5
$148,838
0
$0
0
$0
1
$85,960
Aggregated Statistics For Year 2008 (Based on 4 partial tracts)
A) FHA, FSA/RHS & VA Home Purchase Loans
B) Conventional Home Purchase Loans
C) Refinancings
D) Home Improvement Loans
F) Non-occupant Loans on < 5 Family Dwellings (A B C & D)
G) Loans On Manufactured Home Dwelling (A B C & D)
Number
Average Value
Number
Average Value
Number
Average Value
Number
Average Value
Number
Average Value
Number
Average Value
LOANS ORIGINATED
9
$143,556
32
$138,968
64
$124,884
29
$47,419
3
$92,433
17
$73,389
APPLICATIONS APPROVED, NOT ACCEPTED
0
$0
4
$74,472
8
$101,488
3
$32,010
1
$43,340
4
$39,522
APPLICATIONS DENIED
1
$96,050
9
$86,736
58
$147,495
17
$37,506
1
$42,240
13
$56,192
APPLICATIONS WITHDRAWN
1
$163,740
2
$237,155
21
$157,357
4
$98,852
1
$81,170
1
$123,990
FILES CLOSED FOR INCOMPLETENESS
0
$0
2
$88,800
5
$144,148
1
$5,920
0
$0
0
$0
Aggregated Statistics For Year 2007 (Based on 4 partial tracts)
A) FHA, FSA/RHS & VA Home Purchase Loans
B) Conventional Home Purchase Loans
C) Refinancings
D) Home Improvement Loans
E) Loans on Dwellings For 5+ Families
F) Non-occupant Loans on < 5 Family Dwellings (A B C & D)
G) Loans On Manufactured Home Dwelling (A B C & D)
Number
Average Value
Number
Average Value
Number
Average Value
Number
Average Value
Number
Average Value
Number
Average Value
Number
Average Value
LOANS ORIGINATED
3
$202,650
62
$119,751
65
$119,519
33
$42,301
1
$213,120
7
$131,581
16
$71,899
APPLICATIONS APPROVED, NOT ACCEPTED
0
$0
6
$107,702
12
$129,163
4
$83,248
0
$0
1
$58,370
5
$79,776
APPLICATIONS DENIED
2
$132,775
14
$85,019
74
$121,671
19
$56,442
0
$0
2
$133,575
14
$65,809
APPLICATIONS WITHDRAWN
1
$14,800
5
$104,194
25
$123,533
2
$64,535
0
$0
1
$56,850
2
$49,430
FILES CLOSED FOR INCOMPLETENESS
0
$0
3
$118,480
10
$195,670
2
$68,670
0
$0
0
$0
0
$0
Aggregated Statistics For Year 2006 (Based on 4 partial tracts)
A) FHA, FSA/RHS & VA Home Purchase Loans
B) Conventional Home Purchase Loans
C) Refinancings
D) Home Improvement Loans
F) Non-occupant Loans on < 5 Family Dwellings (A B C & D)
G) Loans On Manufactured Home Dwelling (A B C & D)
Number
Average Value
Number
Average Value
Number
Average Value
Number
Average Value
Number
Average Value
Number
Average Value
LOANS ORIGINATED
5
$146,520
66
$133,234
78
$97,357
41
$33,468
5
$178,756
17
$68,188
APPLICATIONS APPROVED, NOT ACCEPTED
0
$0
9
$120,198
17
$88,982
5
$33,134
1
$56,660
4
$85,392
APPLICATIONS DENIED
1
$78,910
17
$73,212
87
$111,922
19
$40,718
3
$81,960
18
$67,423
APPLICATIONS WITHDRAWN
0
$0
8
$101,765
40
$122,367
2
$70,420
1
$165,610
6
$96,028
FILES CLOSED FOR INCOMPLETENESS
0
$0
2
$173,810
8
$152,370
0
$0
0
$0
0
$0
Aggregated Statistics For Year 2005 (Based on 4 partial tracts)
A) FHA, FSA/RHS & VA Home Purchase Loans
B) Conventional Home Purchase Loans
C) Refinancings
D) Home Improvement Loans
F) Non-occupant Loans on < 5 Family Dwellings (A B C & D)
G) Loans On Manufactured Home Dwelling (A B C & D)
Number
Average Value
Number
Average Value
Number
Average Value
Number
Average Value
Number
Average Value
Number
Average Value
LOANS ORIGINATED
3
$117,533
58
$121,676
101
$114,491
40
$40,742
7
$74,297
19
$53,987
APPLICATIONS APPROVED, NOT ACCEPTED
1
$118,400
11
$111,565
22
$119,000
7
$19,301
1
$33,170
9
$42,307
APPLICATIONS DENIED
0
$0
23
$74,891
88
$116,866
17
$28,361
4
$46,288
25
$61,271
APPLICATIONS WITHDRAWN
0
$0
7
$161,974
50
$115,621
7
$188,200
2
$96,415
2
$72,595
FILES CLOSED FOR INCOMPLETENESS
0
$0
2
$94,910
8
$131,919
1
$47,500
0
$0
1
$2,960
Aggregated Statistics For Year 2004 (Based on 4 partial tracts)
A) FHA, FSA/RHS & VA Home Purchase Loans
B) Conventional Home Purchase Loans
C) Refinancings
D) Home Improvement Loans
F) Non-occupant Loans on < 5 Family Dwellings (A B C & D)
G) Loans On Manufactured Home Dwelling (A B C & D)
Number
Average Value
Number
Average Value
Number
Average Value
Number
Average Value
Number
Average Value
Number
Average Value
LOANS ORIGINATED
3
$141,563
50
$123,402
122
$98,394
41
$36,776
8
$56,414
24
$59,341
APPLICATIONS APPROVED, NOT ACCEPTED
0
$0
4
$82,400
21
$82,058
3
$61,077
0
$0
4
$34,760
APPLICATIONS DENIED
1
$45,580
20
$76,776
84
$121,536
25
$27,182
4
$51,652
17
$47,964
APPLICATIONS WITHDRAWN
2
$68,785
6
$101,930
55
$103,683
4
$73,388
0
$0
4
$48,372
FILES CLOSED FOR INCOMPLETENESS
0
$0
3
$81,503
19
$121,363
0
$0
1
$100,640
0
$0
Aggregated Statistics For Year 2003 (Based on 4 partial tracts)
A) FHA, FSA/RHS & VA Home Purchase Loans
B) Conventional Home Purchase Loans
C) Refinancings
D) Home Improvement Loans
F) Non-occupant Loans on < 5 Family Dwellings (A B C & D)
Number
Average Value
Number
Average Value
Number
Average Value
Number
Average Value
Number
Average Value
LOANS ORIGINATED
2
$82,435
77
$110,822
233
$100,692
43
$32,804
9
$66,988
APPLICATIONS APPROVED, NOT ACCEPTED
0
$0
12
$74,745
42
$89,233
4
$51,255
2
$40,195
APPLICATIONS DENIED
1
$93,540
20
$58,976
109
$95,826
17
$41,555
5
$51,114
APPLICATIONS WITHDRAWN
0
$0
16
$110,586
38
$110,633
2
$20,255
1
$47,480
FILES CLOSED FOR INCOMPLETENESS
0
$0
4
$90,378
13
$119,746
3
$37,897
1
$30,430
Aggregated Statistics For Year 2002 (Based on 4 partial tracts)
A) FHA, FSA/RHS & VA Home Purchase Loans
B) Conventional Home Purchase Loans
C) Refinancings
D) Home Improvement Loans
F) Non-occupant Loans on < 5 Family Dwellings (A B C & D)
Number
Average Value
Number
Average Value
Number
Average Value
Number
Average Value
Number
Average Value
LOANS ORIGINATED
3
$108,673
53
$98,884
156
$95,768
35
$25,631
7
$42,131
APPLICATIONS APPROVED, NOT ACCEPTED
1
$128,860
11
$87,563
30
$91,111
5
$32,108
2
$35,370
APPLICATIONS DENIED
1
$96,490
34
$64,094
80
$89,313
14
$36,953
2
$132,385
APPLICATIONS WITHDRAWN
0
$0
9
$114,504
59
$105,312
5
$17,030
0
$0
FILES CLOSED FOR INCOMPLETENESS
0
$0
3
$70,647
15
$102,535
1
$11,840
1
$29,600
Aggregated Statistics For Year 2001 (Based on 4 partial tracts)
A) FHA, FSA/RHS & VA Home Purchase Loans
B) Conventional Home Purchase Loans
C) Refinancings
D) Home Improvement Loans
F) Non-occupant Loans on < 5 Family Dwellings (A B C & D)
Number
Average Value
Number
Average Value
Number
Average Value
Number
Average Value
Number
Average Value
LOANS ORIGINATED
4
$99,892
67
$82,697
132
$80,622
56
$15,870
9
$45,532
APPLICATIONS APPROVED, NOT ACCEPTED
1
$33,740
16
$59,971
44
$69,421
10
$20,510
2
$39,390
APPLICATIONS DENIED
1
$169,900
45
$45,038
83
$82,756
17
$25,341
1
$61,770
APPLICATIONS WITHDRAWN
0
$0
11
$67,138
52
$91,787
4
$17,898
1
$128,360
FILES CLOSED FOR INCOMPLETENESS
1
$74,590
0
$0
9
$84,331
1
$18,850
0
$0
Aggregated Statistics For Year 2000 (Based on 4 partial tracts)
A) FHA, FSA/RHS & VA Home Purchase Loans
B) Conventional Home Purchase Loans
C) Refinancings
D) Home Improvement Loans
F) Non-occupant Loans on < 5 Family Dwellings (A B C & D)
Number
Average Value
Number
Average Value
Number
Average Value
Number
Average Value
Number
Average Value
LOANS ORIGINATED
4
$88,738
93
$66,174
50
$76,723
61
$17,668
6
$71,990
APPLICATIONS APPROVED, NOT ACCEPTED
0
$0
22
$52,716
29
$71,949
11
$31,466
1
$75,360
APPLICATIONS DENIED
0
$0
67
$37,321
53
$69,969
21
$25,180
3
$36,717
APPLICATIONS WITHDRAWN
0
$0
9
$92,353
26
$79,055
5
$40,214
0
$0
FILES CLOSED FOR INCOMPLETENESS
0
$0
4
$67,228
6
$94,978
0
$0
0
$0
Aggregated Statistics For Year 1999 (Based on 2 partial tracts)
A) FHA, FSA/RHS & VA Home Purchase Loans
B) Conventional Home Purchase Loans
C) Refinancings
D) Home Improvement Loans
F) Non-occupant Loans on < 5 Family Dwellings (A B C & D)


 Nearest zip codes: 16052, 16037, 16057, 16123, 16117, 16101.