Estimated zip code population in 2022: 10,324 Zip code population in 2010: 11,114 Zip code population in 2000: 11,942
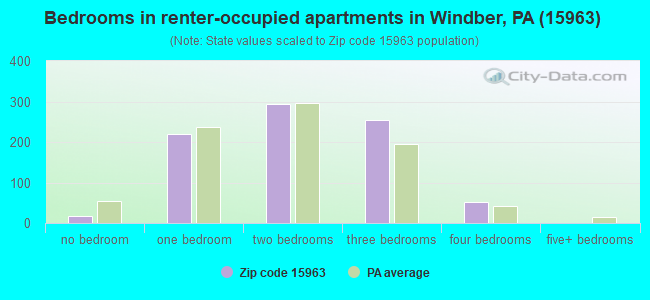
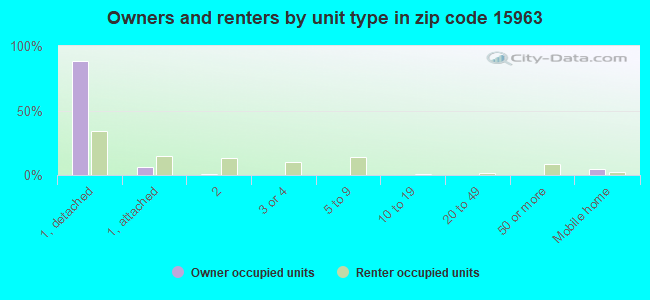
Houses and condos: 5,230 Renter-occupied apartments: 848
% of renters here:
19%
State:
31%
March 2022 cost of living index in zip code 15963: 83.7 (less than average, U.S. average is 100)
Land area: 97.7 sq. mi. Water area: 0.2 sq. mi.
Population density: 106 people per square mile
(very low).
OSM Map
General Map
Google Map
MSN Map
OSM Map
General Map
Google Map
MSN Map
OSM Map
General Map
Google Map
MSN Map
OSM Map
General Map
Google Map
MSN Map
Please wait while loading the map...
Real estate property taxes paid for housing units in 2022:
This zip code:
1.0% ($1,300)
Pennsylvania:
1.3% ($3,094)
Median real estate property taxes paid for housing units with mortgages in 2022: $1,630 (1.2%) Median real estate property taxes paid for housing units with no mortgage in 2022: $1,051 (1.0%)
Business Search- 14 Million verified businesses
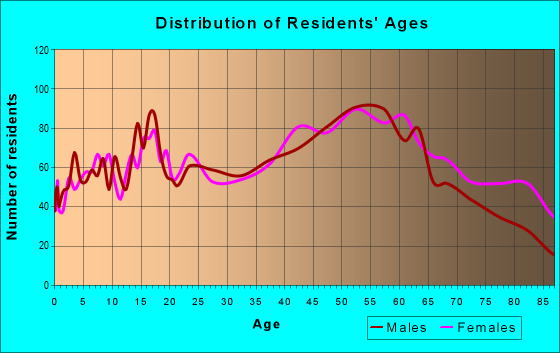
Males: 5,047
(48.9%)
Females: 5,276
(51.1%)
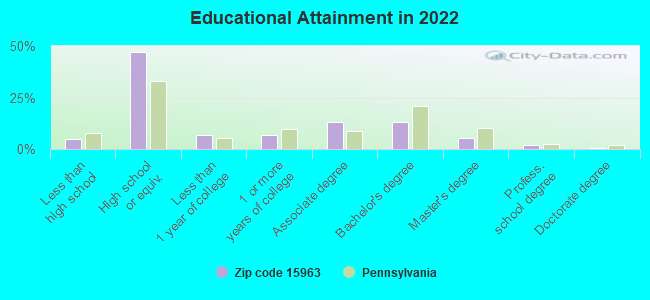
For population 25 years and over in 15963:
High school or higher: 94.5%
Bachelor's degree or higher: 21.0%
Graduate or professional degree: 7.8%
Unemployed: 3.7%
Mean travel time to work (commute): 24.7 minutes
For population 15 years and over in 15963:
Never married: 22.4%
Now married: 54.6%
Separated: 0.9%
Widowed: 9.0%
Divorced: 13.1%
Zip code 15963 compared to state average:
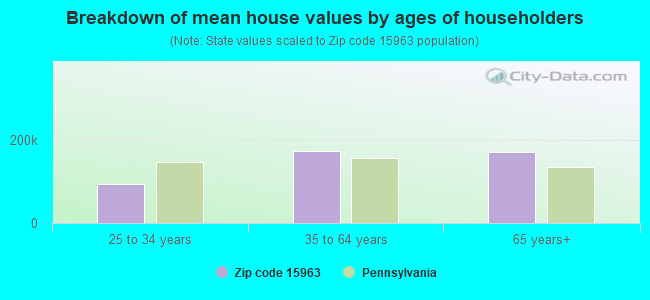
Median house value below state average.
Black race population percentage significantly below state average.
Hispanic race population percentage significantly below state average.
Median age above state average.
Foreign-born population percentage significantly below state average.
Renting percentage below state average.
Length of stay since moving in significantly above state average.
Number of college students below state average.
Percentage of population with a bachelor's degree or higher below state average.
Estimated median house/condo value in 2022: $127,417
15963:
$127,417
Pennsylvania:
$245,500
According to our research of Pennsylvania and other state lists, there were 11 registered sex offenders living in 15963 zip code as of May 25, 2024. The ratio of all residents to sex offenders in zip code 15963 is 988 to 1. The ratio of registered sex offenders to all residents in this zip code is lower than the state average.
Median resident age:
This zip code:
46.2 years
Pennsylvania median age:
40.9 years
Average household size:
This zip code:
2.3 people
Pennsylvania:
2.4 people
Averages for the 2020 tax year for zip code 15963, filed in 2021:
Average Adjusted Gross Income (AGI) in 2020: $55,928 (Individual Income Tax Returns)
Here:
$55,928
State:
$75,707
Salary/wage: $47,416 (reported on 78.9% of returns)
Here:
$47,416
State:
$62,806
(% of AGI for various income ranges: 979.0% for AGIs below $25k, 3182.2% for AGIs $25k-50k, 5575.9% for AGIs $50k-75k, 8440.5% for AGIs $75k-100k, 14772.6% for AGIs $100k-200k, 49370.0% for AGIs over 200k)
Taxable interest for individuals: $1,029 (reported on 35.3% of returns)
This zip code:
$1,029
Pennsylvania:
$1,633
(% of AGI for various income ranges: 23.4% for AGIs below $25k, 38.5% for AGIs $25k-50k, 41.0% for AGIs $50k-75k, 54.7% for AGIs $75k-100k, 123.3% for AGIs $100k-200k, 480.0% for AGIs over 200k)
Ordinary dividends: $2,447 (reported on 18.4% of returns)
Here:
$2,447
State:
$7,382
(% of AGI for various income ranges: 23.5% for AGIs below $25k, 26.0% for AGIs $25k-50k, 50.7% for AGIs $50k-75k, 83.7% for AGIs $75k-100k, 117.4% for AGIs $100k-200k, 1590.0% for AGIs over 200k)
Net capital gain/loss in AGI: +$7,372 (reported on 11.6% of returns)
Here:
+$7,372
State:
+$23,522
(% of AGI for various income ranges: 7.5% for AGIs below $25k, 20.3% for AGIs $25k-50k, 62.9% for AGIs $50k-75k, 72.4% for AGIs $75k-100k, 248.6% for AGIs $100k-200k, 6062.5% for AGIs over 200k)
Profit/loss from business: +$8,156 (reported on 10.5% of returns)
Here:
+$8,156
State:
+$16,274
(% of AGI for various income ranges: 45.1% for AGIs below $25k, 67.9% for AGIs $25k-50k, 140.0% for AGIs $50k-75k, 51.3% for AGIs $75k-100k, 237.1% for AGIs $100k-200k, 2722.5% for AGIs over 200k)
Taxable individual retirement arrangement distribution: $12,268 (reported on 14.1% of returns)
15963:
$12,268
Pennsylvania:
$18,583
(% of AGI for various income ranges: 134.8% for AGIs below $25k, 113.5% for AGIs $25k-50k, 257.8% for AGIs $50k-75k, 256.6% for AGIs $75k-100k, 554.8% for AGIs $100k-200k, 2972.5% for AGIs over 200k)
Total itemized deductions: $41,682 (reported on 2.1% of returns)
Here:
$41,682
State:
$34,850
(% of AGI for various income ranges: 43.6% for AGIs below $25k, 153.8% for AGIs $50k-75k, 240.5% for AGIs $100k-200k, 5290.0% for AGIs over 200k)
Charity contributions: $22,067 (reported on 1.2% of returns)
Here:
$22,067
State:
$12,392
(% of AGI for various income ranges: 7.4% for AGIs below $25k, 76.0% for AGIs $100k-200k, 2272.5% for AGIs over 200k)
Taxes paid: $5,418 (reported on 2.1% of returns)
15963:
$5,418
State:
$8,200
(% of AGI for various income ranges: 24.0% for AGIs $50k-75k, 50.0% for AGIs $100k-200k, 617.5% for AGIs over 200k)
Earned income credit: $2,073 (reported on 14.1% of returns)
Here:
$2,073
State:
$2,100
(% of AGI for various income ranges: 70.2% for AGIs below $25k, 56.2% for AGIs $25k-50k)
Percentage of individuals using paid preparers for their 2020 taxes: 94.6%
Here:
95%
State:
92%
(% for various income ranges: 92.7% for AGIs below $25k, 94.7% for AGIs $25k-50k, 95.9% for AGIs $50k-75k, 95.9% for AGIs $75k-100k, 96.7% for AGIs $100k-200k, 100.0% for AGIs over 200k)
Averages for the 2012 tax year for zip code 15963, filed in 2013:
Average Adjusted Gross Income (AGI) in 2012: $43,074 (Individual Income Tax Returns)
Here:
$43,074
State:
$61,346
Salary/wage: $39,766 (reported on 81.0% of returns)
Here:
$39,766
State:
$51,902
(% of AGI for various income ranges: 68.0% for AGIs below $25k, 76.9% for AGIs $25k-50k, 77.6% for AGIs $50k-75k, 77.3% for AGIs $75k-100k, 80.1% for AGIs $100k-200k, 52.6% for AGIs over 200k)
Taxable interest for individuals: $1,086 (reported on 40.0% of returns)
This zip code:
$1,086
Pennsylvania:
$1,588
(% of AGI for various income ranges: 2.1% for AGIs below $25k, 0.7% for AGIs $25k-50k, 0.7% for AGIs $50k-75k, 0.8% for AGIs $75k-100k, 1.1% for AGIs $100k-200k, 1.2% for AGIs over 200k)
Ordinary dividends: $2,771 (reported on 19.9% of returns)
Here:
$2,771
State:
$5,827
(% of AGI for various income ranges: 1.4% for AGIs below $25k, 0.8% for AGIs $25k-50k, 0.9% for AGIs $50k-75k, 0.8% for AGIs $75k-100k, 1.0% for AGIs $100k-200k, 4.8% for AGIs over 200k)
Net capital gain/loss in AGI: +$3,730 (reported on 10.7% of returns)
Here:
+$3,730
State:
+$14,495
(% of AGI for various income ranges: 0.3% for AGIs $25k-50k, 0.8% for AGIs $50k-75k, 0.7% for AGIs $75k-100k, 1.0% for AGIs $100k-200k, 4.4% for AGIs over 200k)
Profit/loss from business: +$10,185 (reported on 10.2% of returns)
Here:
+$10,185
State:
+$16,268
(% of AGI for various income ranges: 2.9% for AGIs below $25k, 1.8% for AGIs $25k-50k, 2.5% for AGIs $50k-75k, 2.1% for AGIs $75k-100k, 3.7% for AGIs $100k-200k)
Taxable individual retirement arrangement distribution: $9,486 (reported on 11.8% of returns)
15963:
$9,486
Pennsylvania:
$14,550
(% of AGI for various income ranges: 4.9% for AGIs below $25k, 2.3% for AGIs $25k-50k, 2.0% for AGIs $50k-75k, 2.6% for AGIs $75k-100k, 3.2% for AGIs $100k-200k)
Total itemized deductions: $19,455 (19% of AGI, reported on 14.7% of returns)
Here:
$19,455
State:
$23,538
Here:
19.2% of AGI
State:
18.4% of AGI
(% of AGI for various income ranges: 2.6% for AGIs below $25k, 3.8% for AGIs $25k-50k, 5.2% for AGIs $50k-75k, 5.8% for AGIs $75k-100k, 10.2% for AGIs $100k-200k, 15.0% for AGIs over 200k)
Charity contributions: $3,955 (reported on 11.3% of returns)
Here:
$3,955
State:
$4,025
(% of AGI for various income ranges: 0.3% for AGIs below $25k, 0.3% for AGIs $25k-50k, 0.6% for AGIs $50k-75k, 0.7% for AGIs $75k-100k, 1.8% for AGIs $100k-200k, 3.3% for AGIs over 200k)
Taxes paid: $6,659 (reported on 14.7% of returns)
15963:
$6,659
State:
$9,982
(% of AGI for various income ranges: 0.3% for AGIs below $25k, 0.8% for AGIs $25k-50k, 1.5% for AGIs $50k-75k, 1.9% for AGIs $75k-100k, 4.1% for AGIs $100k-200k, 6.2% for AGIs over 200k)
Earned income credit: $1,859 (reported on 15.2% of returns)
Here:
$1,859
State:
$2,106
(% of AGI for various income ranges: 4.1% for AGIs below $25k, 0.9% for AGIs $25k-50k)
Percentage of individuals using paid preparers for their 2012 taxes: 56.8%
Here:
57%
State:
53%
(% for various income ranges: 51.7% for AGIs below $25k, 58.5% for AGIs $25k-50k, 57.5% for AGIs $50k-75k, 64.3% for AGIs $75k-100k, 67.5% for AGIs $100k-200k, 83.3% for AGIs over 200k)
Averages for the 2004 tax year for zip code 15963, filed in 2005:
Average Adjusted Gross Income (AGI) in 2004: $32,771 (Individual Income Tax Returns)
Here:
$32,771
State:
$48,049
Salary/wage: $30,980 (reported on 83.1% of returns)
Here:
$30,980
State:
$42,646
(% of AGI for various income ranges: 79.6% for AGIs below $10k, 70.8% for AGIs $10k-25k, 81.9% for AGIs $25k-50k, 83.0% for AGIs $50k-75k, 83.0% for AGIs $75k-100k, 68.8% for AGIs over 100k)
Taxable interest for individuals: $1,551 (reported on 49.5% of returns)
This zip code:
$1,551
Pennsylvania:
$1,657
(% of AGI for various income ranges: 7.0% for AGIs below $10k, 3.7% for AGIs $10k-25k, 1.5% for AGIs $25k-50k, 1.7% for AGIs $50k-75k, 1.7% for AGIs $75k-100k, 3.2% for AGIs over 100k)
Taxable dividends: $1,626 (reported on 23.0% of returns)
Here:
$1,626
State:
$3,566
(% of AGI for various income ranges: 2.5% for AGIs below $10k, 1.2% for AGIs $10k-25k, 0.7% for AGIs $25k-50k, 0.9% for AGIs $50k-75k, 1.1% for AGIs $75k-100k, 2.0% for AGIs over 100k)
Net capital gain/loss: +$2,808 (reported on 12.7% of returns)
Here:
+$2,808
State:
+$9,716
(% of AGI for various income ranges: -0.5% for AGIs below $10k, 0.4% for AGIs $10k-25k, 0.5% for AGIs $25k-50k, 0.7% for AGIs $50k-75k, 1.7% for AGIs $75k-100k, 3.2% for AGIs over 100k)
Profit/loss from business: +$9,210 (reported on 11.8% of returns)
Here:
+$9,210
State:
+$14,267
(% of AGI for various income ranges: 2.7% for AGIs below $10k, 2.8% for AGIs $10k-25k, 2.9% for AGIs $25k-50k, 2.2% for AGIs $50k-75k, 1.6% for AGIs $75k-100k, 8.0% for AGIs over 100k)
IRA payment deduction: $2,629 (reported on 3.2% of returns)
15963:
$2,629
Pennsylvania:
$2,903
(% of AGI for various income ranges: 0.3% for AGIs $10k-25k, 0.4% for AGIs $25k-50k, 0.3% for AGIs $50k-75k, 0.2% for AGIs $75k-100k)
Total itemized deductions: $14,846 (20% of AGI, reported on 14.1% of returns)
Here:
$14,846
State:
$18,804
Here:
20.1% of AGI
State:
19.5% of AGI
(% of AGI for various income ranges: 4.9% for AGIs below $10k, 2.8% for AGIs $10k-25k, 4.5% for AGIs $25k-50k, 6.5% for AGIs $50k-75k, 10.1% for AGIs $75k-100k, 10.0% for AGIs over 100k)
Charity contributions deductions: $2,760 (4% of AGI, reported on 12.5% of returns)
Here:
$2,760
State:
$3,337
Here:
3.6% of AGI
State:
3.3% of AGI
(% of AGI for various income ranges: 0.3% for AGIs below $10k, 0.3% for AGIs $10k-25k, 0.6% for AGIs $25k-50k, 0.8% for AGIs $50k-75k, 1.8% for AGIs $75k-100k, 2.3% for AGIs over 100k)
Total tax: $4,023 (reported on 70.6% of returns)
15963:
$4,023
State:
$8,008
(% of AGI for various income ranges: 2.0% for AGIs below $10k, 3.8% for AGIs $10k-25k, 6.4% for AGIs $25k-50k, 8.5% for AGIs $50k-75k, 10.0% for AGIs $75k-100k, 17.9% for AGIs over 100k)
Earned income credit: $1,510 (reported on 15.8% of returns)
Here:
$1,510
State:
$1,643
Percentage of individuals using paid preparers for their 2004 taxes: 57.9%
Here:
58%
State:
56%
(% for various income ranges: 51.7% for AGIs below $10k, 56.7% for AGIs $10k-25k, 60.6% for AGIs $25k-50k, 61.5% for AGIs $50k-75k, 63.0% for AGIs $75k-100k, 71.9% for AGIs over 100k)
Likely homosexual households (counted as self-reported same-sex unmarried-partner households)
Lesbian couples: 0.3% of all households
Gay men: 0.0% of all households
Household received Food Stamps/SNAP in the past 12 months: 659 Household did not receive Food Stamps/SNAP in the past 12 months: 3,871
Women who had a birth in the past 12 months: 75 (70 now married, 7 unmarried) Women who did not have a birth in the past 12 months: 2,053 (986 now married, 1,060 unmarried)
Housing units in zip code 15963 with a mortgage: 1,791 (182 second mortgage, 5 home equity loan, 145 both second mortgage and home equity loan) Houses without a mortgage: 76
Median monthly owner costs for units with a mortgage: $1,110 Median monthly owner costs for units without a mortgage: $443
Residents with income below the poverty level in 2022:
This zip code:
10.2%
Whole state:
11.8%
Residents with income below 50% of the poverty level in 2022:
This zip code:
6.8%
Whole state:
6.1%
Median number of rooms in houses and condos:
Here:
6.9
State:
6.8
Median number of rooms in apartments:
Here:
4.8
State:
4.3
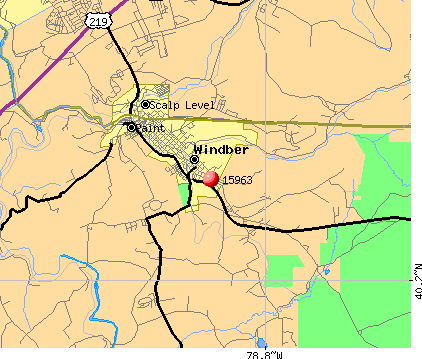
Notable locations in this zip code not listed on our city pages
Notable locations in zip code 15963: Arrow (A), Border (B), Eureka 36 Mine Station (C), End South Forkbranch Station (D), Eureka Stores Station (E), Eureka 33 Mine Station (F), Windber Country Club (G), Beaverdale Sportsmans Lodge (H), Windber Fire Company 1 (I), Scalp Level - Paint Volunteer Fire Company (J). Display/hide their locations on the map
Churches in zip code 15963 include: Holy Child Church (A), Saint Anthonys Church (B), Grace Church (C), Saints Peter and Paul Church (D), Calvary Church (E). Display/hide their locations on the map
Streams, rivers, and creeks: Weaver Run (A), Kaufman Run (B), Spruce Run (C), Cub Run (D), Little Paint Creek (E), Clear Shade Creek (F), Seese Run (G), Sandy Run (H), Roaring Fork (I). Display/hide their locations on the map
In group quarters: 118 (-1 institutionalized population)
Size of family households: 1,599 2-persons, 533 3-persons, 555 4-persons, 123 5-persons, 87 6-persons, 4 7-or-more-persons
Size of nonfamily households: 1,380 1-person, 245 2-persons
1,246 married couples with children.
598 single-parent households (253 men, 345 women).
98.4% of residents of 15963 zip code speak English at home.
0.9% of residents speak Spanish at home (92% very well, 3% well, 5% not well).
0.4% of residents speak other Indo-European language at home (94% very well, 6% well).
Foreign born population: 7 (0.1%) (72.2% of them are naturalized citizens)
This zip code:
0.1%
Whole state:
7.5%
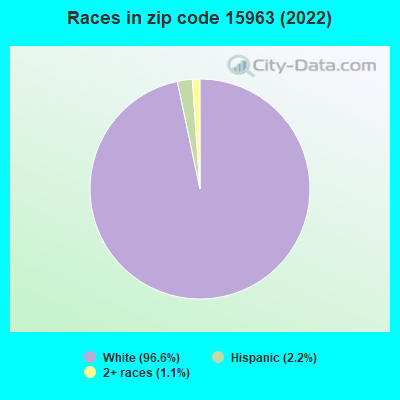
100%Colombia
14%Greece
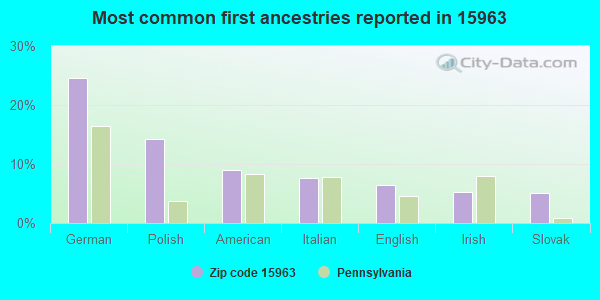
25%German
14%Polish
9%American
8%Italian
6%English
5%Irish
5%Slovak
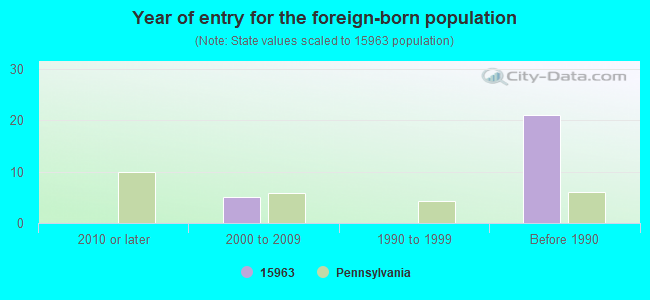
Year of entry for the foreign-born population
02010 or later
52000 to 2009
01990 to 1999
21Before 1990
Facilities with environmental interests located in this zip code:
BESTFORM FOUNDATION WINDBER PLT (1834 STOCKHOLM AVENUE in WINDBER, PA)
AIR MINOR (AIRS/AFS) STATE MASTER (Pennsylvania database) - RCRIS-PAD987366440, HAZARDOUS WASTE PROGRAM Conditionally Exempt Small Quantity Generators, less than 100 kg/month of hazardous waste (Resource Conservation and Recovery Act (tracking hazardous waste)) - notification Business SIC classification: FINISHERS OF BROADWOVEN FABRICS OF COTTON; BRASSIERES, GIRDLES, AND ALLIED GARMENTS Organizations: MARVIN BIENEFELD (CONTACT/OWNER)
, BESTFORM FOUNDATIONS INC (CONTACT/OWNER)
Alternative names: BESTFORM FOUNDATION OF WINBER INC, BESTFORM FOUNDATION WINBER, BESTFORM FOUNDATIONS INCORPORATED
FEATHER NEST MHP STP (FEATHER NEST MHP in WINDBER, PA)
STATE MASTER (Pennsylvania database) - PCS-PA0204625, National Pollutant Discharge Elimination System Permit National Pollutant Discharge Elimination System NON-MAJOR (Tracking pollutant discharge elimination systems) - permit Business SIC classification: OPERATORS OF RESIDENTIAL MOBILE HOME SITES Alternative names: FEATHER, ROBERT, ROBERT FEATHER
AOLVIN'S HONDA SALES (107 BANTLEY PLACE in WINDBER, PA)
AIR MINOR (AIRS/AFS) Conditionally Exempt Small Quantity Generators, less than 100 kg/month of hazardous waste (Resource Conservation and Recovery Act (tracking hazardous waste)) - notification Business SIC classification: MOTOR VEHICLE DEALERS (NEW AND USED); AUTOMOTIVE REPAIR SHOPS Organizations: ALAN MANGES (CONTACT/OWNER)
Alternative names: ALVINS HONDA SALES
AT & T LONG LINES EQUIP ENGR (8.8 MI E OF WINDBER in WINDBER, PA)
BERGMAN CHEVROLET (CHEVY DR PO BOX 387 in WINDBER, PA)
Conditionally Exempt Small Quantity Generators, less than 100 kg/month of hazardous waste (Resource Conservation and Recovery Act (tracking hazardous waste)) - notification Organizations: P DAVID BERGMAN (CONTACT/OWNER)
Housing units lacking complete plumbing facilities: 2.6% Housing units lacking complete kitchen facilities: 4.2%
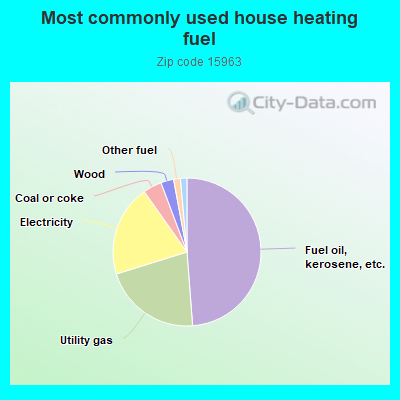
48.8%Fuel oil, kerosene, etc.
21.4%Utility gas
20.0%Electricity
4.1%Coal or coke
2.8%Wood
1.5%Other fuel
1.4%Bottled, tank, or LP gas
Population in 1990: 11,421. Population change in the 1990s: +521 (+4.6%).
Place of birth for U.S.-born residents:
This state: 9,173
Northeast: 257
Midwest: 230
South: 405
West: 154
74% of the 15963 zip code residents lived in the same house 5 years ago. Out of people who lived in different houses, 59% lived in this county. Out of people who lived in different counties, 50% lived in Pennsylvania.
97% of the 15963 zip code residents lived in the same house 1 year ago. Out of people who lived in different houses, 66% moved from this county. Out of people who lived in different houses, 40% moved from different county within same state. Out of people who lived in different houses, 2% moved from different state.
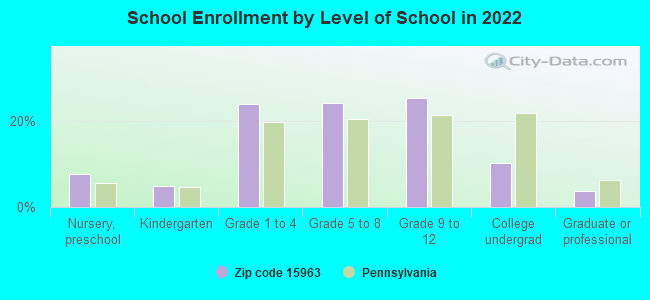
Private vs. public school enrollment:
Students in private schools in grades 1 to 8 (elementary and middle school): 100
Here:
11.0%
Pennsylvania:
15.7%
Students in private schools in grades 9 to 12 (high school): 5
Here:
1.1%
Pennsylvania:
13.4%
Students in private undergraduate colleges: 65
Here:
34.5%
Pennsylvania:
39.8%
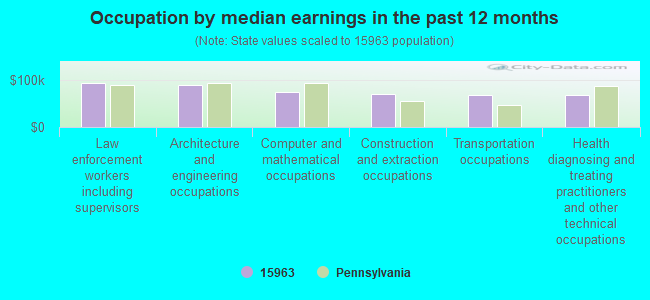
Occupation by median earnings in the past 12 months ($)
93,104Law enforcement workers including supervisors
89,657Architecture and engineering occupations
75,236Computer and mathematical occupations
69,388Construction and extraction occupations
68,570Transportation occupations
67,138Health diagnosing and treating practitioners and other technical occupations
Companies with federal contracts located in this zip code:
WINDBER PROFESSIONAL SERVICE, (600 SOMERSET AVE in WINDBER, PA; small business) : $12,819,925 in 5 contractsfrom 2002 to 2005
Contracts for Fiber Optic Conductors by Army Signed by year:2000: $0; 2001: $0; 2002: $1,278,168; 2003: $3,889,756; 2004: $3,096,938; 2005: $4,555,063; 2006: $0.
Biggest contracts:
$4,555,063 with Army for Fiber Optic Conductors. Signed on 2005-08-18. Completion date: 2003-06-14.
$3,889,756, same as above.Signed on 2003-02-19. Completion date: 2003-06-14.
$2,739,000, same as above.Signed on 2004-03-25. Completion date: 2003-06-14.
$1,278,168, same as above.Signed on 2002-05-31. Completion date: 2003-06-14.
KUCHERA DEFENSE SYSTEMS INC (345 HILLSIDE DR in WINDBER, PA; small business) : $12,521,831 in 31 contractsfrom 2000 to 2006
Contracts for Maintenance, Repair and Rebuilding of Equipment -- Miscellaneous, Defense Electronics and Communication Equipment -- Applied Research and Exploratory Development (R&D), Other Research and Development -- Engineering Development (R&D), Defense Tank - Automotive -- Advanced Development (R&D), and moreby Navy, Army, Air Force, United States Coast Guard (disused code: now 7008), and others Signed by year:2000: $146,431; 2001: $100,000; 2002: $240,000; 2003: $2,037,419; 2004: $2,360,161; 2005: $2,852,003; 2006: $4,785,817.
Biggest contracts:
$3,000,000 with Navy for Maintenance, Repair and Rebuilding of Equipment -- Miscellaneous. Signed on 2006-05-19. Completion date: 2007-06-18.
$2,000,000 with Navy for Defense Electronics and Communication Equipment -- Applied Research and Exploratory Development (R&D). Signed on 2004-08-02. Completion date: 2005-10-01.
$2,000,000 with Navy for Other Research and Development -- Engineering Development (R&D). Signed on 2003-09-26. Completion date: 2004-09-30.
$1,481,738 with Army for Defense Tank - Automotive -- Advanced Development (R&D). Signed on 2005-04-27. Completion date: 2005-10-30.
MARK LEVENTRY (2085 FOREST HILLS DRIVE in WINDBER, PA; small business)
$5,463 with Army for Maintenance, Repair or Alteration of Real Property -- Office Buildings. Signed on 2005-12-13. Completion date: 2005-12-13.
Top industries in this zip code by the number of employees in 2005:
Health Care and Social Assistance: General Medical and Surgical Hospitals (250-499 employees: 1 establishment)
Health Care and Social Assistance: Nursing Care Facilities (100-249: 1)
2003 - 2018 National Fire Incident Reporting System (NFIRS) incidents
According to the data from the years 2003 - 2018 the average number of fires per year is 21. The highest number of fire incidents - 58 took place in 2005, and the least - 4 in 2018. The data has a declining trend.
When looking into fire subcategories, the most reports belonged to: Structure Fires (67.4%), and Outside Fires (21.4%).
Fire incident types reported to NFIRS in Zip Code 15963


 Nearest zip codes: 15934, 15952, 15930, 15951, 15921, 15955.
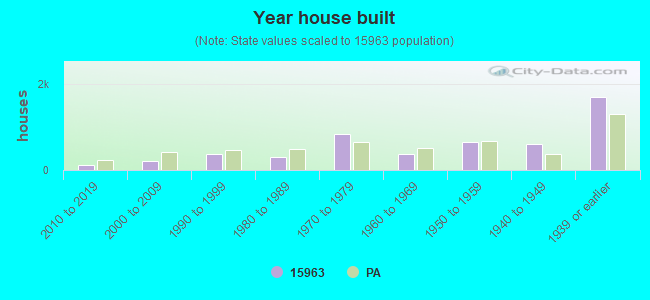


 According to the data from the years 2003 - 2018 the average number of fires per year is 21. The highest number of fire incidents - 58 took place in 2005, and the least - 4 in 2018. The data has a declining trend.
 When looking into fire subcategories, the most reports belonged to: Structure Fires (67.4%), and Outside Fires (21.4%).