Estimated zip code population in 2022: 2,405 Zip code population in 2010: 2,413 Zip code population in 2000: 2,764
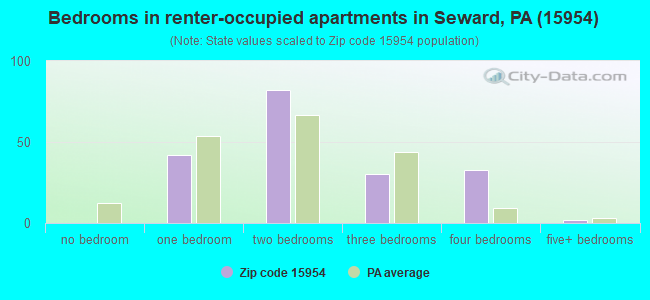
Houses and condos: 1,293 Renter-occupied apartments: 191
% of renters here:
16%
State:
31%
March 2022 cost of living index in zip code 15954: 89.8 (less than average, U.S. average is 100)
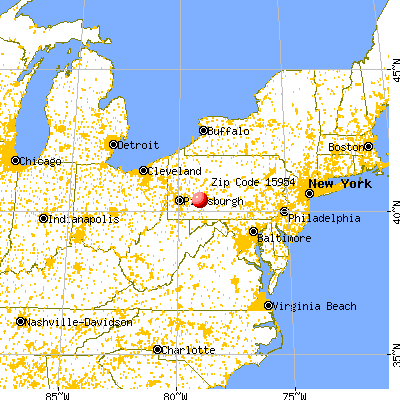
Land area: 18.1 sq. mi. Water area: 0.2 sq. mi.
Population density: 133 people per square mile
(very low).
OSM Map
General Map
Google Map
MSN Map
OSM Map
General Map
Google Map
MSN Map
OSM Map
General Map
Google Map
MSN Map
OSM Map
General Map
Google Map
MSN Map
Please wait while loading the map...
Real estate property taxes paid for housing units in 2022:
This zip code:
1.8% ($1,517)
Pennsylvania:
1.3% ($3,094)
Median real estate property taxes paid for housing units with mortgages in 2022: $2,365 (1.7%) Median real estate property taxes paid for housing units with no mortgage in 2022: $1,367 (1.9%)
Averages for the 2020 tax year for zip code 15954, filed in 2021:
Average Adjusted Gross Income (AGI) in 2020: $47,970 (Individual Income Tax Returns)
Here:
$47,970
State:
$75,707
Salary/wage: $43,685 (reported on 75.5% of returns)
Here:
$43,685
State:
$62,806
(% of AGI for various income ranges: 907.0% for AGIs below $25k, 3067.5% for AGIs $25k-50k, 5728.2% for AGIs $50k-75k, 8394.3% for AGIs $75k-100k, 16522.9% for AGIs $100k-200k)
Taxable interest for individuals: $736 (reported on 28.6% of returns)
This zip code:
$736
Pennsylvania:
$1,633
(% of AGI for various income ranges: 17.0% for AGIs below $25k, 43.0% for AGIs $25k-50k, 35.5% for AGIs $50k-75k, 8.6% for AGIs $75k-100k, 41.4% for AGIs $100k-200k)
Ordinary dividends: $879 (reported on 14.3% of returns)
Here:
$879
State:
$7,382
(% of AGI for various income ranges: 10.7% for AGIs below $25k, 15.5% for AGIs $25k-50k, 17.3% for AGIs $50k-75k, 62.9% for AGIs $100k-200k)
Net capital gain/loss in AGI: +$4,112 (reported on 8.2% of returns)
Here:
+$4,112
State:
+$23,522
(% of AGI for various income ranges: 13.5% for AGIs $25k-50k, 20.0% for AGIs $50k-75k, 408.6% for AGIs $100k-200k)
Profit/loss from business: +$4,100 (reported on 8.2% of returns)
Here:
+$4,100
State:
+$16,274
(% of AGI for various income ranges: 50.7% for AGIs below $25k, 40.5% for AGIs $25k-50k, 157.1% for AGIs $75k-100k)
Taxable individual retirement arrangement distribution: $8,985 (reported on 13.3% of returns)
15954:
$8,985
Pennsylvania:
$18,583
(% of AGI for various income ranges: 68.9% for AGIs below $25k, 263.0% for AGIs $25k-50k, 651.4% for AGIs $75k-100k)
Earned income credit: $2,257 (reported on 14.3% of returns)
Here:
$2,257
State:
$2,100
(% of AGI for various income ranges: 77.4% for AGIs below $25k, 53.5% for AGIs $25k-50k)
Percentage of individuals using paid preparers for their 2020 taxes: 92.9%
Here:
93%
State:
92%
(% for various income ranges: 84.6% for AGIs below $25k, 96.0% for AGIs $25k-50k, 100.0% for AGIs $50k-75k, 100.0% for AGIs $75k-100k, 100.0% for AGIs $100k-200k)
Averages for the 2012 tax year for zip code 15954, filed in 2013:
Average Adjusted Gross Income (AGI) in 2012: $38,996 (Individual Income Tax Returns)
Here:
$38,996
State:
$61,346
Salary/wage: $37,482 (reported on 79.2% of returns)
Here:
$37,482
State:
$51,902
(% of AGI for various income ranges: 63.9% for AGIs below $25k, 76.0% for AGIs $25k-50k, 82.3% for AGIs $50k-75k, 81.1% for AGIs $75k-100k, 71.3% for AGIs $100k-200k)
Taxable interest for individuals: $608 (reported on 35.6% of returns)
This zip code:
$608
Pennsylvania:
$1,588
(% of AGI for various income ranges: 2.2% for AGIs below $25k, 0.4% for AGIs $25k-50k, 0.4% for AGIs $50k-75k, 0.2% for AGIs $75k-100k, 0.4% for AGIs $100k-200k)
Ordinary dividends: $556 (reported on 15.8% of returns)
Here:
$556
State:
$5,827
(% of AGI for various income ranges: 0.7% for AGIs below $25k, 0.1% for AGIs $25k-50k, 0.3% for AGIs $100k-200k)
Net capital gain/loss in AGI: +$100 (reported on 5.9% of returns)
Here:
+$100
State:
+$14,495
Profit/loss from business: +$7,340 (reported on 9.9% of returns)
Here:
+$7,340
State:
+$16,268
(% of AGI for various income ranges: 3.9% for AGIs below $25k, 1.9% for AGIs $25k-50k, 4.8% for AGIs $75k-100k)
Taxable individual retirement arrangement distribution: $5,256 (reported on 8.9% of returns)
15954:
$5,256
Pennsylvania:
$14,550
(% of AGI for various income ranges: 2.8% for AGIs below $25k, 2.0% for AGIs $25k-50k, 1.8% for AGIs $50k-75k)
Total itemized deductions: $15,377 (19% of AGI, reported on 12.9% of returns)
Here:
$15,377
State:
$23,538
Here:
18.8% of AGI
State:
18.4% of AGI
(% of AGI for various income ranges: 7.2% for AGIs below $25k, 4.8% for AGIs $50k-75k, 5.9% for AGIs $75k-100k, 8.3% for AGIs $100k-200k)
Charity contributions: $2,844 (reported on 8.9% of returns)
Here:
$2,844
State:
$4,025
Taxes paid: $5,638 (reported on 12.9% of returns)
15954:
$5,638
State:
$9,982
(% of AGI for various income ranges: 2.0% for AGIs below $25k, 1.6% for AGIs $50k-75k, 2.1% for AGIs $75k-100k, 3.7% for AGIs $100k-200k)
Earned income credit: $1,933 (reported on 17.8% of returns)
Here:
$1,933
State:
$2,106
(% of AGI for various income ranges: 5.5% for AGIs below $25k, 1.0% for AGIs $25k-50k)
Percentage of individuals using paid preparers for their 2012 taxes: 53.5%
Here:
53%
State:
53%
(% for various income ranges: 46.7% for AGIs below $25k, 56.5% for AGIs $25k-50k, 56.2% for AGIs $50k-75k, 60.0% for AGIs $75k-100k, 71.4% for AGIs $100k-200k)
Averages for the 2004 tax year for zip code 15954, filed in 2005:
Average Adjusted Gross Income (AGI) in 2004: $32,778 (Individual Income Tax Returns)
Here:
$32,778
State:
$48,049
Salary/wage: $31,576 (reported on 83.4% of returns)
Here:
$31,576
State:
$42,646
(% of AGI for various income ranges: 68.1% for AGIs below $10k, 67.0% for AGIs $10k-25k, 83.2% for AGIs $25k-50k, 87.0% for AGIs $50k-75k, 76.7% for AGIs $75k-100k, 81.0% for AGIs over 100k)
Taxable interest for individuals: $1,195 (reported on 43.9% of returns)
This zip code:
$1,195
Pennsylvania:
$1,657
(% of AGI for various income ranges: 5.4% for AGIs below $10k, 3.4% for AGIs $10k-25k, 1.1% for AGIs $25k-50k, 1.4% for AGIs $50k-75k, 1.0% for AGIs $75k-100k, 0.6% for AGIs over 100k)
Taxable dividends: $600 (reported on 19.6% of returns)
Here:
$600
State:
$3,566
(% of AGI for various income ranges: 1.0% for AGIs below $10k, 0.4% for AGIs $10k-25k, 0.4% for AGIs $25k-50k, 0.3% for AGIs $50k-75k, 0.3% for AGIs $75k-100k, 0.3% for AGIs over 100k)
Net capital gain/loss: +$794 (reported on 10.7% of returns)
Here:
+$794
State:
+$9,716
(% of AGI for various income ranges: 0.2% for AGIs $10k-25k, 0.2% for AGIs $25k-50k, 0.2% for AGIs $50k-75k, 0.1% for AGIs $75k-100k, 0.8% for AGIs over 100k)
Profit/loss from business: +$4,883 (reported on 9.4% of returns)
Here:
+$4,883
State:
+$14,267
(% of AGI for various income ranges: 2.0% for AGIs below $10k, 2.1% for AGIs $10k-25k, 1.9% for AGIs $25k-50k, 1.6% for AGIs $50k-75k)
IRA payment deduction: $2,111 (reported on 1.8% of returns)
15954:
$2,111
Pennsylvania:
$2,903
Total itemized deductions: $13,762 (22% of AGI, reported on 15.2% of returns)
Here:
$13,762
State:
$18,804
Here:
22.4% of AGI
State:
19.5% of AGI
(% of AGI for various income ranges: 4.0% for AGIs $10k-25k, 5.9% for AGIs $25k-50k, 7.0% for AGIs $50k-75k, 8.1% for AGIs $75k-100k, 9.0% for AGIs over 100k)
Charity contributions deductions: $2,815 (4% of AGI, reported on 11.9% of returns)
Here:
$2,815
State:
$3,337
Here:
4.3% of AGI
State:
3.3% of AGI
(% of AGI for various income ranges: 0.6% for AGIs $10k-25k, 0.7% for AGIs $25k-50k, 1.1% for AGIs $50k-75k, 1.4% for AGIs $75k-100k, 2.1% for AGIs over 100k)
Total tax: $3,675 (reported on 69.6% of returns)
15954:
$3,675
State:
$8,008
(% of AGI for various income ranges: 1.3% for AGIs below $10k, 3.3% for AGIs $10k-25k, 6.0% for AGIs $25k-50k, 8.7% for AGIs $50k-75k, 10.5% for AGIs $75k-100k, 15.2% for AGIs over 100k)
Earned income credit: $1,665 (reported on 16.5% of returns)
Here:
$1,665
State:
$1,643
Percentage of individuals using paid preparers for their 2004 taxes: 58.6%
Here:
59%
State:
56%
(% for various income ranges: 54.3% for AGIs below $10k, 62.8% for AGIs $10k-25k, 59.2% for AGIs $25k-50k, 56.4% for AGIs $50k-75k, 56.0% for AGIs $75k-100k, 63.0% for AGIs over 100k)
Household received Food Stamps/SNAP in the past 12 months: 195 Household did not receive Food Stamps/SNAP in the past 12 months: 1,021
Women who had a birth in the past 12 months: 6 (2 now married, 3 unmarried) Women who did not have a birth in the past 12 months: 319 (150 now married, 168 unmarried)
Housing units in zip code 15954 with a mortgage: 278 (28 second mortgage, 28 both second mortgage and home equity loan) Houses without a mortgage: 68
Median monthly owner costs for units with a mortgage: $1,108 Median monthly owner costs for units without a mortgage: $483
Residents with income below the poverty level in 2022:
This zip code:
17.2%
Whole state:
11.8%
Residents with income below 50% of the poverty level in 2022:
This zip code:
5.2%
Whole state:
6.1%
Median number of rooms in houses and condos:
Here:
6.0
State:
6.8
Median number of rooms in apartments:
Here:
4.3
State:
4.3
Notable locations in this zip code not listed on our city pages
Notable locations in zip code 15954: Verona (A), Gas Center (B), Conemaugh Furnace (C), Seward Volunteer Fire Department (D). Display/hide their locations on the map
In group quarters: 1 (-1 institutionalized population)
Size of family households: 496 2-persons, 143 3-persons, 78 4-persons, 38 5-persons, 3 7-or-more-persons
Size of nonfamily households: 448 1-person, 7 2-persons
195 married couples with children.
137 single-parent households (21 men, 116 women).
98.9% of residents of 15954 zip code speak English at home.
0.2% of residents speak Spanish at home (100% very well).
0.2% of residents speak other Indo-European language at home (100% very well).
0.5% of residents speak Asian or Pacific Island language at home (100% very well).
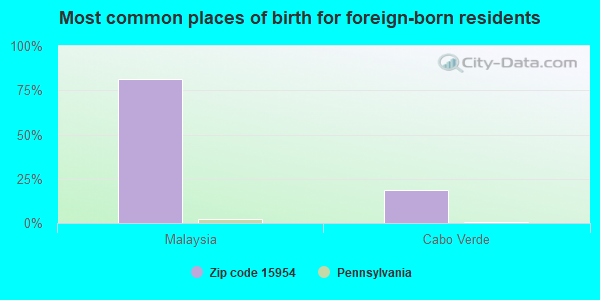
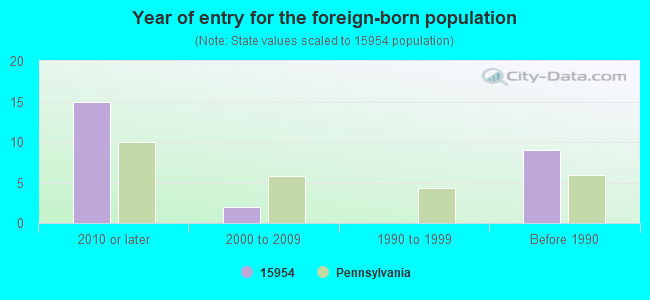
Foreign born population: 16 (0.7%) (19.4% of them are naturalized citizens)
This zip code:
0.7%
Whole state:
7.5%
81%Malaysia
19%Cabo Verde
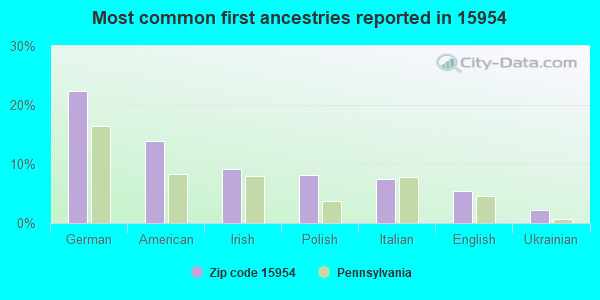
22%German
14%American
9%Irish
8%Polish
7%Italian
5%English
2%Ukrainian
Year of entry for the foreign-born population
152010 or later
22000 to 2009
01990 to 1999
9Before 1990
Housing units lacking complete plumbing facilities: 0.7% Housing units lacking complete kitchen facilities: 1.1%
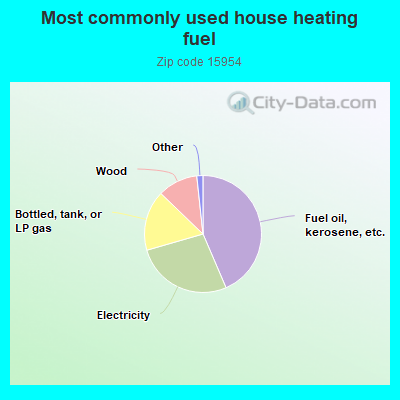
43.6%Fuel oil, kerosene, etc.
27.0%Electricity
16.7%Bottled, tank, or LP gas
11.1%Wood
0.8%Coal or coke
0.8%Other fuel
Population in 1990: 1,348. Population change in the 1990s: +1,416 (+105.0%).
Place of birth for U.S.-born residents:
This state: 2,172
Northeast: 54
Midwest: 32
South: 70
West: 29
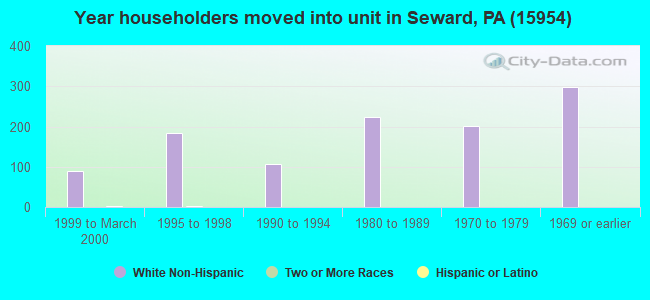
74% of the 15954 zip code residents lived in the same house 5 years ago. Out of people who lived in different houses, 61% lived in this county. Out of people who lived in different counties, 50% lived in Pennsylvania.
95% of the 15954 zip code residents lived in the same house 1 year ago. Out of people who lived in different houses, 34% moved from this county. Out of people who lived in different houses, 68% moved from different county within same state.
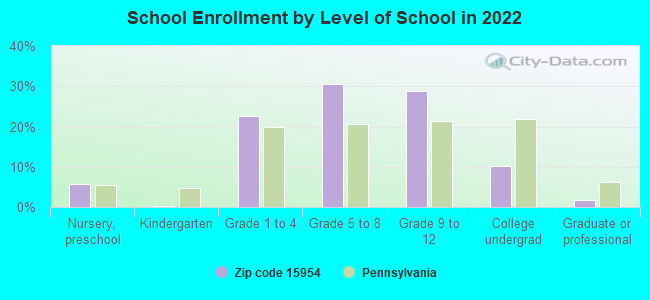
Private vs. public school enrollment:
Students in private schools in grades 1 to 8 (elementary and middle school): 24
Here:
13.7%
Pennsylvania:
15.7%
Students in private schools in grades 9 to 12 (high school):
Here:
0.0%
Pennsylvania:
13.4%
Students in private undergraduate colleges: 8
Here:
23.2%
Pennsylvania:
39.8%
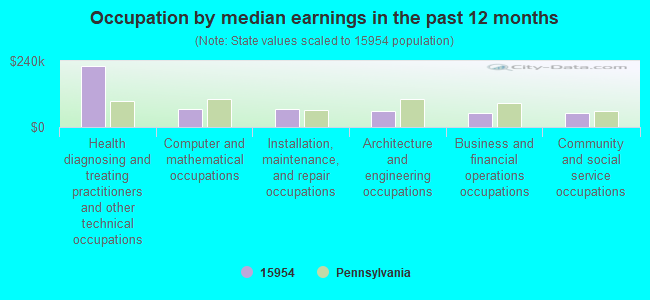
Occupation by median earnings in the past 12 months ($)
221,973Health diagnosing and treating practitioners and other technical occupations
66,295Computer and mathematical occupations
64,590Installation, maintenance, and repair occupations
56,574Architecture and engineering occupations
51,079Business and financial operations occupations
50,202Community and social service occupations
Companies with federal contracts located in this zip code:
J M G ENTERPRISES INC (10027 RT 403 HWY SOUTH in SEWARD, PA; small business) : $29,550 in 2 contractsfrom 2002 to 2003
$17,550 with Army for Chemicals. Signed on 2002-12-16. Completion date: 2003-12-16.
$12,000, same as above.Signed on 2003-10-22. Completion date: 2004-08-31.
Top industries in this zip code by the number of employees in 2005:
Real Estate and Rental and Leasing: Other Commercial and Industrial Machinery and Equipment Rental and Leasing (100-249 employees: 1 establishment)
Health Care and Social Assistance: Offices of Physicians (except Mental Health Specialists) (5-9: 2, 1-4: 1)
Administrative and Support and Waste Management and Remediation Services: Other Services to Buildings and Dwellings (10-19: 1)
Other Services (except Public Administration): Religious Organizations (5-9: 1, 1-4: 2)
People in group quarters in 2000:
15 people in other noninstitutional group quarters
Fatal accident statistics in 2011:
Fatal accident count: 2
Vehicles involved in fatal accidents: 4
Fatal accidents caused by drunken drivers: 1
Fatalities: 2
Persons involved in fatal accidents: 5
Pedestrians involved in fatal accidents: 0
Fatal accident statistics in 2010:
Fatal accident count: 1
Vehicles involved in fatal accidents: 1
Fatal accidents caused by drunken drivers: 0
Fatalities: 1
Persons involved in fatal accidents: 1
Pedestrians involved in fatal accidents: 0
Home Mortgage Disclosure Act Aggregated Statistics For Year 2009 (Based on 2 partial tracts)
A) FHA, FSA/RHS & VA Home Purchase Loans
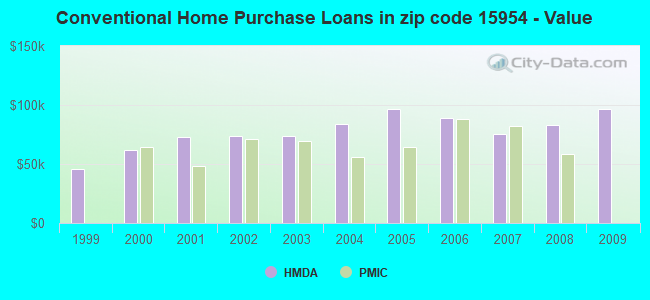
B) Conventional Home Purchase Loans
C) Refinancings
D) Home Improvement Loans
F) Non-occupant Loans on < 5 Family Dwellings (A B C & D)
G) Loans On Manufactured Home Dwelling (A B C & D)
Number
Average Value
Number
Average Value
Number
Average Value
Number
Average Value
Number
Average Value
Number
Average Value
LOANS ORIGINATED
3
$112,717
4
$96,238
17
$120,102
5
$32,154
2
$157,375
2
$50,695
APPLICATIONS APPROVED, NOT ACCEPTED
1
$59,380
0
$0
2
$98,500
1
$62,900
0
$0
0
$0
APPLICATIONS DENIED
1
$110,450
1
$93,090
10
$103,458
2
$29,815
0
$0
1
$63,400
APPLICATIONS WITHDRAWN
0
$0
1
$205,560
5
$142,556
0
$0
0
$0
0
$0
FILES CLOSED FOR INCOMPLETENESS
0
$0
0
$0
1
$132,840
0
$0
0
$0
0
$0
Aggregated Statistics For Year 2008 (Based on 2 partial tracts)
A) FHA, FSA/RHS & VA Home Purchase Loans
B) Conventional Home Purchase Loans
C) Refinancings
D) Home Improvement Loans
F) Non-occupant Loans on < 5 Family Dwellings (A B C & D)
G) Loans On Manufactured Home Dwelling (A B C & D)
Number
Average Value
Number
Average Value
Number
Average Value
Number
Average Value
Number
Average Value
Number
Average Value
LOANS ORIGINATED
3
$85,210
6
$83,238
9
$69,246
7
$27,640
1
$43,020
1
$81,770
APPLICATIONS APPROVED, NOT ACCEPTED
0
$0
2
$73,595
2
$85,290
1
$22,640
1
$25,660
0
$0
APPLICATIONS DENIED
0
$0
4
$74,472
14
$82,830
6
$49,943
0
$0
2
$53,715
APPLICATIONS WITHDRAWN
1
$54,090
1
$45,290
5
$89,116
1
$63,150
0
$0
1
$61,890
FILES CLOSED FOR INCOMPLETENESS
0
$0
0
$0
2
$79,630
0
$0
0
$0
0
$0
Aggregated Statistics For Year 2007 (Based on 2 partial tracts)
A) FHA, FSA/RHS & VA Home Purchase Loans
B) Conventional Home Purchase Loans
C) Refinancings
D) Home Improvement Loans
F) Non-occupant Loans on < 5 Family Dwellings (A B C & D)
G) Loans On Manufactured Home Dwelling (A B C & D)
Number
Average Value
Number
Average Value
Number
Average Value
Number
Average Value
Number
Average Value
Number
Average Value
LOANS ORIGINATED
2
$56,860
9
$75,592
16
$100,310
7
$20,596
2
$37,110
2
$32,960
APPLICATIONS APPROVED, NOT ACCEPTED
0
$0
2
$57,115
3
$67,680
1
$37,240
1
$17,110
0
$0
APPLICATIONS DENIED
1
$55,100
3
$42,270
29
$108,604
8
$38,211
2
$238,015
4
$56,925
APPLICATIONS WITHDRAWN
1
$84,790
2
$54,975
5
$100,188
1
$8,300
1
$51,580
0
$0
FILES CLOSED FOR INCOMPLETENESS
0
$0
0
$0
3
$113,973
0
$0
0
$0
0
$0
Aggregated Statistics For Year 2006 (Based on 2 partial tracts)
A) FHA, FSA/RHS & VA Home Purchase Loans
B) Conventional Home Purchase Loans
C) Refinancings
D) Home Improvement Loans
F) Non-occupant Loans on < 5 Family Dwellings (A B C & D)
G) Loans On Manufactured Home Dwelling (A B C & D)
Number
Average Value
Number
Average Value
Number
Average Value
Number
Average Value
Number
Average Value
Number
Average Value
LOANS ORIGINATED
3
$99,213
11
$88,906
20
$75,468
11
$23,811
1
$141,150
2
$55,980
APPLICATIONS APPROVED, NOT ACCEPTED
1
$46,290
2
$98,755
2
$64,285
2
$15,220
1
$91,830
1
$41,510
APPLICATIONS DENIED
0
$0
6
$66,297
25
$98,899
7
$20,091
1
$13,840
2
$42,645
APPLICATIONS WITHDRAWN
0
$0
2
$72,460
5
$138,380
0
$0
0
$0
0
$0
FILES CLOSED FOR INCOMPLETENESS
0
$0
0
$0
2
$53,090
0
$0
0
$0
0
$0
Aggregated Statistics For Year 2005 (Based on 2 partial tracts)
A) FHA, FSA/RHS & VA Home Purchase Loans
B) Conventional Home Purchase Loans
C) Refinancings
D) Home Improvement Loans
F) Non-occupant Loans on < 5 Family Dwellings (A B C & D)
G) Loans On Manufactured Home Dwelling (A B C & D)
Number
Average Value
Number
Average Value
Number
Average Value
Number
Average Value
Number
Average Value
Number
Average Value
LOANS ORIGINATED
2
$82,900
12
$96,258
21
$73,455
7
$22,393
2
$11,070
1
$32,200
APPLICATIONS APPROVED, NOT ACCEPTED
0
$0
2
$38,745
3
$76,823
1
$29,940
0
$0
1
$43,280
APPLICATIONS DENIED
0
$0
4
$58,370
27
$97,705
8
$24,311
0
$0
3
$54,010
APPLICATIONS WITHDRAWN
0
$0
2
$118,000
10
$113,673
2
$78,625
1
$277,510
1
$58,870
FILES CLOSED FOR INCOMPLETENESS
0
$0
1
$74,220
2
$122,905
0
$0
0
$0
0
$0
Aggregated Statistics For Year 2004 (Based on 2 partial tracts)
A) FHA, FSA/RHS & VA Home Purchase Loans
B) Conventional Home Purchase Loans
C) Refinancings
D) Home Improvement Loans
F) Non-occupant Loans on < 5 Family Dwellings (A B C & D)
G) Loans On Manufactured Home Dwelling (A B C & D)
Number
Average Value
Number
Average Value
Number
Average Value
Number
Average Value
Number
Average Value
Number
Average Value
LOANS ORIGINATED
2
$54,850
11
$83,508
22
$69,156
10
$18,644
3
$65,247
3
$36,567
APPLICATIONS APPROVED, NOT ACCEPTED
0
$0
1
$33,970
8
$64,315
2
$23,400
1
$15,600
1
$73,470
APPLICATIONS DENIED
0
$0
3
$78,330
18
$86,522
6
$17,528
1
$6,040
2
$23,525
APPLICATIONS WITHDRAWN
0
$0
2
$69,565
12
$83,132
1
$51,330
1
$39,500
1
$37,740
FILES CLOSED FOR INCOMPLETENESS
0
$0
1
$96,870
5
$71,102
0
$0
0
$0
0
$0
Aggregated Statistics For Year 2003 (Based on 2 partial tracts)
A) FHA, FSA/RHS & VA Home Purchase Loans
B) Conventional Home Purchase Loans
C) Refinancings
D) Home Improvement Loans
F) Non-occupant Loans on < 5 Family Dwellings (A B C & D)
Number
Average Value
Number
Average Value
Number
Average Value
Number
Average Value
Number
Average Value
LOANS ORIGINATED
1
$93,340
11
$74,107
35
$67,328
11
$18,435
2
$22,770
APPLICATIONS APPROVED, NOT ACCEPTED
0
$0
2
$30,820
6
$76,360
1
$24,150
1
$19,120
APPLICATIONS DENIED
0
$0
4
$60,635
20
$85,230
5
$22,996
0
$0
APPLICATIONS WITHDRAWN
0
$0
2
$94,225
8
$65,385
1
$44,280
0
$0
FILES CLOSED FOR INCOMPLETENESS
0
$0
0
$0
2
$88,690
0
$0
0
$0
Aggregated Statistics For Year 2002 (Based on 2 partial tracts)
A) FHA, FSA/RHS & VA Home Purchase Loans
B) Conventional Home Purchase Loans
C) Refinancings
D) Home Improvement Loans
F) Non-occupant Loans on < 5 Family Dwellings (A B C & D)
Number
Average Value
Number
Average Value
Number
Average Value
Number
Average Value
Number
Average Value
LOANS ORIGINATED
1
$90,320
10
$74,046
20
$69,442
9
$22,951
2
$55,605
APPLICATIONS APPROVED, NOT ACCEPTED
0
$0
2
$45,290
5
$52,434
2
$16,230
0
$0
APPLICATIONS DENIED
1
$29,440
4
$1,618,040
14
$81,321
6
$19,667
0
$0
APPLICATIONS WITHDRAWN
0
$0
1
$125,550
8
$73,561
1
$20,130
0
$0
FILES CLOSED FOR INCOMPLETENESS
0
$0
0
$0
3
$76,907
0
$0
0
$0
Aggregated Statistics For Year 2001 (Based on 2 partial tracts)
A) FHA, FSA/RHS & VA Home Purchase Loans
B) Conventional Home Purchase Loans
C) Refinancings
D) Home Improvement Loans
F) Non-occupant Loans on < 5 Family Dwellings (A B C & D)
Number
Average Value
Number
Average Value
Number
Average Value
Number
Average Value
Number
Average Value
LOANS ORIGINATED
3
$42,017
9
$72,629
24
$69,242
11
$18,458
2
$77,115
APPLICATIONS APPROVED, NOT ACCEPTED
0
$0
1
$43,020
7
$70,591
1
$23,150
0
$0
APPLICATIONS DENIED
0
$0
5
$55,302
18
$65,584
5
$11,976
0
$0
APPLICATIONS WITHDRAWN
0
$0
1
$45,790
8
$72,084
1
$23,900
0
$0
FILES CLOSED FOR INCOMPLETENESS
0
$0
0
$0
1
$52,840
0
$0
1
$25,410
Aggregated Statistics For Year 2000 (Based on 2 partial tracts)
A) FHA, FSA/RHS & VA Home Purchase Loans
B) Conventional Home Purchase Loans
C) Refinancings
D) Home Improvement Loans
F) Non-occupant Loans on < 5 Family Dwellings (A B C & D)
Number
Average Value
Number
Average Value
Number
Average Value
Number
Average Value
Number
Average Value
LOANS ORIGINATED
2
$41,010
9
$61,810
13
$51,598
9
$14,900
2
$36,610
APPLICATIONS APPROVED, NOT ACCEPTED
0
$0
2
$49,440
4
$48,432
2
$30,945
0
$0
APPLICATIONS DENIED
1
$32,710
3
$47,803
13
$49,914
7
$24,190
1
$15,350
APPLICATIONS WITHDRAWN
0
$0
2
$62,525
4
$54,282
1
$24,660
0
$0
FILES CLOSED FOR INCOMPLETENESS
0
$0
0
$0
2
$34,970
0
$0
0
$0
Aggregated Statistics For Year 1999 (Based on 1 partial tract)
A) FHA, FSA/RHS & VA Home Purchase Loans
B) Conventional Home Purchase Loans
C) Refinancings
D) Home Improvement Loans
F) Non-occupant Loans on < 5 Family Dwellings (A B C & D)


 Nearest zip codes: 15929, 15906, 15920, 15961, 15944, 15949.


 : $29,550 in 2 contracts from 2002 to 2003