Estimated zip code population in 2022: 2,466 Zip code population in 2010: 2,676 Zip code population in 2000: 2,812
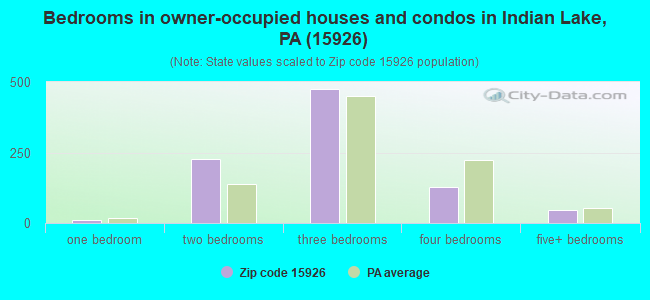
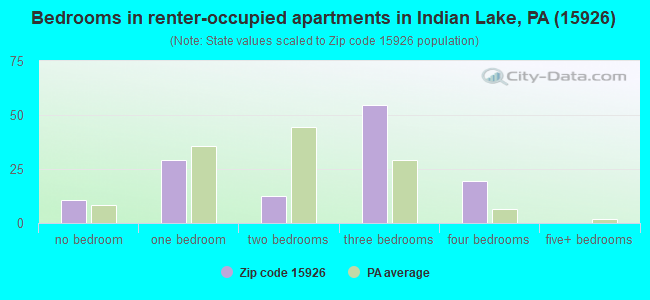
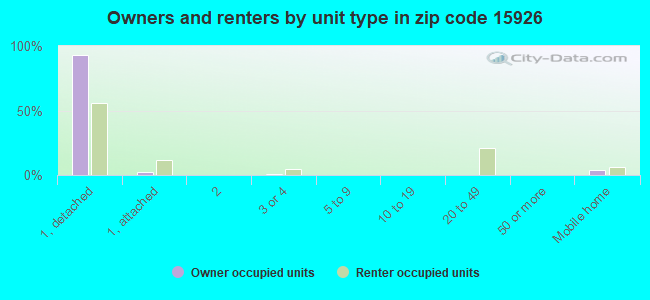
Houses and condos: 1,539 Renter-occupied apartments: 127
% of renters here:
13%
State:
31%
March 2022 cost of living index in zip code 15926: 90.6 (less than average, U.S. average is 100)
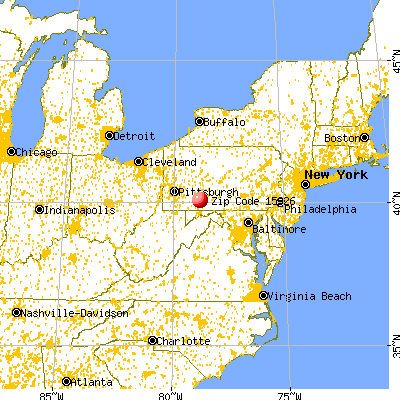
Land area: 28.1 sq. mi. Water area: 0.8 sq. mi.
Population density: 88 people per square mile
(very low).
OSM Map
General Map
Google Map
MSN Map
OSM Map
General Map
Google Map
MSN Map
OSM Map
General Map
Google Map
MSN Map
OSM Map
General Map
Google Map
MSN Map
Please wait while loading the map...
Real estate property taxes paid for housing units in 2022:
This zip code:
1.2% ($1,273)
Pennsylvania:
1.3% ($3,094)
Median real estate property taxes paid for housing units with mortgages in 2022: $1,343 (1.3%) Median real estate property taxes paid for housing units with no mortgage in 2022: $1,211 (1.2%)
Business Search- 14 Million verified businesses
Males: 1,381
(56.0%)
Females: 1,084
(44.0%)
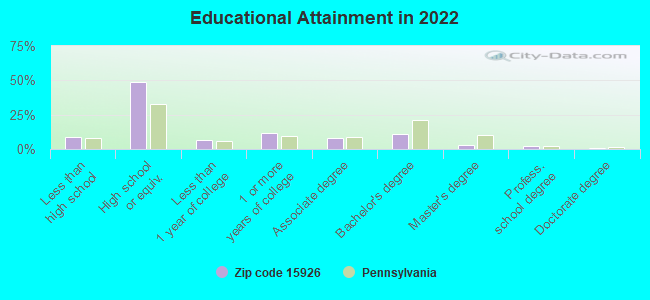
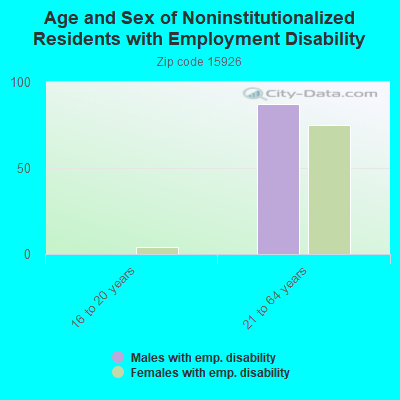
For population 25 years and over in 15926:
High school or higher: 90.1%
Bachelor's degree or higher: 15.8%
Graduate or professional degree: 5.3%
Unemployed: 3.3%
Mean travel time to work (commute): 36.8 minutes
For population 15 years and over in 15926:
Never married: 30.1%
Now married: 56.8%
Separated: 0.6%
Widowed: 6.1%
Divorced: 6.4%
Zip code 15926 compared to state average:
Median house value significantly below state average.
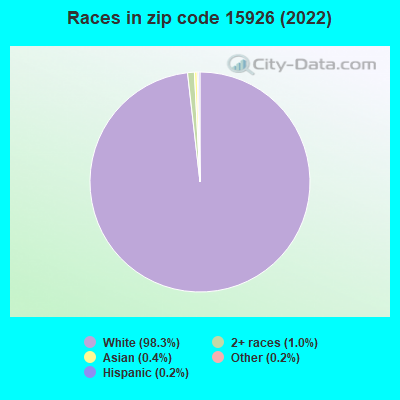
Black race population percentage significantly below state average.
Hispanic race population percentage significantly below state average.
Median age above state average.
Foreign-born population percentage significantly below state average.
Renting percentage significantly below state average.
Length of stay since moving in significantly above state average.
Number of college students below state average.
Percentage of population with a bachelor's degree or higher below state average.
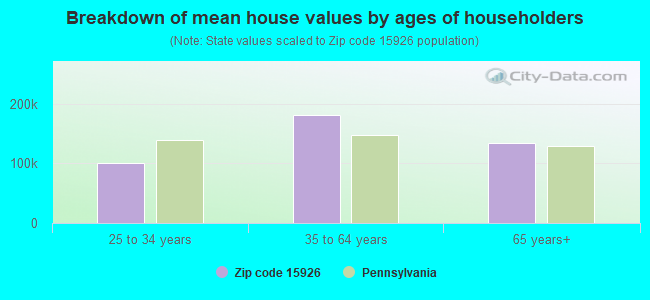
Estimated median house/condo value in 2022: $102,563
15926:
$102,563
Pennsylvania:
$245,500
According to our research of Pennsylvania and other state lists, there were 4 registered sex offenders living in 15926 zip code as of May 28, 2024. The ratio of all residents to sex offenders in zip code 15926 is 627 to 1. The ratio of registered sex offenders to all residents in this zip code is near the state average.
Median resident age:
This zip code:
46.6 years
Pennsylvania median age:
40.9 years
Average household size:
This zip code:
2.4 people
Pennsylvania:
2.4 people
Averages for the 2020 tax year for zip code 15926, filed in 2021:
Average Adjusted Gross Income (AGI) in 2020: $63,695 (Individual Income Tax Returns)
Here:
$63,695
State:
$75,707
Salary/wage: $54,632 (reported on 77.8% of returns)
Here:
$54,632
State:
$62,806
(% of AGI for various income ranges: 1106.0% for AGIs below $25k, 3268.8% for AGIs $25k-50k, 5576.4% for AGIs $50k-75k, 8286.2% for AGIs $75k-100k, 12426.4% for AGIs $100k-200k)
Taxable interest for individuals: $912 (reported on 34.2% of returns)
This zip code:
$912
Pennsylvania:
$1,633
(% of AGI for various income ranges: 28.4% for AGIs below $25k, 32.1% for AGIs $25k-50k, 17.1% for AGIs $50k-75k, 60.0% for AGIs $75k-100k, 48.2% for AGIs $100k-200k)
Ordinary dividends: $4,308 (reported on 20.5% of returns)
Here:
$4,308
State:
$7,382
(% of AGI for various income ranges: 47.6% for AGIs below $25k, 46.7% for AGIs $25k-50k, 25.7% for AGIs $50k-75k, 136.2% for AGIs $75k-100k, 312.7% for AGIs $100k-200k)
Net capital gain/loss in AGI: +$12,020 (reported on 12.8% of returns)
Here:
+$12,020
State:
+$23,522
(% of AGI for various income ranges: 3.2% for AGIs below $25k, 46.2% for AGIs $25k-50k, 177.9% for AGIs $50k-75k, 445.5% for AGIs $100k-200k)
Profit/loss from business: +$7,340 (reported on 8.5% of returns)
Here:
+$7,340
State:
+$16,274
(% of AGI for various income ranges: 59.6% for AGIs below $25k, 75.8% for AGIs $25k-50k, 115.7% for AGIs $50k-75k, 219.1% for AGIs $100k-200k)
Taxable individual retirement arrangement distribution: $13,675 (reported on 13.7% of returns)
15926:
$13,675
Pennsylvania:
$18,583
(% of AGI for various income ranges: 120.8% for AGIs below $25k, 158.8% for AGIs $25k-50k, 407.9% for AGIs $50k-75k, 849.1% for AGIs $100k-200k)
Total itemized deductions: $34,333 (reported on 2.6% of returns)
Here:
$34,333
State:
$34,850
(% of AGI for various income ranges: 936.4% for AGIs $100k-200k)
Charity contributions: $10,400 (reported on 2.6% of returns)
Here:
$10,400
State:
$12,392
(% of AGI for various income ranges: 283.6% for AGIs $100k-200k)
Taxes paid: $10,000 (reported on 2.6% of returns)
15926:
$10,000
State:
$8,200
(% of AGI for various income ranges: 272.7% for AGIs $100k-200k)
Earned income credit: $2,029 (reported on 12.0% of returns)
Here:
$2,029
State:
$2,100
(% of AGI for various income ranges: 64.0% for AGIs below $25k, 51.7% for AGIs $25k-50k)
Percentage of individuals using paid preparers for their 2020 taxes: 88.9%
Here:
89%
State:
92%
(% for various income ranges: 84.2% for AGIs below $25k, 90.3% for AGIs $25k-50k, 88.9% for AGIs $50k-75k, 90.9% for AGIs $75k-100k, 92.9% for AGIs $100k-200k, 100.0% for AGIs over 200k)
Averages for the 2012 tax year for zip code 15926, filed in 2013:
Average Adjusted Gross Income (AGI) in 2012: $44,756 (Individual Income Tax Returns)
Here:
$44,756
State:
$61,346
Salary/wage: $39,485 (reported on 81.5% of returns)
Here:
$39,485
State:
$51,902
(% of AGI for various income ranges: 67.6% for AGIs below $25k, 73.4% for AGIs $25k-50k, 79.3% for AGIs $50k-75k, 75.7% for AGIs $75k-100k, 62.8% for AGIs $100k-200k)
Taxable interest for individuals: $958 (reported on 38.7% of returns)
This zip code:
$958
Pennsylvania:
$1,588
(% of AGI for various income ranges: 2.4% for AGIs below $25k, 1.2% for AGIs $25k-50k, 0.6% for AGIs $50k-75k, 0.4% for AGIs $75k-100k, 0.5% for AGIs $100k-200k)
Ordinary dividends: $2,454 (reported on 21.0% of returns)
Here:
$2,454
State:
$5,827
(% of AGI for various income ranges: 1.1% for AGIs below $25k, 1.3% for AGIs $25k-50k, 0.5% for AGIs $50k-75k, 1.5% for AGIs $75k-100k, 1.5% for AGIs $100k-200k)
Net capital gain/loss in AGI: +$1,177 (reported on 10.5% of returns)
Here:
+$1,177
State:
+$14,495
(% of AGI for various income ranges: 0.3% for AGIs $50k-75k, 0.8% for AGIs $100k-200k)
Profit/loss from business: +$8,850 (reported on 12.9% of returns)
Here:
+$8,850
State:
+$16,268
(% of AGI for various income ranges: 5.2% for AGIs below $25k, 2.4% for AGIs $25k-50k, 1.2% for AGIs $50k-75k, 6.9% for AGIs $75k-100k)
Taxable individual retirement arrangement distribution: $9,807 (reported on 12.1% of returns)
15926:
$9,807
Pennsylvania:
$14,550
(% of AGI for various income ranges: 3.6% for AGIs below $25k, 2.7% for AGIs $25k-50k, 1.8% for AGIs $50k-75k, 7.2% for AGIs $75k-100k)
Total itemized deductions: $19,314 (22% of AGI, reported on 17.7% of returns)
Here:
$19,314
State:
$23,538
Here:
21.9% of AGI
State:
18.4% of AGI
(% of AGI for various income ranges: 4.8% for AGIs below $25k, 6.4% for AGIs $25k-50k, 5.8% for AGIs $50k-75k, 7.0% for AGIs $75k-100k, 12.0% for AGIs $100k-200k)
Charity contributions: $3,900 (reported on 12.1% of returns)
Here:
$3,900
State:
$4,025
(% of AGI for various income ranges: 0.8% for AGIs $25k-50k, 0.6% for AGIs $50k-75k, 1.0% for AGIs $75k-100k, 2.2% for AGIs $100k-200k)
Taxes paid: $6,432 (reported on 17.7% of returns)
15926:
$6,432
State:
$9,982
(% of AGI for various income ranges: 1.0% for AGIs below $25k, 1.5% for AGIs $25k-50k, 1.7% for AGIs $50k-75k, 2.5% for AGIs $75k-100k, 4.8% for AGIs $100k-200k)
Earned income credit: $1,765 (reported on 16.1% of returns)
Here:
$1,765
State:
$2,106
(% of AGI for various income ranges: 4.1% for AGIs below $25k, 0.9% for AGIs $25k-50k)
Percentage of individuals using paid preparers for their 2012 taxes: 46.8%
Here:
47%
State:
53%
(% for various income ranges: 38.5% for AGIs below $25k, 44.8% for AGIs $25k-50k, 56.5% for AGIs $50k-75k, 54.5% for AGIs $75k-100k, 66.7% for AGIs $100k-200k)
Averages for the 2004 tax year for zip code 15926, filed in 2005:
Average Adjusted Gross Income (AGI) in 2004: $36,915 (Individual Income Tax Returns)
Here:
$36,915
State:
$48,049
Salary/wage: $31,600 (reported on 83.9% of returns)
Here:
$31,600
State:
$42,646
(% of AGI for various income ranges: 91.5% for AGIs below $10k, 73.6% for AGIs $10k-25k, 81.9% for AGIs $25k-50k, 82.5% for AGIs $50k-75k, 64.5% for AGIs $75k-100k, 48.6% for AGIs over 100k)
Taxable interest for individuals: $1,533 (reported on 43.9% of returns)
This zip code:
$1,533
Pennsylvania:
$1,657
(% of AGI for various income ranges: 9.2% for AGIs below $10k, 3.9% for AGIs $10k-25k, 1.5% for AGIs $25k-50k, 1.6% for AGIs $50k-75k, 1.4% for AGIs $75k-100k, 0.7% for AGIs over 100k)
Taxable dividends: $1,783 (reported on 23.3% of returns)
Here:
$1,783
State:
$3,566
(% of AGI for various income ranges: 4.5% for AGIs below $10k, 1.4% for AGIs $10k-25k, 0.5% for AGIs $25k-50k, 0.5% for AGIs $50k-75k, 0.7% for AGIs $75k-100k, 2.3% for AGIs over 100k)
Net capital gain/loss: +$3,145 (reported on 13.9% of returns)
Here:
+$3,145
State:
+$9,716
(% of AGI for various income ranges: -2.0% for AGIs below $10k, -0.5% for AGIs $10k-25k, 0.7% for AGIs $25k-50k, 0.3% for AGIs $50k-75k, -0.2% for AGIs $75k-100k, 4.9% for AGIs over 100k)
Profit/loss from business: +$6,107 (reported on 14.2% of returns)
Here:
+$6,107
State:
+$14,267
(% of AGI for various income ranges: 1.8% for AGIs below $10k, 4.8% for AGIs $10k-25k, 1.7% for AGIs $25k-50k, -0.1% for AGIs $50k-75k, 10.2% for AGIs $75k-100k)
IRA payment deduction: $1,919 (reported on 3.1% of returns)
15926:
$1,919
Pennsylvania:
$2,903
Total itemized deductions: $17,442 (21% of AGI, reported on 16.6% of returns)
Here:
$17,442
State:
$18,804
Here:
21.4% of AGI
State:
19.5% of AGI
(% of AGI for various income ranges: 6.6% for AGIs $10k-25k, 5.1% for AGIs $25k-50k, 7.7% for AGIs $50k-75k, 12.7% for AGIs $75k-100k, 10.5% for AGIs over 100k)
Charity contributions deductions: $2,444 (3% of AGI, reported on 13.4% of returns)
Here:
$2,444
State:
$3,337
Here:
2.9% of AGI
State:
3.3% of AGI
(% of AGI for various income ranges: 0.4% for AGIs $10k-25k, 0.4% for AGIs $25k-50k, 0.6% for AGIs $50k-75k, 1.8% for AGIs $75k-100k, 1.8% for AGIs over 100k)
Total tax: $5,142 (reported on 72.0% of returns)
15926:
$5,142
State:
$8,008
(% of AGI for various income ranges: 2.6% for AGIs below $10k, 4.1% for AGIs $10k-25k, 6.1% for AGIs $25k-50k, 8.3% for AGIs $50k-75k, 10.8% for AGIs $75k-100k, 20.9% for AGIs over 100k)
Earned income credit: $1,439 (reported on 16.6% of returns)
Here:
$1,439
State:
$1,643
Percentage of individuals using paid preparers for their 2004 taxes: 54.3%
Here:
54%
State:
56%
(% for various income ranges: 49.4% for AGIs below $10k, 55.5% for AGIs $10k-25k, 52.2% for AGIs $25k-50k, 58.2% for AGIs $50k-75k, 54.1% for AGIs $75k-100k, 74.5% for AGIs over 100k)
Household received Food Stamps/SNAP in the past 12 months: 114 Household did not receive Food Stamps/SNAP in the past 12 months: 901
Women who had a birth in the past 12 months: 32 (19 now married, 12 unmarried) Women who did not have a birth in the past 12 months: 374 (170 now married, 202 unmarried)
Housing units in zip code 15926 with a mortgage: 454 (86 second mortgage, 66 both second mortgage and home equity loan) Houses without a mortgage: 13
Median monthly owner costs for units with a mortgage: $980 Median monthly owner costs for units without a mortgage: $468
Residents with income below the poverty level in 2022:
This zip code:
9.2%
Whole state:
11.8%
Residents with income below 50% of the poverty level in 2022:
This zip code:
5.3%
Whole state:
6.1%
Median number of rooms in houses and condos:
Here:
6.4
State:
6.8
Median number of rooms in apartments:
Here:
5.6
State:
4.3
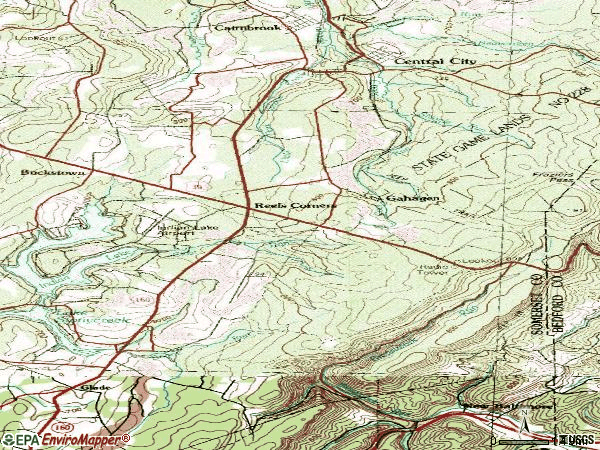
Notable locations in this zip code not listed on our city pages
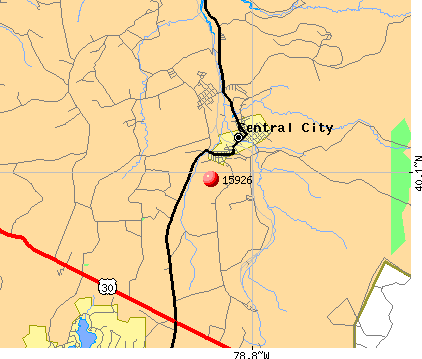
Notable locations in zip code 15926: Huksin 3 4 and 6 Mines Station (A), Reitz 3 and 4 Mines Station (B), Central City Fire Department (C). Display/hide their locations on the map
Size of family households: 385 2-persons, 127 3-persons, 106 4-persons, 41 5-persons, 12 6-persons, 30 7-or-more-persons
Size of nonfamily households: 281 1-person, 24 2-persons, 8 3-persons
326 married couples with children.
106 single-parent households (65 men, 41 women).
95.5% of residents of 15926 zip code speak English at home.
3.6% of residents speak other Indo-European language at home (95% very well, 5% well).
0.6% of residents speak Asian or Pacific Island language at home (100% well).
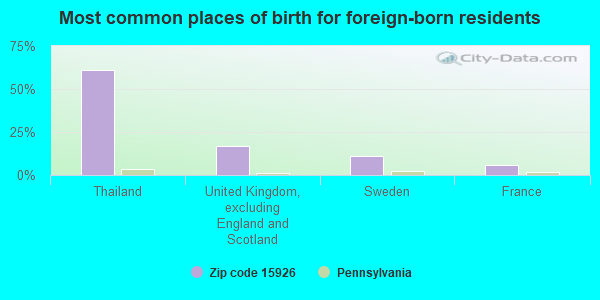
Foreign born population: 18 (0.8%) (89.3% of them are naturalized citizens)
This zip code:
0.8%
Whole state:
7.5%
61%Thailand
17%United Kingdom, excluding England and Scotland
11%Sweden
6%France
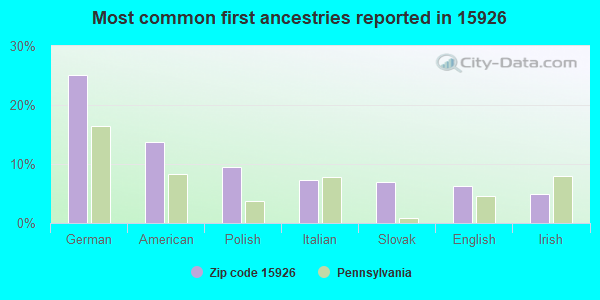
25%German
14%American
10%Polish
7%Italian
7%Slovak
6%English
5%Irish
Year of entry for the foreign-born population
02010 or later
02000 to 2009
21990 to 1999
19Before 1990
Facilities with environmental interests located in this zip code:
AGUSTUS MINE (1499 GAHAGEN ROAD in CENTRAL CITY, PA)
STATE MASTER (Pennsylvania database) - PCS-PA0218201, National Pollutant Discharge Elimination System Permit National Pollutant Discharge Elimination System NON-MAJOR (Tracking pollutant discharge elimination systems) - permit Business SIC classification: BITUMINOUS COAL UNDERGROUND MINING Organizations: ROXCOAL, INC. (CONTACT/GENERAL)
Alternative names: ROXCOAL INC
AT & T BALD KNOB (RD #1 RTE 30 in CENTRAL CITY, PA)
Conditionally Exempt Small Quantity Generators, less than 100 kg/month of hazardous waste (Resource Conservation and Recovery Act (tracking hazardous waste)) - notification Organizations: AT&T COMMUNICATIONS (CONTACT/OWNER)
Alternative names: ATT BALD KNOB
Housing units lacking complete plumbing facilities: 2.7% Housing units lacking complete kitchen facilities: 3.4%
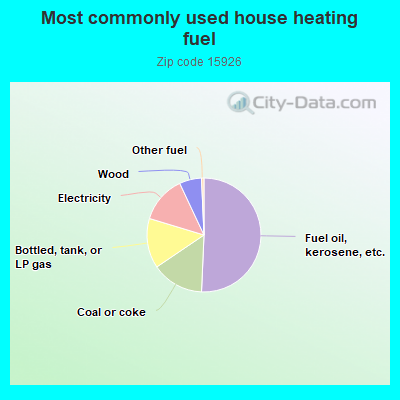
50.9%Fuel oil, kerosene, etc.
14.9%Coal or coke
14.2%Bottled, tank, or LP gas
13.4%Electricity
6.3%Wood
0.7%Other fuel
Population in 1990: 2,886.
Place of birth for U.S.-born residents:
This state: 2,197
Northeast: 33
Midwest: 65
South: 119
West: 5
73% of the 15926 zip code residents lived in the same house 5 years ago. Out of people who lived in different houses, 67% lived in this county. Out of people who lived in different counties, 50% lived in Pennsylvania.
95% of the 15926 zip code residents lived in the same house 1 year ago. Out of people who lived in different houses, 80% moved from this county. Out of people who lived in different houses, 5% moved from different county within same state. Out of people who lived in different houses, 16% moved from different state.
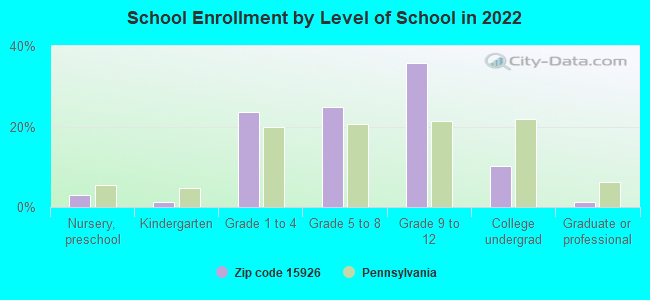
Private vs. public school enrollment:
Students in private schools in grades 1 to 8 (elementary and middle school): 42
Here:
19.4%
Pennsylvania:
15.7%
Students in private schools in grades 9 to 12 (high school): 8
Here:
5.5%
Pennsylvania:
13.4%
Students in private undergraduate colleges: 16
Here:
35.0%
Pennsylvania:
39.8%
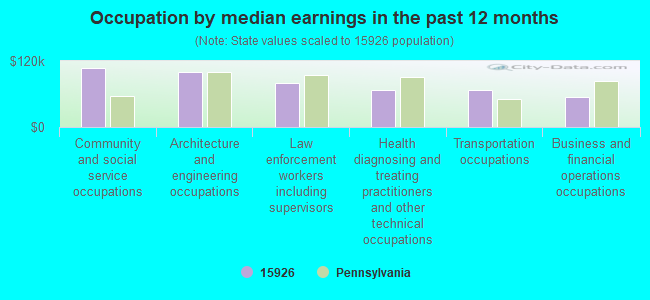
Occupation by median earnings in the past 12 months ($)
106,853Community and social service occupations
100,610Architecture and engineering occupations
79,937Law enforcement workers including supervisors
67,599Health diagnosing and treating practitioners and other technical occupations
66,676Transportation occupations
53,767Business and financial operations occupations
Top industries in this zip code by the number of employees in 2005:
Administrative and Support and Waste Management and Remediation Services: All Other Support Services (20-49 employees: 1 establishment)
Other Services (except Public Administration): Civic and Social Organizations (10-19: 1, 5-9: 1, 1-4: 1)
Accommodation and Food Services: Limited-Service Restaurants (10-19: 1, 1-4: 1)
Wholesale Trade: Medical, Dental, and Hospital Equipment and Supplies Merchant Wholesalers (10-19: 1)
Administrative and Support and Waste Management and Remediation Services: Document Preparation Services (10-19: 1)
Professional, Scientific, and Technical Services: Engineering Services (10-19: 1)
Accommodation and Food Services: Hotels (except Casino Hotels) and Motels (10-19: 1)
Construction: Electrical Contractors (10-19: 1)
People in group quarters in 2000:
3 people in religious group quarters
Fatal accident statistics in 2014:
Fatal accident count: 1
Vehicles involved in fatal accidents: 1
Fatal accidents caused by drunken drivers: 1
Fatalities: 1
Persons involved in fatal accidents: 1
Pedestrians involved in fatal accidents: 0
Fatal accident statistics in 2012:
Fatal accident count: 1
Vehicles involved in fatal accidents: 1
Fatal accidents caused by drunken drivers: 0
Fatalities: 1
Persons involved in fatal accidents: 1
Pedestrians involved in fatal accidents: 1
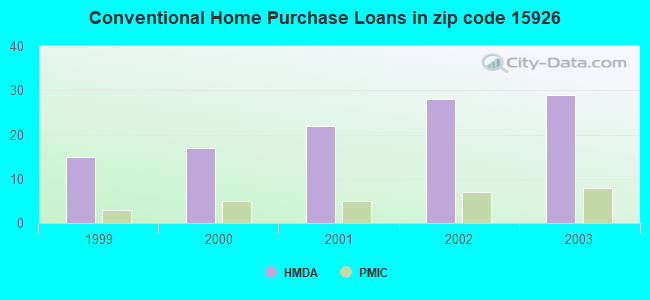
Home Mortgage Disclosure Act Aggregated Statistics For Year 2003 (Based on 4 partial tracts)
A) FHA, FSA/RHS & VA Home Purchase Loans
B) Conventional Home Purchase Loans
C) Refinancings
D) Home Improvement Loans
F) Non-occupant Loans on < 5 Family Dwellings (A B C & D)
Number
Average Value
Number
Average Value
Number
Average Value
Number
Average Value
Number
Average Value
LOANS ORIGINATED
1
$117,260
29
$112,253
91
$87,650
23
$35,160
21
$146,104
APPLICATIONS APPROVED, NOT ACCEPTED
0
$0
2
$58,375
15
$78,826
3
$23,787
0
$0
APPLICATIONS DENIED
1
$65,860
7
$61,621
43
$74,231
7
$28,856
2
$93,765
APPLICATIONS WITHDRAWN
0
$0
5
$83,670
18
$72,775
2
$31,090
3
$90,753
FILES CLOSED FOR INCOMPLETENESS
0
$0
1
$119,260
2
$117,845
0
$0
1
$119,260
Aggregated Statistics For Year 2002 (Based on 4 partial tracts)
A) FHA, FSA/RHS & VA Home Purchase Loans
B) Conventional Home Purchase Loans
C) Refinancings
D) Home Improvement Loans
F) Non-occupant Loans on < 5 Family Dwellings (A B C & D)
Number
Average Value
Number
Average Value
Number
Average Value
Number
Average Value
Number
Average Value
LOANS ORIGINATED
3
$52,637
28
$109,310
69
$81,091
21
$28,308
16
$156,561
APPLICATIONS APPROVED, NOT ACCEPTED
0
$0
3
$77,097
16
$68,785
1
$70,530
1
$79,130
APPLICATIONS DENIED
0
$0
6
$55,325
40
$70,274
10
$17,410
2
$93,615
APPLICATIONS WITHDRAWN
0
$0
2
$73,920
17
$96,667
1
$21,940
0
$0
FILES CLOSED FOR INCOMPLETENESS
0
$0
0
$0
4
$138,542
0
$0
0
$0
Aggregated Statistics For Year 2001 (Based on 4 partial tracts)
A) FHA, FSA/RHS & VA Home Purchase Loans
B) Conventional Home Purchase Loans
C) Refinancings
D) Home Improvement Loans
F) Non-occupant Loans on < 5 Family Dwellings (A B C & D)
Number
Average Value
Number
Average Value
Number
Average Value
Number
Average Value
Number
Average Value
LOANS ORIGINATED
6
$62,240
22
$89,182
62
$67,368
25
$20,758
7
$100,167
APPLICATIONS APPROVED, NOT ACCEPTED
0
$0
4
$41,362
15
$65,271
4
$40,002
0
$0
APPLICATIONS DENIED
0
$0
9
$42,891
49
$62,067
11
$20,243
2
$15,455
APPLICATIONS WITHDRAWN
0
$0
2
$67,115
20
$70,618
1
$25,960
1
$139,950
FILES CLOSED FOR INCOMPLETENESS
0
$0
0
$0
6
$75,428
0
$0
0
$0
Aggregated Statistics For Year 2000 (Based on 4 partial tracts)
A) FHA, FSA/RHS & VA Home Purchase Loans
B) Conventional Home Purchase Loans
C) Refinancings
D) Home Improvement Loans
F) Non-occupant Loans on < 5 Family Dwellings (A B C & D)
Number
Average Value
Number
Average Value
Number
Average Value
Number
Average Value
Number
Average Value
LOANS ORIGINATED
5
$65,942
17
$87,271
25
$52,445
23
$24,277
7
$83,034
APPLICATIONS APPROVED, NOT ACCEPTED
0
$0
4
$32,240
8
$72,564
4
$20,432
0
$0
APPLICATIONS DENIED
1
$24,530
12
$47,781
26
$54,740
12
$22,196
2
$27,215
APPLICATIONS WITHDRAWN
0
$0
4
$67,202
8
$46,669
1
$30,910
1
$145,010
FILES CLOSED FOR INCOMPLETENESS
0
$0
0
$0
2
$54,380
0
$0
0
$0
Aggregated Statistics For Year 1999 (Based on 2 partial tracts)
A) FHA, FSA/RHS & VA Home Purchase Loans
B) Conventional Home Purchase Loans
C) Refinancings
D) Home Improvement Loans
F) Non-occupant Loans on < 5 Family Dwellings (A B C & D)
Detailed PMIC statistics for the following Tracts:0204.00
, 0212.00
2003 - 2018 National Fire Incident Reporting System (NFIRS) incidents
Based on the data from the years 2003 - 2018 the average number of fire incidents per year is 15. The highest number of fire incidents - 36 took place in 2005, and the least - 2 in 2003. The data has an increasing trend.
When looking into fire subcategories, the most reports belonged to: Structure Fires (68.7%), and Outside Fires (15.4%).
Fire incident types reported to NFIRS in Zip Code 15926


 Nearest zip codes: 15560, 15924, 15559, 15563, 15530, 15936.


 Based on the data from the years 2003 - 2018 the average number of fire incidents per year is 15. The highest number of fire incidents - 36 took place in 2005, and the least - 2 in 2003. The data has an increasing trend.
 When looking into fire subcategories, the most reports belonged to: Structure Fires (68.7%), and Outside Fires (15.4%).