Estimated zip code population in 2022: 1,551 Zip code population in 2010: 1,770 Zip code population in 2000: 1,927
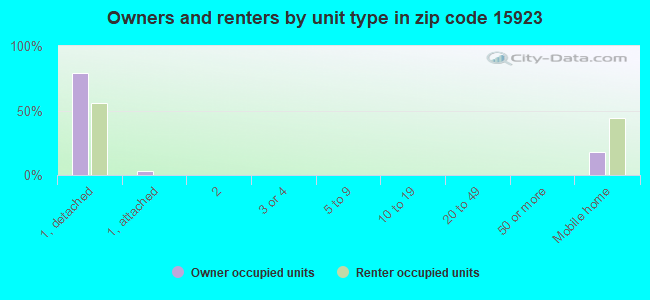
Houses and condos: 657 Renter-occupied apartments: 85
% of renters here:
14%
State:
31%
March 2022 cost of living index in zip code 15923: 87.3 (less than average, U.S. average is 100)
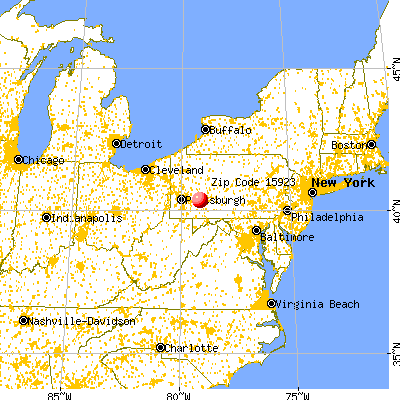
Land area: 26.0 sq. mi. Water area: 0.2 sq. mi.
Population density: 60 people per square mile
(very low).
OSM Map
General Map
Google Map
MSN Map
OSM Map
General Map
Google Map
MSN Map
OSM Map
General Map
Google Map
MSN Map
OSM Map
General Map
Google Map
MSN Map
Please wait while loading the map...
Real estate property taxes paid for housing units in 2022:
This zip code:
1.2% ($1,373)
Pennsylvania:
1.3% ($3,094)
Median real estate property taxes paid for housing units with mortgages in 2022: $1,702 (0.9%) Median real estate property taxes paid for housing units with no mortgage in 2022: $1,206 (1.3%)
Business Search- 14 Million verified businesses
Males: 855
(55.1%)
Females: 696
(44.9%)
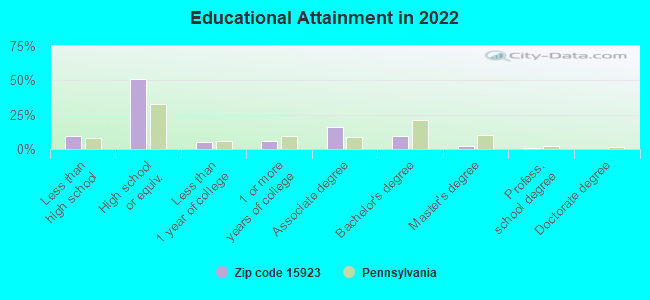
For population 25 years and over in 15923:
High school or higher: 89.5%
Bachelor's degree or higher: 12.3%
Graduate or professional degree: 2.9%
Unemployed: 5.3%
Mean travel time to work (commute): 34.4 minutes
For population 15 years and over in 15923:
Never married: 24.2%
Now married: 53.2%
Separated: 1.1%
Widowed: 11.4%
Divorced: 10.1%
Zip code 15923 compared to state average:
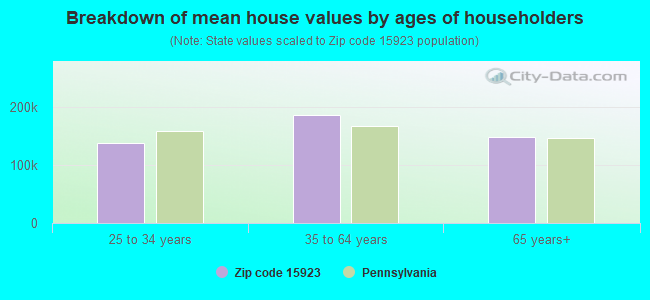
Median house value below state average.
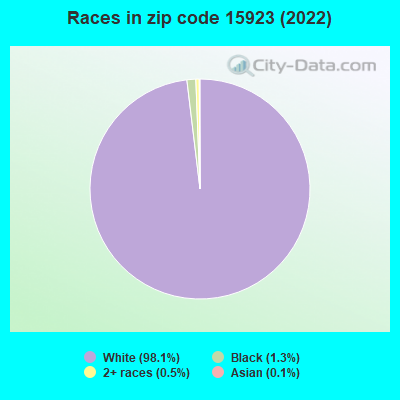
Black race population percentage significantly below state average.
Hispanic race population percentage significantly below state average.
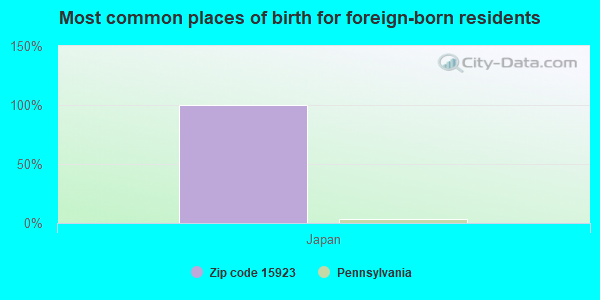
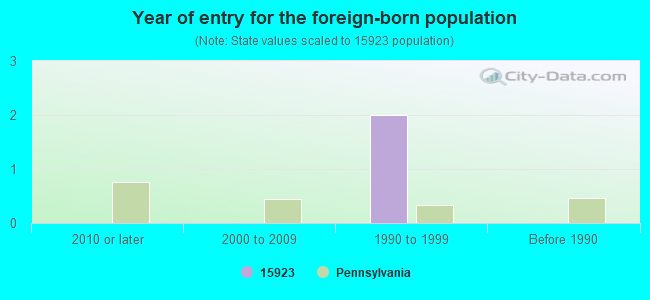
Foreign-born population percentage significantly below state average.
Renting percentage below state average.
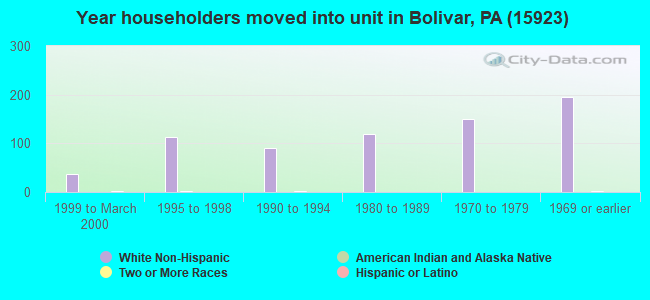
Length of stay since moving in significantly above state average.
Number of college students significantly below state average.
Percentage of population with a bachelor's degree or higher significantly below state average.
Estimated median house/condo value in 2022: $117,540
15923:
$117,540
Pennsylvania:
$245,500
According to our research of Pennsylvania and other state lists, there was 1 registered sex offender living in 15923 zip code as of May 28, 2024. The ratio of all residents to sex offenders in zip code 15923 is 1,616 to 1. The ratio of registered sex offenders to all residents in this zip code is much lower than the state average.
Median resident age:
This zip code:
44.7 years
Pennsylvania median age:
40.9 years
Average household size:
This zip code:
2.6 people
Pennsylvania:
2.4 people
Averages for the 2020 tax year for zip code 15923, filed in 2021:
Average Adjusted Gross Income (AGI) in 2020: $49,527 (Individual Income Tax Returns)
Here:
$49,527
State:
$75,707
Salary/wage: $44,049 (reported on 78.6% of returns)
Here:
$44,049
State:
$62,806
(% of AGI for various income ranges: 1057.1% for AGIs below $25k, 3194.3% for AGIs $25k-50k, 6171.1% for AGIs $50k-75k, 8492.5% for AGIs $75k-100k, 15011.7% for AGIs $100k-200k)
Taxable interest for individuals: $460 (reported on 28.6% of returns)
This zip code:
$460
Pennsylvania:
$1,633
(% of AGI for various income ranges: 8.2% for AGIs below $25k, 7.1% for AGIs $25k-50k, 30.0% for AGIs $50k-75k, 68.3% for AGIs $100k-200k)
Ordinary dividends: $3,592 (reported on 18.6% of returns)
Here:
$3,592
State:
$7,382
(% of AGI for various income ranges: 11.2% for AGIs below $25k, 77.1% for AGIs $25k-50k, 28.9% for AGIs $50k-75k, 523.3% for AGIs $100k-200k)
Net capital gain/loss in AGI: +$1,700 (reported on 12.9% of returns)
Here:
+$1,700
State:
+$23,522
(% of AGI for various income ranges: 32.9% for AGIs below $25k, 62.2% for AGIs $50k-75k, 68.3% for AGIs $100k-200k)
Profit/loss from business: +$12,986 (reported on 10.0% of returns)
Here:
+$12,986
State:
+$16,274
(% of AGI for various income ranges: 52.4% for AGIs below $25k, 453.6% for AGIs $25k-50k, 462.5% for AGIs $75k-100k)
Taxable individual retirement arrangement distribution: $9,500 (reported on 10.0% of returns)
15923:
$9,500
Pennsylvania:
$18,583
(% of AGI for various income ranges: 67.6% for AGIs below $25k, 128.6% for AGIs $25k-50k, 411.1% for AGIs $50k-75k)
Earned income credit: $1,990 (reported on 14.3% of returns)
Here:
$1,990
State:
$2,100
(% of AGI for various income ranges: 80.0% for AGIs below $25k, 45.0% for AGIs $25k-50k)
Percentage of individuals using paid preparers for their 2020 taxes: 94.3%
Here:
94%
State:
92%
(% for various income ranges: 92.3% for AGIs below $25k, 94.1% for AGIs $25k-50k, 92.3% for AGIs $50k-75k, 100.0% for AGIs $75k-100k, 100.0% for AGIs $100k-200k)
Averages for the 2012 tax year for zip code 15923, filed in 2013:
Average Adjusted Gross Income (AGI) in 2012: $43,157 (Individual Income Tax Returns)
Here:
$43,157
State:
$61,346
Salary/wage: $38,221 (reported on 82.4% of returns)
Here:
$38,221
State:
$51,902
(% of AGI for various income ranges: 61.2% for AGIs below $25k, 74.3% for AGIs $25k-50k, 74.1% for AGIs $50k-75k, 89.2% for AGIs $75k-100k, 68.7% for AGIs $100k-200k)
Taxable interest for individuals: $704 (reported on 31.1% of returns)
This zip code:
$704
Pennsylvania:
$1,588
(% of AGI for various income ranges: 1.9% for AGIs below $25k, 0.5% for AGIs $25k-50k, 0.3% for AGIs $50k-75k, 0.4% for AGIs $100k-200k)
Ordinary dividends: $1,707 (reported on 20.3% of returns)
Here:
$1,707
State:
$5,827
(% of AGI for various income ranges: 0.9% for AGIs below $25k, 1.0% for AGIs $25k-50k, 0.4% for AGIs $50k-75k, 1.2% for AGIs $100k-200k)
Net capital gain/loss in AGI: +$5,357 (reported on 9.5% of returns)
Here:
+$5,357
State:
+$14,495
Profit/loss from business: +$3,356 (reported on 12.2% of returns)
Here:
+$3,356
State:
+$16,268
(% of AGI for various income ranges: 2.4% for AGIs below $25k, 2.0% for AGIs $25k-50k, 1.0% for AGIs $50k-75k)
Taxable individual retirement arrangement distribution: $6,514 (reported on 9.5% of returns)
15923:
$6,514
Pennsylvania:
$14,550
Total itemized deductions: $16,733 (19% of AGI, reported on 16.2% of returns)
Here:
$16,733
State:
$23,538
Here:
19.0% of AGI
State:
18.4% of AGI
(% of AGI for various income ranges: 6.0% for AGIs $25k-50k, 11.1% for AGIs $50k-75k, 8.5% for AGIs $100k-200k)
Charity contributions: $1,588 (reported on 10.8% of returns)
Here:
$1,588
State:
$4,025
Taxes paid: $5,758 (reported on 16.2% of returns)
15923:
$5,758
State:
$9,982
(% of AGI for various income ranges: 1.3% for AGIs $25k-50k, 3.3% for AGIs $50k-75k, 3.8% for AGIs $100k-200k)
Earned income credit: $1,936 (reported on 14.9% of returns)
Here:
$1,936
State:
$2,106
(% of AGI for various income ranges: 3.9% for AGIs below $25k, 0.9% for AGIs $25k-50k)
Percentage of individuals using paid preparers for their 2012 taxes: 63.5%
Here:
64%
State:
53%
(% for various income ranges: 63.6% for AGIs below $25k, 57.9% for AGIs $25k-50k, 72.7% for AGIs $50k-75k, 60.0% for AGIs $75k-100k, 66.7% for AGIs $100k-200k)
Averages for the 2004 tax year for zip code 15923, filed in 2005:
Average Adjusted Gross Income (AGI) in 2004: $33,367 (Individual Income Tax Returns)
Here:
$33,367
State:
$48,049
Salary/wage: $31,179 (reported on 83.8% of returns)
Here:
$31,179
State:
$42,646
(% of AGI for various income ranges: 84.8% for AGIs below $10k, 70.0% for AGIs $10k-25k, 82.0% for AGIs $25k-50k, 86.5% for AGIs $50k-75k, 85.9% for AGIs $75k-100k, 63.7% for AGIs over 100k)
Taxable interest for individuals: $1,087 (reported on 38.6% of returns)
This zip code:
$1,087
Pennsylvania:
$1,657
(% of AGI for various income ranges: 4.1% for AGIs below $10k, 2.8% for AGIs $10k-25k, 1.5% for AGIs $25k-50k, 0.5% for AGIs $50k-75k, 0.1% for AGIs $75k-100k, 0.7% for AGIs over 100k)
Taxable dividends: $811 (reported on 21.2% of returns)
Here:
$811
State:
$3,566
(% of AGI for various income ranges: 3.4% for AGIs below $10k, 1.5% for AGIs $10k-25k, 0.3% for AGIs $25k-50k, 0.1% for AGIs $50k-75k, 0.1% for AGIs $75k-100k, 0.4% for AGIs over 100k)
Net capital gain/loss: +$1,228 (reported on 11.9% of returns)
Here:
+$1,228
State:
+$9,716
(% of AGI for various income ranges: 1.8% for AGIs below $10k, -0.1% for AGIs $10k-25k, 0.2% for AGIs $25k-50k, 0.0% for AGIs $50k-75k, 1.8% for AGIs over 100k)
Profit/loss from business: +$3,102 (reported on 12.7% of returns)
Here:
+$3,102
State:
+$14,267
(% of AGI for various income ranges: 18.8% for AGIs below $10k, 2.4% for AGIs $10k-25k, 0.5% for AGIs $25k-50k, 0.7% for AGIs $50k-75k)
IRA payment deduction: $2,059 (reported on 2.2% of returns)
15923:
$2,059
Pennsylvania:
$2,903
Total itemized deductions: $14,412 (21% of AGI, reported on 19.1% of returns)
Here:
$14,412
State:
$18,804
Here:
21.2% of AGI
State:
19.5% of AGI
(% of AGI for various income ranges: 6.6% for AGIs $10k-25k, 8.9% for AGIs $25k-50k, 8.9% for AGIs $50k-75k, 7.1% for AGIs $75k-100k, 9.8% for AGIs over 100k)
Charity contributions deductions: $2,854 (4% of AGI, reported on 16.8% of returns)
Here:
$2,854
State:
$3,337
Here:
4.1% of AGI
State:
3.3% of AGI
(% of AGI for various income ranges: 1.5% for AGIs $10k-25k, 1.6% for AGIs $25k-50k, 1.3% for AGIs $50k-75k, 1.5% for AGIs $75k-100k, 1.4% for AGIs over 100k)
Total tax: $4,245 (reported on 70.2% of returns)
15923:
$4,245
State:
$8,008
(% of AGI for various income ranges: 3.6% for AGIs below $10k, 3.3% for AGIs $10k-25k, 5.4% for AGIs $25k-50k, 8.5% for AGIs $50k-75k, 11.3% for AGIs $75k-100k, 19.3% for AGIs over 100k)
Earned income credit: $1,480 (reported on 19.4% of returns)
Here:
$1,480
State:
$1,643
Percentage of individuals using paid preparers for their 2004 taxes: 69.5%
Here:
69%
State:
56%
(% for various income ranges: 64.1% for AGIs below $10k, 70.4% for AGIs $10k-25k, 73.3% for AGIs $25k-50k, 64.0% for AGIs $50k-75k, 69.4% for AGIs $75k-100k, 81.5% for AGIs over 100k)
Household received Food Stamps/SNAP in the past 12 months: 100 Household did not receive Food Stamps/SNAP in the past 12 months: 493
Women who had a birth in the past 12 months: 9 (9 now married, 0 unmarried) Women who did not have a birth in the past 12 months: 245 (144 now married, 99 unmarried)
Housing units in zip code 15923 with a mortgage: 166 (33 second mortgage, 8 home equity loan, 26 both second mortgage and home equity loan) Houses without a mortgage: 6
Median monthly owner costs for units with a mortgage: $1,317 Median monthly owner costs for units without a mortgage: $474
Residents with income below the poverty level in 2022:
This zip code:
8.2%
Whole state:
11.8%
Residents with income below 50% of the poverty level in 2022:
This zip code:
3.6%
Whole state:
6.1%
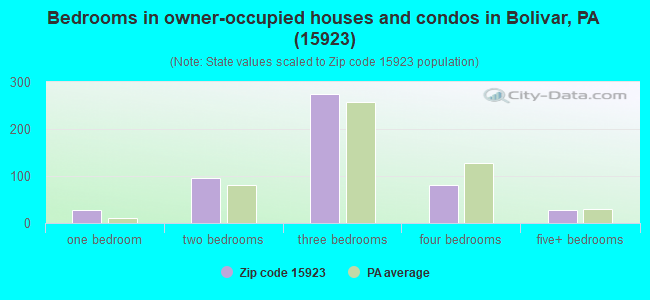
Median number of rooms in houses and condos:
Here:
6.3
State:
6.8
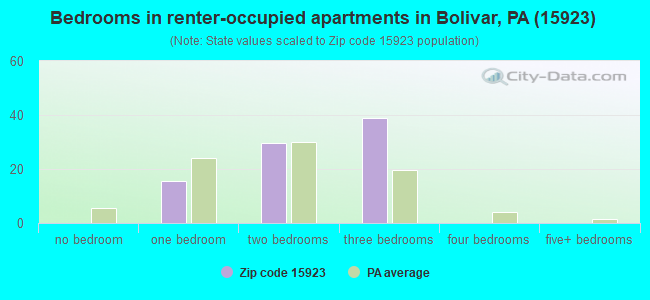
Median number of rooms in apartments:
Here:
5.2
State:
4.3
Notable locations in this zip code not listed on our city pages
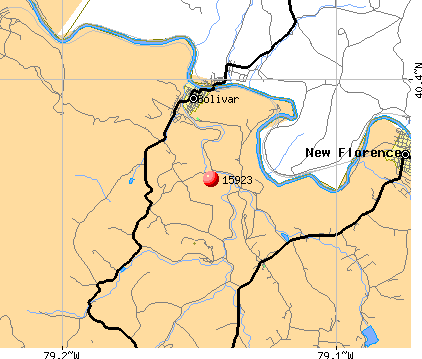
Notable locations in zip code 15923: Champion Lakes Golf Course (A), Camp Fairfield (B), Camp Kaufmann (C), Liberty Hall (D), Lockport Station (E), Bolivar Volunteer Fire Company (F). Display/hide their locations on the map
Streams, rivers, and creeks: Hypocrite Creek (A), Tubmill Creek (B), Hendricks Creek (C), Freeman Run (D), Snyders Run (E). Display/hide their locations on the map
In group quarters: 38 (-1 institutionalized population)
Size of family households: 183 2-persons, 82 3-persons, 72 4-persons, 27 5-persons, 9 6-persons, 24 7-or-more-persons
Size of nonfamily households: 166 1-person, 25 2-persons, 1 3-persons
230 married couples with children.
39 single-parent households (22 men, 17 women).
99.0% of residents of 15923 zip code speak English at home.
0.1% of residents speak Spanish at home (100% very well).
0.4% of residents speak Asian or Pacific Island language at home (50% very well, 50% not well).
Foreign born population: 3 (0.2%) (100.0% of them are naturalized citizens)
This zip code:
0.2%
Whole state:
7.5%
100%Japan
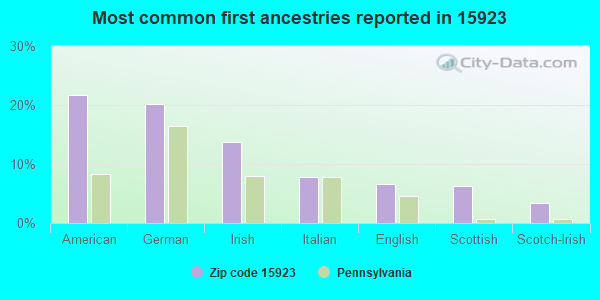
22%American
20%German
14%Irish
8%Italian
7%English
6%Scottish
3%Scotch-Irish
Year of entry for the foreign-born population
02010 or later
02000 to 2009
21990 to 1999
0Before 1990
Facilities with environmental interests located in this zip code:
ANTIOCHIAN VILLAGE (RR 1 BOX 1 in BOLIVAR, PA)
STATE MASTER (Pennsylvania database) - PCS-PA0094404, National Pollutant Discharge Elimination System Permit, PWSID-5650425, DRINKING WATER PROGRAM National Pollutant Discharge Elimination System NON-MAJOR (Tracking pollutant discharge elimination systems) - permit Business SIC classification: SPORTING AND RECREATIONAL CAMPS Alternative names: ANTIOCHIAN ORTHODOX CHRISTIAN
ALLEGHENY FOUNDRY CO/BOLIVAR (FOUNDRY RD OFF RT 259 PO BOX in BOLIVAR, PA)
AIR MINOR (AIRS/AFS) CRITERIA AND HAZARDOUS AIR POLLUTANT INVENTORY (Inventory of air pollution sources) Business SIC classification: GRAY AND DUCTILE IRON FOUNDRIES
Housing units lacking complete plumbing facilities: 0.7% Housing units lacking complete kitchen facilities: 1.3%
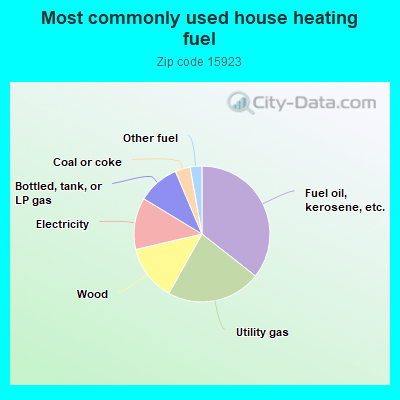
35.8%Fuel oil, kerosene, etc.
22.6%Utility gas
13.3%Wood
12.4%Electricity
10.0%Bottled, tank, or LP gas
3.6%Coal or coke
2.8%Other fuel
Population in 1990: 2,043.
Place of birth for U.S.-born residents:
This state: 1,393
Northeast: 10
Midwest: 6
South: 120
West: 5
68% of the 15923 zip code residents lived in the same house 5 years ago. Out of people who lived in different houses, 67% lived in this county. Out of people who lived in different counties, 50% lived in Pennsylvania.
96% of the 15923 zip code residents lived in the same house 1 year ago. Out of people who lived in different houses, 45% moved from this county. Out of people who lived in different houses, 10% moved from different county within same state. Out of people who lived in different houses, 49% moved from different state.
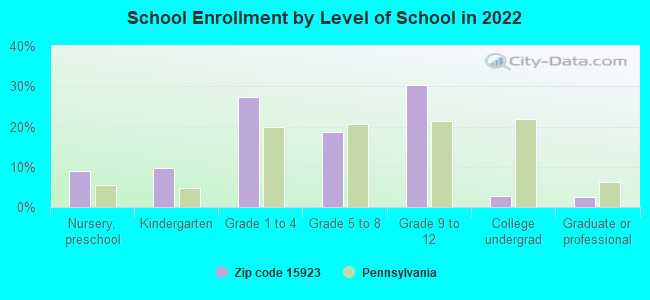
Private vs. public school enrollment:
Students in private schools in grades 1 to 8 (elementary and middle school): 28
Here:
16.9%
Pennsylvania:
15.7%
Students in private schools in grades 9 to 12 (high school): 14
Here:
12.7%
Pennsylvania:
13.4%
Students in private undergraduate colleges:
Here:
0.0%
Pennsylvania:
39.8%
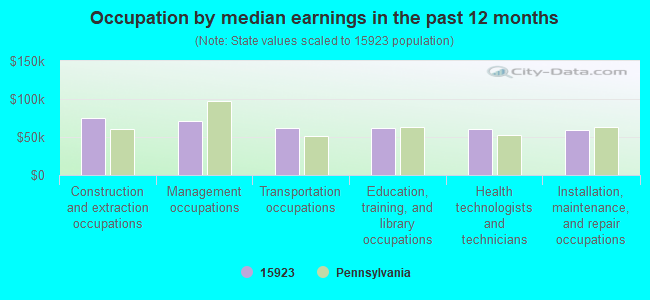
Occupation by median earnings in the past 12 months ($)
74,714Construction and extraction occupations
70,549Management occupations
62,258Transportation occupations
62,098Education, training, and library occupations
60,210Health technologists and technicians
58,969Installation, maintenance, and repair occupations
Top industries in this zip code by the number of employees in 2005:
Educational Services: All Other Miscellaneous Schools and Instruction (50-99 employees: 1 establishment)
Accommodation and Food Services: Limited-Service Restaurants (20-49: 1, 1-4: 1)
Administrative and Support and Waste Management and Remediation Services: Solid Waste Landfill (10-19: 1)
Accommodation and Food Services: Recreational and Vacation Camps (except Campgrounds) (10-19: 1)
Other Services (except Public Administration): Civic and Social Organizations (5-9: 1)
Health Care and Social Assistance: Offices of Physicians (except Mental Health Specialists) (5-9: 1)
Arts, Entertainment, and Recreation: Golf Courses and Country Clubs (5-9: 1)
Other Services (except Public Administration): Religious Organizations (5-9: 1)
Accommodation and Food Services: Drinking Places (Alcoholic Beverages) (5-9: 1)
Wholesale Trade: Beer and Ale Merchant Wholesalers (5-9: 1)
People in group quarters in 2010:
49 people in residential treatment centers for juveniles (non-correctional)
5 people in group homes intended for adults
3 people in other noninstitutional facilities
People in group quarters in 2000:
34 people in homes for abused, dependent, and neglected children
7 people in religious group quarters
6 people in hospitals or wards for drug/alcohol abuse
5 people in other noninstitutional group quarters
Fatal accident statistics in 2014:
Fatal accident count: 1
Vehicles involved in fatal accidents: 1
Fatal accidents caused by drunken drivers: 0
Fatalities: 1
Persons involved in fatal accidents: 1
Pedestrians involved in fatal accidents: 0
Home Mortgage Disclosure Act Aggregated Statistics For Year 2009 (Based on 2 partial tracts)
A) FHA, FSA/RHS & VA Home Purchase Loans
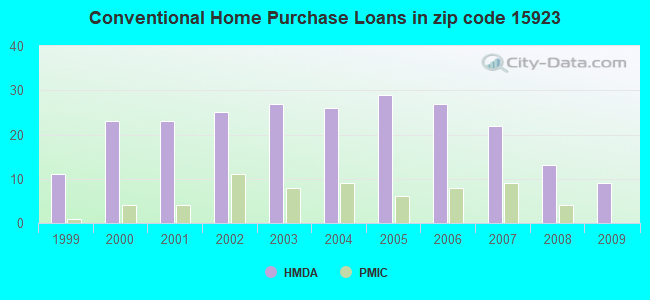
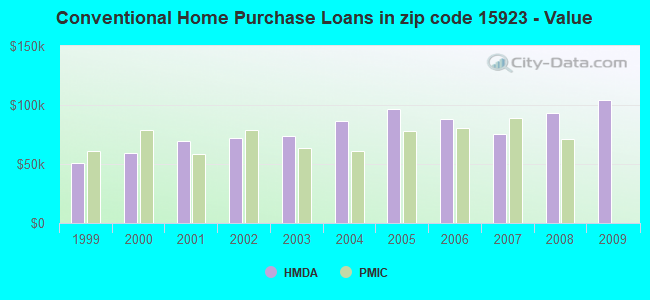
B) Conventional Home Purchase Loans
C) Refinancings
D) Home Improvement Loans
F) Non-occupant Loans on < 5 Family Dwellings (A B C & D)
G) Loans On Manufactured Home Dwelling (A B C & D)
Number
Average Value
Number
Average Value
Number
Average Value
Number
Average Value
Number
Average Value
Number
Average Value
LOANS ORIGINATED
7
$117,657
9
$104,176
42
$118,402
12
$32,632
4
$191,652
4
$61,740
APPLICATIONS APPROVED, NOT ACCEPTED
1
$144,620
0
$0
4
$119,955
1
$153,200
0
$0
0
$0
APPLICATIONS DENIED
3
$89,673
2
$113,370
23
$109,558
5
$29,046
1
$82,730
2
$77,215
APPLICATIONS WITHDRAWN
1
$143,400
1
$500,660
11
$157,824
1
$18,380
0
$0
0
$0
FILES CLOSED FOR INCOMPLETENESS
1
$66,800
0
$0
3
$107,853
0
$0
0
$0
0
$0
Aggregated Statistics For Year 2008 (Based on 2 partial tracts)
A) FHA, FSA/RHS & VA Home Purchase Loans
B) Conventional Home Purchase Loans
C) Refinancings
D) Home Improvement Loans
F) Non-occupant Loans on < 5 Family Dwellings (A B C & D)
G) Loans On Manufactured Home Dwelling (A B C & D)
Number
Average Value
Number
Average Value
Number
Average Value
Number
Average Value
Number
Average Value
Number
Average Value
LOANS ORIGINATED
8
$77,825
13
$93,570
21
$72,281
18
$26,180
2
$52,395
3
$66,387
APPLICATIONS APPROVED, NOT ACCEPTED
1
$37,380
4
$89,622
4
$103,870
1
$55,150
1
$62,510
1
$45,350
APPLICATIONS DENIED
1
$53,310
9
$80,618
33
$85,588
14
$52,131
0
$0
4
$65,418
APPLICATIONS WITHDRAWN
1
$131,750
1
$110,300
12
$90,439
2
$76,905
1
$30,640
1
$150,750
FILES CLOSED FOR INCOMPLETENESS
0
$0
0
$0
4
$96,975
1
$17,160
0
$0
0
$0
Aggregated Statistics For Year 2007 (Based on 2 partial tracts)
A) FHA, FSA/RHS & VA Home Purchase Loans
B) Conventional Home Purchase Loans
C) Refinancings
D) Home Improvement Loans
F) Non-occupant Loans on < 5 Family Dwellings (A B C & D)
G) Loans On Manufactured Home Dwelling (A B C & D)
Number
Average Value
Number
Average Value
Number
Average Value
Number
Average Value
Number
Average Value
Number
Average Value
LOANS ORIGINATED
4
$69,248
22
$75,319
38
$102,870
17
$20,655
4
$45,195
4
$40,138
APPLICATIONS APPROVED, NOT ACCEPTED
1
$118,270
4
$69,552
8
$61,816
3
$30,230
1
$41,670
1
$53,310
APPLICATIONS DENIED
2
$67,100
7
$44,121
70
$109,586
20
$37,228
4
$289,855
10
$55,458
APPLICATIONS WITHDRAWN
2
$103,255
4
$66,948
11
$110,916
1
$20,220
2
$62,810
1
$32,480
FILES CLOSED FOR INCOMPLETENESS
0
$0
1
$64,340
6
$138,800
1
$18,380
0
$0
0
$0
Aggregated Statistics For Year 2006 (Based on 2 partial tracts)
A) FHA, FSA/RHS & VA Home Purchase Loans
B) Conventional Home Purchase Loans
C) Refinancings
D) Home Improvement Loans
F) Non-occupant Loans on < 5 Family Dwellings (A B C & D)
G) Loans On Manufactured Home Dwelling (A B C & D)
Number
Average Value
Number
Average Value
Number
Average Value
Number
Average Value
Number
Average Value
Number
Average Value
LOANS ORIGINATED
8
$90,618
27
$88,220
50
$73,524
28
$22,783
2
$171,890
4
$68,175
APPLICATIONS APPROVED, NOT ACCEPTED
1
$112,760
5
$96,210
6
$52,190
4
$18,538
2
$111,835
2
$50,555
APPLICATIONS DENIED
1
$72,920
15
$64,589
61
$98,721
16
$21,410
1
$33,700
5
$41,548
APPLICATIONS WITHDRAWN
0
$0
4
$88,242
12
$140,433
1
$25,120
1
$57,600
1
$37,990
FILES CLOSED FOR INCOMPLETENESS
0
$0
1
$16,550
4
$64,650
0
$0
0
$0
0
$0
Aggregated Statistics For Year 2005 (Based on 2 partial tracts)
A) FHA, FSA/RHS & VA Home Purchase Loans
B) Conventional Home Purchase Loans
C) Refinancings
D) Home Improvement Loans
F) Non-occupant Loans on < 5 Family Dwellings (A B C & D)
G) Loans On Manufactured Home Dwelling (A B C & D)
Number
Average Value
Number
Average Value
Number
Average Value
Number
Average Value
Number
Average Value
Number
Average Value
LOANS ORIGINATED
4
$100,960
29
$97,012
51
$73,668
16
$23,861
4
$13,482
3
$26,147
APPLICATIONS APPROVED, NOT ACCEPTED
0
$0
4
$47,185
7
$80,189
2
$36,460
1
$12,260
2
$52,700
APPLICATIONS DENIED
0
$0
9
$63,187
66
$97,352
19
$24,931
1
$3,060
8
$49,330
APPLICATIONS WITHDRAWN
0
$0
6
$95,802
24
$115,360
6
$63,833
2
$337,960
1
$143,400
FILES CLOSED FOR INCOMPLETENESS
0
$0
2
$90,390
6
$99,785
1
$36,770
0
$0
0
$0
Aggregated Statistics For Year 2004 (Based on 2 partial tracts)
A) FHA, FSA/RHS & VA Home Purchase Loans
B) Conventional Home Purchase Loans
C) Refinancings
D) Home Improvement Loans
F) Non-occupant Loans on < 5 Family Dwellings (A B C & D)
G) Loans On Manufactured Home Dwelling (A B C & D)
Number
Average Value
Number
Average Value
Number
Average Value
Number
Average Value
Number
Average Value
Number
Average Value
LOANS ORIGINATED
4
$66,795
26
$86,051
55
$67,375
25
$18,163
6
$79,460
7
$38,169
APPLICATIONS APPROVED, NOT ACCEPTED
0
$0
2
$41,365
20
$62,659
4
$28,495
1
$37,990
3
$59,647
APPLICATIONS DENIED
0
$0
7
$81,766
44
$86,210
13
$19,704
1
$14,710
4
$28,648
APPLICATIONS WITHDRAWN
1
$28,800
5
$67,776
29
$83,784
3
$41,670
1
$96,210
1
$91,920
FILES CLOSED FOR INCOMPLETENESS
0
$0
1
$235,930
11
$78,717
1
$18,380
0
$0
0
$0
Aggregated Statistics For Year 2003 (Based on 2 partial tracts)
A) FHA, FSA/RHS & VA Home Purchase Loans
B) Conventional Home Purchase Loans
C) Refinancings
D) Home Improvement Loans
F) Non-occupant Loans on < 5 Family Dwellings (A B C & D)
Number
Average Value
Number
Average Value
Number
Average Value
Number
Average Value
Number
Average Value
LOANS ORIGINATED
2
$113,675
27
$73,536
86
$66,738
27
$18,293
5
$22,184
APPLICATIONS APPROVED, NOT ACCEPTED
0
$0
4
$37,535
15
$74,394
3
$19,610
1
$46,570
APPLICATIONS DENIED
0
$0
10
$59,074
49
$84,729
12
$23,338
0
$0
APPLICATIONS WITHDRAWN
0
$0
5
$91,798
18
$70,778
3
$35,950
1
$40,440
FILES CLOSED FOR INCOMPLETENESS
0
$0
0
$0
5
$86,404
0
$0
0
$0
Aggregated Statistics For Year 2002 (Based on 2 partial tracts)
A) FHA, FSA/RHS & VA Home Purchase Loans
B) Conventional Home Purchase Loans
C) Refinancings
D) Home Improvement Loans
F) Non-occupant Loans on < 5 Family Dwellings (A B C & D)
Number
Average Value
Number
Average Value
Number
Average Value
Number
Average Value
Number
Average Value
LOANS ORIGINATED
3
$73,333
25
$72,139
50
$67,653
23
$21,874
5
$54,172
APPLICATIONS APPROVED, NOT ACCEPTED
1
$36,770
5
$44,122
11
$58,049
4
$19,762
0
$0
APPLICATIONS DENIED
1
$71,700
9
$1,751,519
35
$79,226
13
$22,108
1
$19,610
APPLICATIONS WITHDRAWN
0
$0
3
$101,930
19
$75,439
3
$16,340
0
$0
FILES CLOSED FOR INCOMPLETENESS
0
$0
0
$0
7
$80,277
1
$39,830
0
$0
Aggregated Statistics For Year 2001 (Based on 2 partial tracts)
A) FHA, FSA/RHS & VA Home Purchase Loans
B) Conventional Home Purchase Loans
C) Refinancings
D) Home Improvement Loans
E) Loans on Dwellings For 5+ Families
F) Non-occupant Loans on < 5 Family Dwellings (A B C & D)
Number
Average Value
Number
Average Value
Number
Average Value
Number
Average Value
Number
Average Value
Number
Average Value
LOANS ORIGINATED
6
$51,168
23
$69,220
58
$69,785
27
$18,316
1
$15,930
4
$93,912
APPLICATIONS APPROVED, NOT ACCEPTED
0
$0
2
$52,395
17
$70,796
3
$18,793
0
$0
1
$45,960
APPLICATIONS DENIED
1
$23,900
12
$56,122
44
$65,347
12
$12,154
0
$0
1
$24,510
APPLICATIONS WITHDRAWN
0
$0
2
$55,765
20
$70,227
3
$19,407
0
$0
0
$0
FILES CLOSED FOR INCOMPLETENESS
0
$0
1
$31,250
2
$64,345
0
$0
0
$0
1
$61,890
Aggregated Statistics For Year 2000 (Based on 2 partial tracts)
A) FHA, FSA/RHS & VA Home Purchase Loans
B) Conventional Home Purchase Loans
C) Refinancings
D) Home Improvement Loans
F) Non-occupant Loans on < 5 Family Dwellings (A B C & D)
Number
Average Value
Number
Average Value
Number
Average Value
Number
Average Value
Number
Average Value
LOANS ORIGINATED
4
$49,942
23
$58,909
32
$51,054
22
$14,846
5
$35,664
APPLICATIONS APPROVED, NOT ACCEPTED
0
$0
5
$48,166
9
$52,429
4
$37,688
0
$0
APPLICATIONS DENIED
1
$79,660
8
$43,662
31
$50,981
18
$22,912
1
$37,380
APPLICATIONS WITHDRAWN
1
$31,870
5
$60,912
10
$52,885
2
$30,025
1
$21,450
FILES CLOSED FOR INCOMPLETENESS
0
$0
1
$14,710
4
$42,590
0
$0
0
$0
Aggregated Statistics For Year 1999 (Based on 1 partial tract)
A) FHA, FSA/RHS & VA Home Purchase Loans
B) Conventional Home Purchase Loans
C) Refinancings
D) Home Improvement Loans
F) Non-occupant Loans on < 5 Family Dwellings (A B C & D)
Detailed PMIC statistics for the following Tracts:8083.00
2005 - 2018 National Fire Incident Reporting System (NFIRS) incidents
Based on the data from the years 2005 - 2018 the average number of fire incidents per year is 10. The highest number of reported fires - 25 took place in 2008, and the least - 4 in 2013. The data has a decreasing trend.
When looking into fire subcategories, the most incidents belonged to: Structure Fires (58.6%), and Outside Fires (22.8%).
Fire incident types reported to NFIRS in Zip Code 15923


 Nearest zip codes: 15949, 15779, 15944, 15716, 15658, 15750.


 Based on the data from the years 2005 - 2018 the average number of fire incidents per year is 10. The highest number of reported fires - 25 took place in 2008, and the least - 4 in 2013. The data has a decreasing trend.
 When looking into fire subcategories, the most incidents belonged to: Structure Fires (58.6%), and Outside Fires (22.8%).