Estimated zip code population in 2022: 1,879 Zip code population in 2010: 1,845 Zip code population in 2000: 1,938
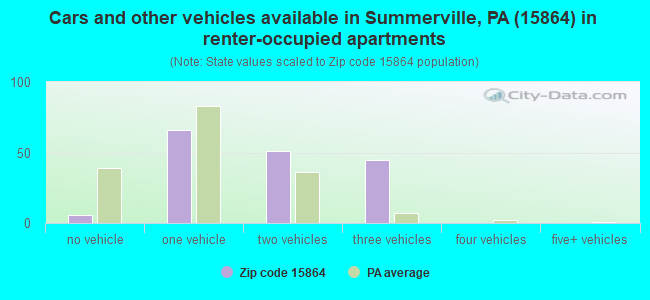
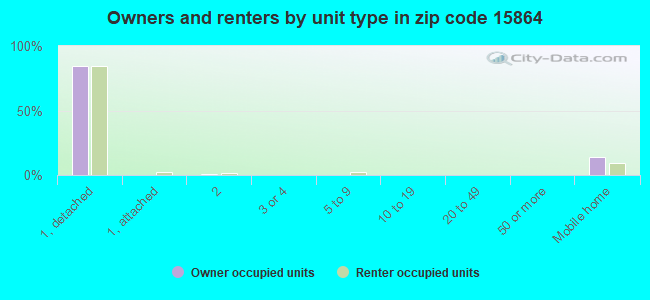
Houses and condos: 870 Renter-occupied apartments: 168
% of renters here:
23%
State:
31%
March 2022 cost of living index in zip code 15864: 91.3 (less than average, U.S. average is 100)
Land area: 36.6 sq. mi. Water area: 0.2 sq. mi.
Population density: 51 people per square mile
(very low).
OSM Map
General Map
Google Map
MSN Map
OSM Map
General Map
Google Map
MSN Map
OSM Map
General Map
Google Map
MSN Map
OSM Map
General Map
Google Map
MSN Map
Please wait while loading the map...
Real estate property taxes paid for housing units in 2022:
This zip code:
1.1% ($1,376)
Pennsylvania:
1.3% ($3,094)
Median real estate property taxes paid for housing units with mortgages in 2022: $1,283 (0.9%) Median real estate property taxes paid for housing units with no mortgage in 2022: $1,416 (1.2%)
Business Search- 14 Million verified businesses
Males: 883
(47.0%)
Females: 996
(53.0%)
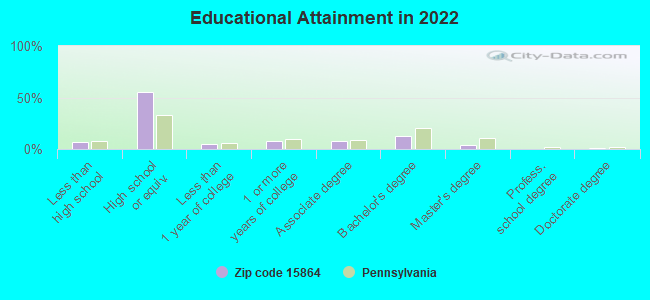
For population 25 years and over in 15864:
High school or higher: 92.1%
Bachelor's degree or higher: 17.5%
Graduate or professional degree: 4.9%
Unemployed: 3.3%
Mean travel time to work (commute): 34.3 minutes
For population 15 years and over in 15864:
Never married: 28.3%
Now married: 57.2%
Separated: 1.5%
Widowed: 5.4%
Divorced: 7.5%
Zip code 15864 compared to state average:
Median house value below state average.
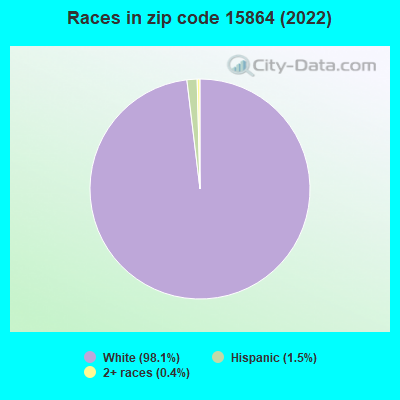
Black race population percentage significantly below state average.
Hispanic race population percentage significantly below state average.
Foreign-born population percentage significantly below state average.
Length of stay since moving in significantly above state average.
Number of college students below state average.
Percentage of population with a bachelor's degree or higher below state average.
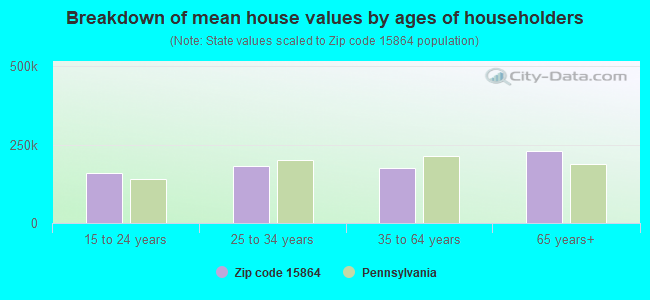
Estimated median house/condo value in 2022: $128,394
15864:
$128,394
Pennsylvania:
$245,500
According to our research of Pennsylvania and other state lists, there was 1 registered sex offender living in 15864 zip code as of May 23, 2024. The ratio of all residents to sex offenders in zip code 15864 is 1,702 to 1. The ratio of registered sex offenders to all residents in this zip code is much lower than the state average.
Median resident age:
This zip code:
44.7 years
Pennsylvania median age:
40.9 years
Average household size:
This zip code:
2.5 people
Pennsylvania:
2.4 people
Averages for the 2020 tax year for zip code 15864, filed in 2021:
Average Adjusted Gross Income (AGI) in 2020: $49,756 (Individual Income Tax Returns)
Here:
$49,756
State:
$75,707
Salary/wage: $42,238 (reported on 80.9% of returns)
Here:
$42,238
State:
$62,806
(% of AGI for various income ranges: 979.0% for AGIs below $25k, 3225.5% for AGIs $25k-50k, 5776.9% for AGIs $50k-75k, 8806.7% for AGIs $75k-100k, 15346.7% for AGIs $100k-200k)
Taxable interest for individuals: $531 (reported on 40.4% of returns)
This zip code:
$531
Pennsylvania:
$1,633
(% of AGI for various income ranges: 9.5% for AGIs below $25k, 14.0% for AGIs $25k-50k, 11.5% for AGIs $50k-75k, 133.3% for AGIs $75k-100k, 81.7% for AGIs $100k-200k)
Ordinary dividends: $1,762 (reported on 18.0% of returns)
Here:
$1,762
State:
$7,382
(% of AGI for various income ranges: 9.0% for AGIs below $25k, 18.5% for AGIs $25k-50k, 99.2% for AGIs $50k-75k, 61.7% for AGIs $75k-100k, 101.7% for AGIs $100k-200k)
Net capital gain/loss in AGI: +$3,223 (reported on 14.6% of returns)
Here:
+$3,223
State:
+$23,522
(% of AGI for various income ranges: 11.5% for AGIs $25k-50k, 200.8% for AGIs $50k-75k, 225.0% for AGIs $100k-200k)
Profit/loss from business: +$10,036 (reported on 12.4% of returns)
Here:
+$10,036
State:
+$16,274
(% of AGI for various income ranges: 64.5% for AGIs below $25k, 143.0% for AGIs $25k-50k, 190.8% for AGIs $50k-75k, 735.0% for AGIs $75k-100k)
Taxable individual retirement arrangement distribution: $12,300 (reported on 12.4% of returns)
15864:
$12,300
Pennsylvania:
$18,583
(% of AGI for various income ranges: 71.5% for AGIs below $25k, 157.0% for AGIs $25k-50k, 321.5% for AGIs $50k-75k, 796.7% for AGIs $75k-100k)
Earned income credit: $2,133 (reported on 13.5% of returns)
Here:
$2,133
State:
$2,100
(% of AGI for various income ranges: 67.5% for AGIs below $25k, 60.5% for AGIs $25k-50k)
Percentage of individuals using paid preparers for their 2020 taxes: 91.0%
Here:
91%
State:
92%
(% for various income ranges: 89.3% for AGIs below $25k, 92.0% for AGIs $25k-50k, 94.1% for AGIs $50k-75k, 88.9% for AGIs $75k-100k, 90.0% for AGIs $100k-200k)
Averages for the 2012 tax year for zip code 15864, filed in 2013:
Average Adjusted Gross Income (AGI) in 2012: $41,156 (Individual Income Tax Returns)
Here:
$41,156
State:
$61,346
Salary/wage: $36,272 (reported on 80.9% of returns)
Here:
$36,272
State:
$51,902
(% of AGI for various income ranges: 73.5% for AGIs below $25k, 80.3% for AGIs $25k-50k, 73.8% for AGIs $50k-75k, 71.9% for AGIs $75k-100k, 54.1% for AGIs $100k-200k)
Taxable interest for individuals: $607 (reported on 32.6% of returns)
This zip code:
$607
Pennsylvania:
$1,588
(% of AGI for various income ranges: 1.5% for AGIs below $25k, 0.3% for AGIs $25k-50k, 0.7% for AGIs $50k-75k, 0.1% for AGIs $75k-100k, 0.3% for AGIs $100k-200k)
Ordinary dividends: $1,422 (reported on 20.2% of returns)
Here:
$1,422
State:
$5,827
(% of AGI for various income ranges: 1.1% for AGIs below $25k, 0.6% for AGIs $25k-50k, 0.8% for AGIs $50k-75k, 0.4% for AGIs $75k-100k, 0.7% for AGIs $100k-200k)
Net capital gain/loss in AGI: +$2,060 (reported on 11.2% of returns)
Here:
+$2,060
State:
+$14,495
(% of AGI for various income ranges: 1.3% for AGIs $50k-75k, 1.1% for AGIs $75k-100k)
Profit/loss from business: +$8,285 (reported on 14.6% of returns)
Here:
+$8,285
State:
+$16,268
(% of AGI for various income ranges: 4.1% for AGIs below $25k, 5.3% for AGIs $25k-50k, 6.2% for AGIs $75k-100k)
Taxable individual retirement arrangement distribution: $8,067 (reported on 13.5% of returns)
15864:
$8,067
Pennsylvania:
$14,550
(% of AGI for various income ranges: 4.0% for AGIs below $25k, 2.4% for AGIs $25k-50k, 2.6% for AGIs $50k-75k, 4.9% for AGIs $75k-100k)
Total itemized deductions: $16,925 (21% of AGI, reported on 13.5% of returns)
Here:
$16,925
State:
$23,538
Here:
21.0% of AGI
State:
18.4% of AGI
(% of AGI for various income ranges: 5.9% for AGIs $25k-50k, 2.9% for AGIs $50k-75k, 7.8% for AGIs $75k-100k, 9.7% for AGIs $100k-200k)
Charity contributions: $5,188 (reported on 9.0% of returns)
Here:
$5,188
State:
$4,025
(% of AGI for various income ranges: 1.3% for AGIs $25k-50k, 1.5% for AGIs $75k-100k, 2.8% for AGIs $100k-200k)
Taxes paid: $4,567 (reported on 13.5% of returns)
15864:
$4,567
State:
$9,982
(% of AGI for various income ranges: 1.0% for AGIs $25k-50k, 0.8% for AGIs $50k-75k, 1.9% for AGIs $75k-100k, 3.6% for AGIs $100k-200k)
Earned income credit: $1,900 (reported on 16.9% of returns)
Here:
$1,900
State:
$2,106
(% of AGI for various income ranges: 4.8% for AGIs below $25k, 1.0% for AGIs $25k-50k)
Percentage of individuals using paid preparers for their 2012 taxes: 59.6%
Here:
60%
State:
53%
(% for various income ranges: 55.6% for AGIs below $25k, 52.0% for AGIs $25k-50k, 66.7% for AGIs $50k-75k, 75.0% for AGIs $75k-100k, 80.0% for AGIs $100k-200k)
Averages for the 2004 tax year for zip code 15864, filed in 2005:
Average Adjusted Gross Income (AGI) in 2004: $33,285 (Individual Income Tax Returns)
Here:
$33,285
State:
$48,049
Salary/wage: $29,619 (reported on 83.2% of returns)
Here:
$29,619
State:
$42,646
(% of AGI for various income ranges: 78.4% for AGIs below $10k, 76.0% for AGIs $10k-25k, 83.2% for AGIs $25k-50k, 77.3% for AGIs $50k-75k, 67.2% for AGIs $75k-100k, 45.0% for AGIs over 100k)
Taxable interest for individuals: $1,083 (reported on 47.0% of returns)
This zip code:
$1,083
Pennsylvania:
$1,657
(% of AGI for various income ranges: 5.3% for AGIs below $10k, 2.5% for AGIs $10k-25k, 1.8% for AGIs $25k-50k, 0.6% for AGIs $50k-75k, 1.4% for AGIs $75k-100k, 1.2% for AGIs over 100k)
Taxable dividends: $1,010 (reported on 23.7% of returns)
Here:
$1,010
State:
$3,566
(% of AGI for various income ranges: 2.1% for AGIs below $10k, 1.2% for AGIs $10k-25k, 0.6% for AGIs $25k-50k, 0.4% for AGIs $50k-75k, 1.4% for AGIs $75k-100k, 0.2% for AGIs over 100k)
Net capital gain/loss: +$2,584 (reported on 15.7% of returns)
Here:
+$2,584
State:
+$9,716
(% of AGI for various income ranges: -2.0% for AGIs below $10k, 0.0% for AGIs $10k-25k, 1.0% for AGIs $25k-50k, 0.5% for AGIs $50k-75k, 2.7% for AGIs $75k-100k, 3.9% for AGIs over 100k)
Profit/loss from business: +$5,693 (reported on 16.1% of returns)
Here:
+$5,693
State:
+$14,267
(% of AGI for various income ranges: 21.0% for AGIs below $10k, 4.2% for AGIs $10k-25k, 0.9% for AGIs $25k-50k, 4.3% for AGIs $50k-75k, 0.5% for AGIs $75k-100k)
IRA payment deduction: $2,208 (reported on 2.8% of returns)
15864:
$2,208
Pennsylvania:
$2,903
Total itemized deductions: $13,352 (21% of AGI, reported on 14.4% of returns)
Here:
$13,352
State:
$18,804
Here:
20.9% of AGI
State:
19.5% of AGI
(% of AGI for various income ranges: 4.4% for AGIs $10k-25k, 4.5% for AGIs $25k-50k, 5.8% for AGIs $50k-75k, 8.3% for AGIs $75k-100k, 9.2% for AGIs over 100k)
Charity contributions deductions: $3,613 (5% of AGI, reported on 10.7% of returns)
Here:
$3,613
State:
$3,337
Here:
5.1% of AGI
State:
3.3% of AGI
(% of AGI for various income ranges: 1.0% for AGIs $25k-50k, 1.0% for AGIs $50k-75k, 1.2% for AGIs $75k-100k, 3.6% for AGIs over 100k)
Total tax: $3,875 (reported on 71.5% of returns)
15864:
$3,875
State:
$8,008
(% of AGI for various income ranges: 4.1% for AGIs below $10k, 4.1% for AGIs $10k-25k, 5.7% for AGIs $25k-50k, 8.9% for AGIs $50k-75k, 10.1% for AGIs $75k-100k, 17.8% for AGIs over 100k)
Earned income credit: $1,672 (reported on 14.0% of returns)
Here:
$1,672
State:
$1,643
Percentage of individuals using paid preparers for their 2004 taxes: 65.0%
Here:
65%
State:
56%
(% for various income ranges: 65.1% for AGIs below $10k, 65.3% for AGIs $10k-25k, 62.8% for AGIs $25k-50k, 65.7% for AGIs $50k-75k, 61.2% for AGIs $75k-100k, 90.5% for AGIs over 100k)
Likely homosexual households (counted as self-reported same-sex unmarried-partner households)
Lesbian couples: 0.0% of all households
Gay men: 0.4% of all households
Household received Food Stamps/SNAP in the past 12 months: 75 Household did not receive Food Stamps/SNAP in the past 12 months: 656
Women who had a birth in the past 12 months: 10 (8 now married, 1 unmarried) Women who did not have a birth in the past 12 months: 391 (204 now married, 185 unmarried)
Housing units in zip code 15864 with a mortgage: 235 (29 second mortgage, 27 both second mortgage and home equity loan) Houses without a mortgage: 21
Median monthly owner costs for units with a mortgage: $1,041 Median monthly owner costs for units without a mortgage: $455
Residents with income below the poverty level in 2022:
This zip code:
9.8%
Whole state:
11.8%
Residents with income below 50% of the poverty level in 2022:
This zip code:
7.4%
Whole state:
6.1%
Median number of rooms in houses and condos:
Here:
6.7
State:
6.8
Median number of rooms in apartments:
Here:
7.7
State:
4.3
Notable locations in this zip code not listed on our city pages
Notable locations in zip code 15864: Heidrich Scales Station (A), Sutton Station (B), Summerville Volunteer Firemens Association / Summerville Emergency Medical Services (C), Shaffer's Greenhouse (D). Display/hide their locations on the map
Churches in zip code 15864 include: Pleasant Hill Chapel (A), Cliff Church (B), Mount Pleasant Church (C), Pine Valley Church (D). Display/hide their locations on the map
Cemeteries: Vandervort Cemetery (1), Westview Cemetery (2), Calvary Cemetery (3), Coolspring Cemeteries (4), Carrier Cemetery (5), Conifer Cemetery (6). Display/hide their locations on the map
In group quarters: 76 (-1 institutionalized population)
Size of family households: 268 2-persons, 67 3-persons, 105 4-persons, 45 5-persons, 11 6-persons, 10 7-or-more-persons
Size of nonfamily households: 193 1-person, 25 2-persons, 4 3-persons
312 married couples with children.
53 single-parent households (10 men, 43 women).
97.2% of residents of 15864 zip code speak English at home.
1.2% of residents speak Spanish at home (29% very well, 29% well, 43% not well).
1.3% of residents speak other Indo-European language at home (100% very well).
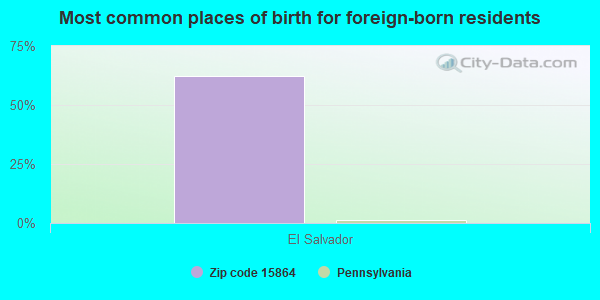
Foreign born population: 8 (0.4%) (25.8% of them are naturalized citizens)
This zip code:
0.4%
Whole state:
7.5%
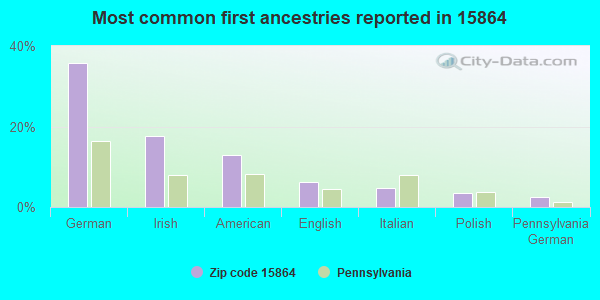
62%El Salvador
36%German
18%Irish
13%American
6%English
5%Italian
4%Polish
2%Pennsylvania German
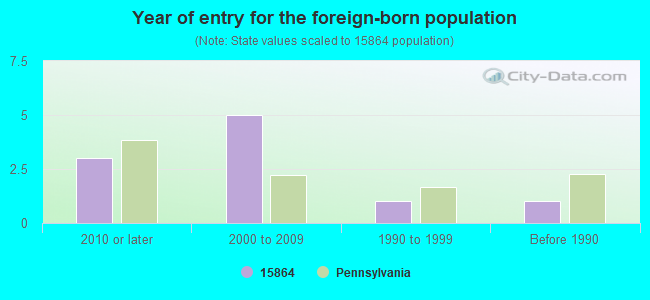
Year of entry for the foreign-born population
32010 or later
52000 to 2009
11990 to 1999
1Before 1990
Housing units lacking complete plumbing facilities: 4.0% Housing units lacking complete kitchen facilities: 5.1%
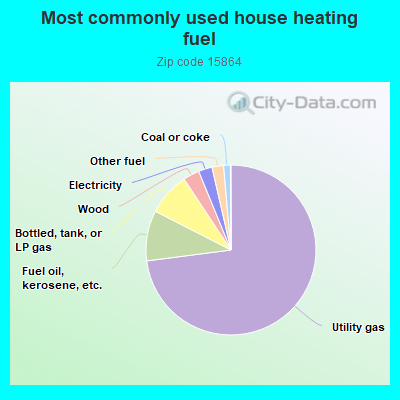
73.1%Utility gas
9.6%Fuel oil, kerosene, etc.
8.2%Bottled, tank, or LP gas
3.1%Wood
2.6%Electricity
2.2%Other fuel
1.3%Coal or coke
Population in 1990: 1,749. Population change in the 1990s: +189 (+10.8%).
Place of birth for U.S.-born residents:
This state: 1,658
Northeast: 68
Midwest: 72
South: 29
West: 24
76% of the 15864 zip code residents lived in the same house 5 years ago. Out of people who lived in different houses, 56% lived in this county. Out of people who lived in different counties, 50% lived in Pennsylvania.
95% of the 15864 zip code residents lived in the same house 1 year ago. Out of people who lived in different houses, 69% moved from this county. Out of people who lived in different houses, 29% moved from different county within same state. Out of people who lived in different houses, 3% moved from different state.
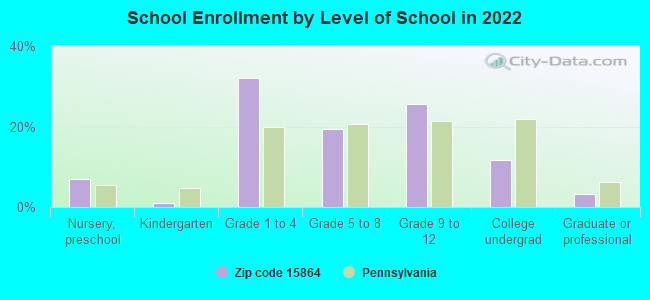
Private vs. public school enrollment:
Students in private schools in grades 1 to 8 (elementary and middle school): 18
Here:
10.1%
Pennsylvania:
15.7%
Students in private schools in grades 9 to 12 (high school): 21
Here:
22.3%
Pennsylvania:
13.4%
Students in private undergraduate colleges: 8
Here:
21.1%
Pennsylvania:
39.8%
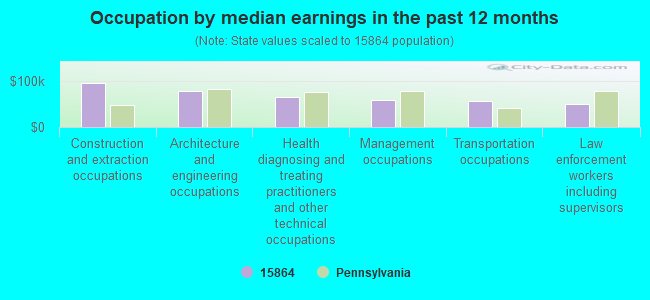
Occupation by median earnings in the past 12 months ($)
96,068Construction and extraction occupations
77,877Architecture and engineering occupations
66,019Health diagnosing and treating practitioners and other technical occupations
59,410Management occupations
57,090Transportation occupations
50,692Law enforcement workers including supervisors
Top industries in this zip code by the number of employees in 2005:


 Nearest zip codes: 15829, 16240, 15784, 16224, 15730, 15770.