Estimated zip code population in 2022: 2,394 Zip code population in 2010: 2,049 Zip code population in 2000: 2,501
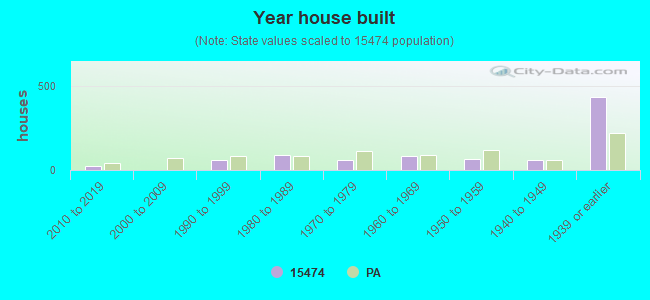
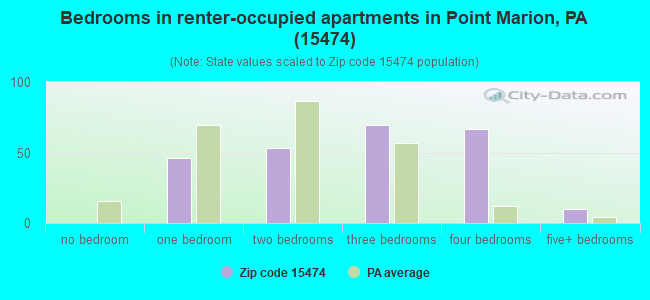
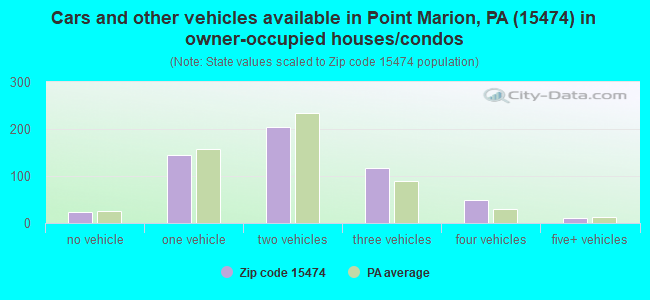
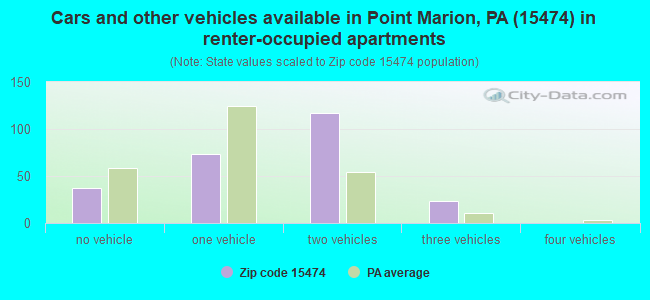
Houses and condos: 898 Renter-occupied apartments: 251
% of renters here:
31%
State:
31%
March 2022 cost of living index in zip code 15474: 88.5 (less than average, U.S. average is 100)
Land area: 7.0 sq. mi. Water area: 0.4 sq. mi.
Population density: 341 people per square mile
(very low).
OSM Map
General Map
Google Map
MSN Map
OSM Map
General Map
Google Map
MSN Map
OSM Map
General Map
Google Map
MSN Map
OSM Map
General Map
Google Map
MSN Map
Please wait while loading the map...
Real estate property taxes paid for housing units in 2022:
This zip code:
0.9% ($1,108)
Pennsylvania:
1.3% ($3,094)
Median real estate property taxes paid for housing units with mortgages in 2022: $1,444 (1.0%) Median real estate property taxes paid for housing units with no mortgage in 2022: $933 (1.1%)
Business Search- 14 Million verified businesses
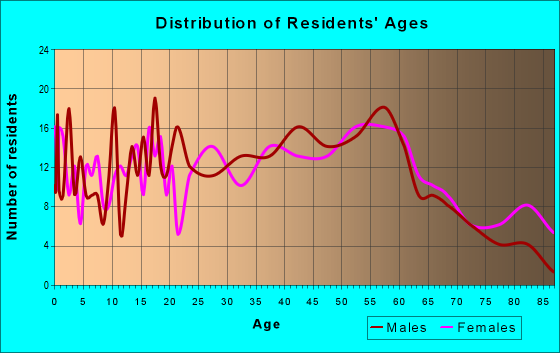
Males: 1,129
(47.1%)
Females: 1,265
(52.9%)
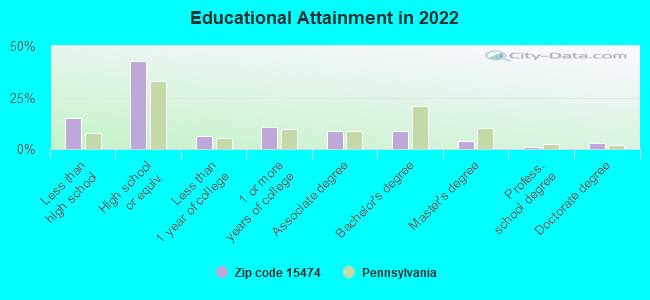
For population 25 years and over in 15474:
High school or higher: 82.7%
Bachelor's degree or higher: 16.2%
Graduate or professional degree: 7.8%
Unemployed: 4.2%
Mean travel time to work (commute): 28.7 minutes
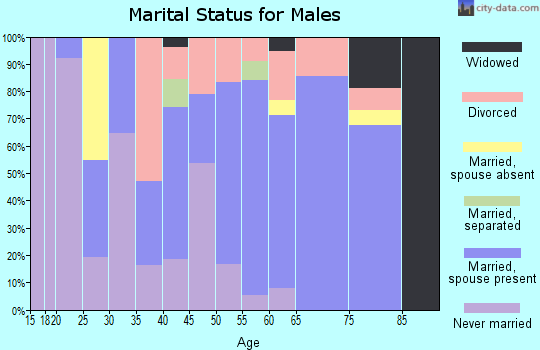
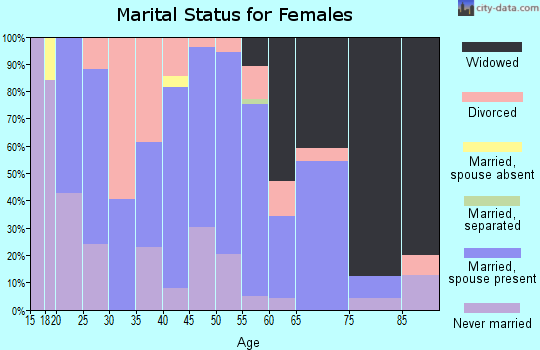
For population 15 years and over in 15474:
Never married: 33.6%
Now married: 48.3%
Separated: 0.8%
Widowed: 6.9%
Divorced: 10.4%
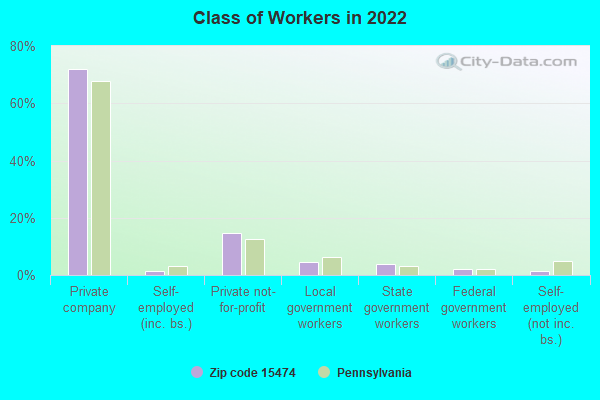
Zip code 15474 compared to state average:
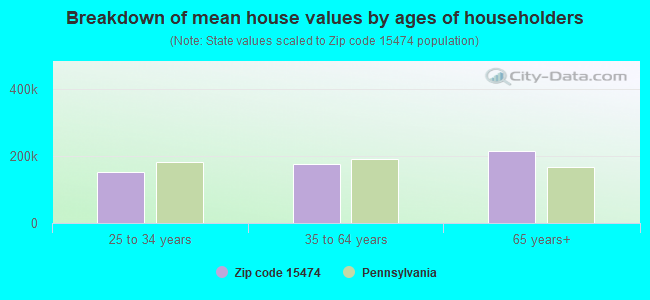
Median house value below state average.
Black race population percentage significantly below state average.
Median age below state average.
Foreign-born population percentage significantly below state average.
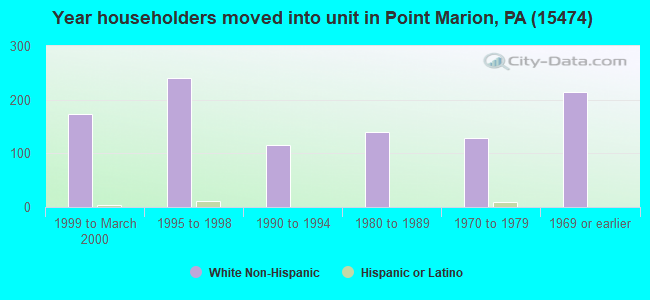
Length of stay since moving in significantly above state average.
Percentage of population with a bachelor's degree or higher significantly below state average.
Averages for the 2020 tax year for zip code 15474, filed in 2021:
Average Adjusted Gross Income (AGI) in 2020: $44,910 (Individual Income Tax Returns)
Here:
$44,910
State:
$75,707
Salary/wage: $41,374 (reported on 79.5% of returns)
Here:
$41,374
State:
$62,806
(% of AGI for various income ranges: 966.3% for AGIs below $25k, 2963.2% for AGIs $25k-50k, 5687.0% for AGIs $50k-75k, 8654.0% for AGIs $75k-100k, 16366.7% for AGIs $100k-200k)
Taxable interest for individuals: $482 (reported on 19.3% of returns)
This zip code:
$482
Pennsylvania:
$1,633
(% of AGI for various income ranges: 7.4% for AGIs below $25k, 8.2% for AGIs $25k-50k, 18.0% for AGIs $50k-75k, 12.0% for AGIs $75k-100k, 33.3% for AGIs $100k-200k)
Ordinary dividends: $1,288 (reported on 9.1% of returns)
Here:
$1,288
State:
$7,382
(% of AGI for various income ranges: 26.4% for AGIs $25k-50k, 90.0% for AGIs $75k-100k)
Net capital gain/loss in AGI: +$3,743 (reported on 8.0% of returns)
Here:
+$3,743
State:
+$23,522
(% of AGI for various income ranges: 37.7% for AGIs $25k-50k, 358.0% for AGIs $75k-100k)
Profit/loss from business: +$5,286 (reported on 8.0% of returns)
Here:
+$5,286
State:
+$16,274
(% of AGI for various income ranges: 119.6% for AGIs below $25k, 47.0% for AGIs $50k-75k)
Taxable individual retirement arrangement distribution: $8,943 (reported on 8.0% of returns)
15474:
$8,943
Pennsylvania:
$18,583
(% of AGI for various income ranges: 129.1% for AGIs $25k-50k, 342.0% for AGIs $50k-75k)
Earned income credit: $1,971 (reported on 19.3% of returns)
Here:
$1,971
State:
$2,100
(% of AGI for various income ranges: 80.7% for AGIs below $25k, 53.2% for AGIs $25k-50k)
Percentage of individuals using paid preparers for their 2020 taxes: 94.3%
Here:
94%
State:
92%
(% for various income ranges: 91.2% for AGIs below $25k, 96.2% for AGIs $25k-50k, 100.0% for AGIs $50k-75k, 100.0% for AGIs $75k-100k, 88.9% for AGIs $100k-200k)
Averages for the 2012 tax year for zip code 15474, filed in 2013:
Average Adjusted Gross Income (AGI) in 2012: $39,175 (Individual Income Tax Returns)
Here:
$39,175
State:
$61,346
Salary/wage: $38,137 (reported on 82.0% of returns)
Here:
$38,137
State:
$51,902
(% of AGI for various income ranges: 74.6% for AGIs below $25k, 75.3% for AGIs $25k-50k, 82.9% for AGIs $50k-75k, 84.5% for AGIs $75k-100k, 81.3% for AGIs $100k-200k)
Taxable interest for individuals: $714 (reported on 23.6% of returns)
This zip code:
$714
Pennsylvania:
$1,588
(% of AGI for various income ranges: 1.0% for AGIs below $25k, 0.4% for AGIs $25k-50k, 0.4% for AGIs $50k-75k, 0.2% for AGIs $75k-100k, 0.3% for AGIs $100k-200k)
Ordinary dividends: $1,133 (reported on 10.1% of returns)
Here:
$1,133
State:
$5,827
Net capital gain/loss in AGI: +$175 (reported on 4.5% of returns)
Here:
+$175
State:
+$14,495
Profit/loss from business: +$7,378 (reported on 10.1% of returns)
Here:
+$7,378
State:
+$16,268
(% of AGI for various income ranges: 5.9% for AGIs below $25k, 2.5% for AGIs $25k-50k, 2.4% for AGIs $50k-75k)
Taxable individual retirement arrangement distribution: $5,950 (reported on 6.7% of returns)
15474:
$5,950
Pennsylvania:
$14,550
Total itemized deductions: $15,900 (19% of AGI, reported on 7.9% of returns)
Here:
$15,900
State:
$23,538
Here:
19.2% of AGI
State:
18.4% of AGI
(% of AGI for various income ranges: 5.2% for AGIs below $25k, 7.2% for AGIs $50k-75k, 3.9% for AGIs $100k-200k)
Charity contributions: $3,500 (reported on 4.5% of returns)
Here:
$3,500
State:
$4,025
(% of AGI for various income ranges: 0.7% for AGIs $25k-50k, 1.4% for AGIs $75k-100k)
Taxes paid: $4,857 (reported on 7.9% of returns)
15474:
$4,857
State:
$9,982
(% of AGI for various income ranges: 0.9% for AGIs below $25k, 1.1% for AGIs $50k-75k, 3.5% for AGIs $75k-100k)
Earned income credit: $2,284 (reported on 21.3% of returns)
Here:
$2,284
State:
$2,106
(% of AGI for various income ranges: 7.0% for AGIs below $25k, 1.1% for AGIs $25k-50k)
Percentage of individuals using paid preparers for their 2012 taxes: 46.1%
Here:
46%
State:
53%
(% for various income ranges: 42.9% for AGIs below $25k, 47.6% for AGIs $25k-50k, 50.0% for AGIs $50k-75k, 42.9% for AGIs $75k-100k, 57.1% for AGIs $100k-200k)
Averages for the 2004 tax year for zip code 15474, filed in 2005:
Average Adjusted Gross Income (AGI) in 2004: $30,586 (Individual Income Tax Returns)
Here:
$30,586
State:
$48,049
Salary/wage: $28,880 (reported on 82.0% of returns)
Here:
$28,880
State:
$42,646
(% of AGI for various income ranges: 73.4% for AGIs below $10k, 75.4% for AGIs $10k-25k, 77.4% for AGIs $25k-50k, 84.4% for AGIs $50k-75k, 82.1% for AGIs $75k-100k, 60.2% for AGIs over 100k)
Taxable interest for individuals: $1,848 (reported on 35.7% of returns)
This zip code:
$1,848
Pennsylvania:
$1,657
(% of AGI for various income ranges: 5.0% for AGIs below $10k, 4.1% for AGIs $10k-25k, 2.1% for AGIs $25k-50k, 1.4% for AGIs $50k-75k, 0.7% for AGIs $75k-100k, 2.1% for AGIs over 100k)
Taxable dividends: $835 (reported on 15.7% of returns)
Here:
$835
State:
$3,566
(% of AGI for various income ranges: 1.1% for AGIs below $10k, 0.4% for AGIs $10k-25k, 0.6% for AGIs $25k-50k, 0.2% for AGIs $50k-75k, 0.4% for AGIs $75k-100k, 0.2% for AGIs over 100k)
Net capital gain/loss: +$377 (reported on 8.7% of returns)
Here:
+$377
State:
+$9,716
(% of AGI for various income ranges: -1.0% for AGIs below $10k, 0.4% for AGIs $25k-50k, -0.2% for AGIs $50k-75k, 0.8% for AGIs over 100k)
Profit/loss from business: +$9,265 (reported on 11.6% of returns)
Here:
+$9,265
State:
+$14,267
(% of AGI for various income ranges: 12.0% for AGIs below $10k, 4.2% for AGIs $10k-25k, 3.5% for AGIs $25k-50k, 1.4% for AGIs $50k-75k, 6.0% for AGIs $75k-100k)
IRA payment deduction: $1,846 (reported on 1.5% of returns)
15474:
$1,846
Pennsylvania:
$2,903
Total itemized deductions: $13,321 (22% of AGI, reported on 9.5% of returns)
Here:
$13,321
State:
$18,804
Here:
21.7% of AGI
State:
19.5% of AGI
(% of AGI for various income ranges: 5.4% for AGIs $25k-50k, 3.8% for AGIs $50k-75k, 6.8% for AGIs $75k-100k, 5.4% for AGIs over 100k)
Charity contributions deductions: $2,564 (4% of AGI, reported on 6.2% of returns)
Here:
$2,564
State:
$3,337
Here:
3.7% of AGI
State:
3.3% of AGI
Total tax: $3,772 (reported on 69.4% of returns)
15474:
$3,772
State:
$8,008
(% of AGI for various income ranges: 2.7% for AGIs below $10k, 3.9% for AGIs $10k-25k, 6.6% for AGIs $25k-50k, 8.8% for AGIs $50k-75k, 12.4% for AGIs $75k-100k, 18.0% for AGIs over 100k)
Earned income credit: $1,742 (reported on 21.5% of returns)
Here:
$1,742
State:
$1,643
Percentage of individuals using paid preparers for their 2004 taxes: 49.9%
Here:
50%
State:
56%
(% for various income ranges: 43.9% for AGIs below $10k, 48.8% for AGIs $10k-25k, 56.3% for AGIs $25k-50k, 47.9% for AGIs $50k-75k, 54.9% for AGIs $75k-100k, 50.0% for AGIs over 100k)
Household received Food Stamps/SNAP in the past 12 months: 234 Household did not receive Food Stamps/SNAP in the past 12 months: 576
Women who had a birth in the past 12 months: 30 (21 now married, 8 unmarried) Women who did not have a birth in the past 12 months: 520 (217 now married, 302 unmarried)
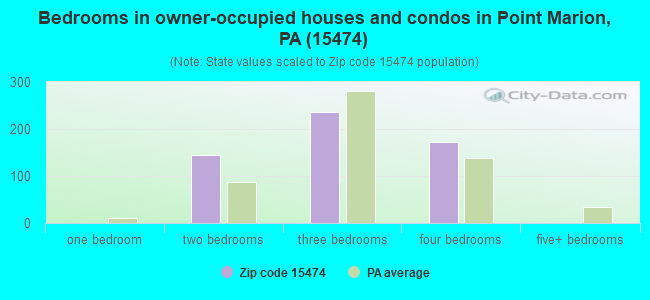
Housing units in zip code 15474 with a mortgage: 190 (33 second mortgage, 2 home equity loan, 26 both second mortgage and home equity loan) Houses without a mortgage: 8
Median monthly owner costs for units with a mortgage: $1,092 Median monthly owner costs for units without a mortgage: $431
Residents with income below the poverty level in 2022:
This zip code:
18.7%
Whole state:
11.8%
Residents with income below 50% of the poverty level in 2022:
This zip code:
11.7%
Whole state:
6.1%
Median number of rooms in houses and condos:
Here:
6.9
State:
6.8
Median number of rooms in apartments:
Here:
5.9
State:
4.3
Notable locations in this zip code not listed on our city pages
Cemeteries: Cagey Cemetery (1), Evergreen Memorial Park (2), Mount Moriah Cemetery (3), Point Marion Cemetery (4), Cedar Grove Cemetery (5). Display/hide their locations on the map
In group quarters: 34 (-1 institutionalized population)
Size of family households: 195 2-persons, 71 3-persons, 81 4-persons, 133 5-persons, 3 6-persons, 63 7-or-more-persons
Size of nonfamily households: 211 1-person, 36 2-persons, 6 3-persons
447 married couples with children.
34 single-parent households (21 men, 13 women).
95.2% of residents of 15474 zip code speak English at home.
3.6% of residents speak Spanish at home (100% very well).
0.3% of residents speak other Indo-European language at home (100% very well).
Foreign born population: 0 (0.0%)
:
0.0%
Whole state:
7.5%
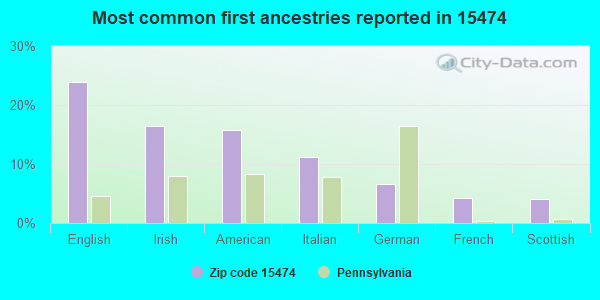
24%English
16%Irish
16%American
11%Italian
7%German
4%French
4%Scottish
Facilities with environmental interests located in this zip code:
ALBERT GALLATIN JR HIGH SCH SOUTH (224 NEW GENEVA ROAD in POINT MARION, PA)
STATE MASTER (Pennsylvania database) - PCS-PA0098400, National Pollutant Discharge Elimination System Permit National Pollutant Discharge Elimination System NON-MAJOR (Tracking pollutant discharge elimination systems) - permit Business SIC classification: ELEMENTARY AND SECONDARY SCHOOLS Organizations: ALBERT GALLATIN AREA SCHOOL DISTRICT (CONTACT/OWNER)
Alternative names: ALBERT GALLATIN AREA SCH DIST, ALBERT GALLATIN SCHOOL DIST
ALBERT GALLATIN SOUTH MS ( in POINT MARION, PA)
(National Center for Education Statistics) - STATE ID-7608 Organizations: ALBERT GALLATIN AREA SD (SCHOOL DISTRICT)
Housing units lacking complete plumbing facilities: 0.6% Housing units lacking complete kitchen facilities: 1.6%
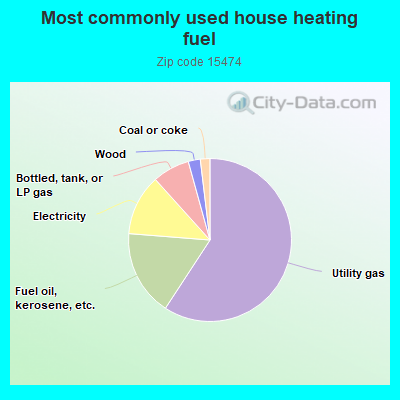
59.4%Utility gas
17.1%Fuel oil, kerosene, etc.
12.1%Electricity
7.4%Bottled, tank, or LP gas
2.4%Wood
1.9%Coal or coke
Population in 1990: 1,474. Population change in the 1990s: +1,027 (+69.7%).
Place of birth for U.S.-born residents:
This state: 1,113
Northeast: 56
Midwest: 85
South: 878
West: 293
63% of the 15474 zip code residents lived in the same house 5 years ago. Out of people who lived in different houses, 67% lived in this county. Out of people who lived in different counties, 50% lived in Pennsylvania.
93% of the 15474 zip code residents lived in the same house 1 year ago. Out of people who lived in different houses, 31% moved from this county. Out of people who lived in different houses, 20% moved from different county within same state. Out of people who lived in different houses, 51% moved from different state.
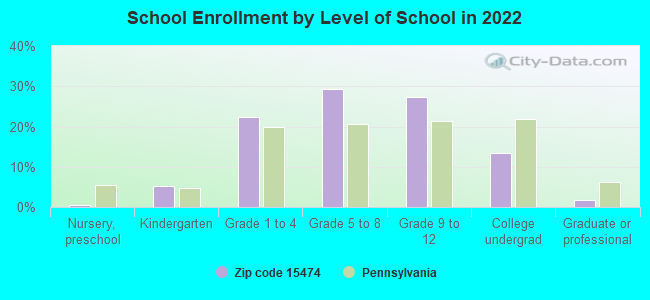
Private vs. public school enrollment:
Students in private schools in grades 1 to 8 (elementary and middle school): 104
Here:
25.4%
Pennsylvania:
15.7%
Students in private schools in grades 9 to 12 (high school): 16
Here:
7.6%
Pennsylvania:
13.4%
Students in private undergraduate colleges: 34
Here:
31.7%
Pennsylvania:
39.8%
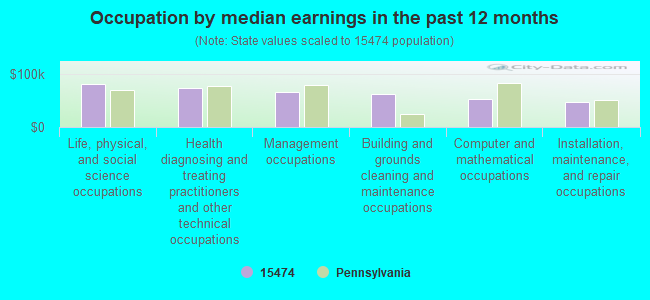
Occupation by median earnings in the past 12 months ($)
81,444Life, physical, and social science occupations
74,667Health diagnosing and treating practitioners and other technical occupations
65,786Management occupations
62,699Building and grounds cleaning and maintenance occupations
53,564Computer and mathematical occupations
47,786Installation, maintenance, and repair occupations
Top industries in this zip code by the number of employees in 2005:
Health Care and Social Assistance: Homes for the Elderly (20-49 employees: 1 establishment)
Accommodation and Food Services: Limited-Service Restaurants (10-19: 1, 5-9: 1)
Finance and Insurance: Commercial Banking (10-19: 1)
Administrative and Support and Waste Management and Remediation Services: Janitorial Services (5-9: 1)
Other Services (except Public Administration): Religious Organizations (1-4: 3)
Accommodation and Food Services: Drinking Places (Alcoholic Beverages) (1-4: 3)
People in group quarters in 2010:
37 people in group homes intended for adults
People in group quarters in 2000:
13 people in other noninstitutional group quarters
Fatal accident statistics in 2013:
Fatal accident count: 1
Vehicles involved in fatal accidents: 2
Fatal accidents caused by drunken drivers: 1
Fatalities: 1
Persons involved in fatal accidents: 3
Pedestrians involved in fatal accidents: 0
Fatal accident statistics in 2012:
Fatal accident count: 1
Vehicles involved in fatal accidents: 2
Fatal accidents caused by drunken drivers: 0
Fatalities: 1
Persons involved in fatal accidents: 3
Pedestrians involved in fatal accidents: 0
Home Mortgage Disclosure Act Aggregated Statistics For Year 2009 (Based on 4 partial tracts)
A) FHA, FSA/RHS & VA Home Purchase Loans
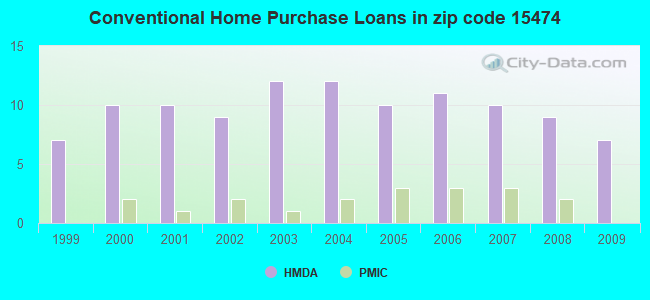
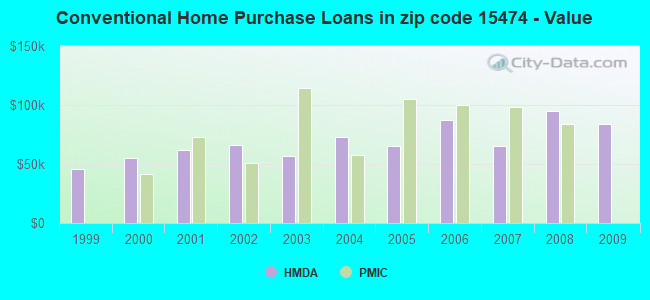
B) Conventional Home Purchase Loans
C) Refinancings
D) Home Improvement Loans
F) Non-occupant Loans on < 5 Family Dwellings (A B C & D)
G) Loans On Manufactured Home Dwelling (A B C & D)
Number
Average Value
Number
Average Value
Number
Average Value
Number
Average Value
Number
Average Value
Number
Average Value
LOANS ORIGINATED
2
$102,705
7
$83,819
15
$99,372
7
$29,250
0
$0
4
$69,122
APPLICATIONS APPROVED, NOT ACCEPTED
0
$0
0
$0
2
$69,780
1
$47,500
0
$0
0
$0
APPLICATIONS DENIED
1
$222,110
2
$53,565
7
$110,449
3
$36,473
0
$0
2
$77,475
APPLICATIONS WITHDRAWN
0
$0
3
$88,560
5
$102,998
1
$11,470
1
$11,140
0
$0
FILES CLOSED FOR INCOMPLETENESS
0
$0
0
$0
2
$178,215
0
$0
0
$0
0
$0
Aggregated Statistics For Year 2008 (Based on 4 partial tracts)
A) FHA, FSA/RHS & VA Home Purchase Loans
B) Conventional Home Purchase Loans
C) Refinancings
D) Home Improvement Loans
F) Non-occupant Loans on < 5 Family Dwellings (A B C & D)
G) Loans On Manufactured Home Dwelling (A B C & D)
Number
Average Value
Number
Average Value
Number
Average Value
Number
Average Value
Number
Average Value
Number
Average Value
LOANS ORIGINATED
2
$93,365
9
$94,531
15
$94,043
8
$28,215
2
$33,415
2
$45,375
APPLICATIONS APPROVED, NOT ACCEPTED
0
$0
2
$54,875
4
$92,710
0
$0
0
$0
2
$54,875
APPLICATIONS DENIED
1
$63,230
3
$87,797
18
$82,173
7
$52,416
1
$59,300
5
$69,844
APPLICATIONS WITHDRAWN
1
$56,020
2
$53,235
2
$134,645
1
$15,720
1
$27,850
0
$0
FILES CLOSED FOR INCOMPLETENESS
0
$0
0
$0
2
$92,220
0
$0
0
$0
0
$0
Aggregated Statistics For Year 2007 (Based on 4 partial tracts)
A) FHA, FSA/RHS & VA Home Purchase Loans
B) Conventional Home Purchase Loans
C) Refinancings
D) Home Improvement Loans
F) Non-occupant Loans on < 5 Family Dwellings (A B C & D)
G) Loans On Manufactured Home Dwelling (A B C & D)
Number
Average Value
Number
Average Value
Number
Average Value
Number
Average Value
Number
Average Value
Number
Average Value
LOANS ORIGINATED
1
$101,880
10
$65,127
14
$61,121
10
$30,237
2
$36,855
3
$77,097
APPLICATIONS APPROVED, NOT ACCEPTED
0
$0
3
$82,447
6
$80,535
2
$44,715
0
$0
3
$42,370
APPLICATIONS DENIED
0
$0
5
$50,582
23
$71,972
10
$44,455
1
$8,190
7
$50,263
APPLICATIONS WITHDRAWN
0
$0
2
$72,070
5
$94,676
2
$36,690
0
$0
0
$0
FILES CLOSED FOR INCOMPLETENESS
0
$0
0
$0
0
$0
0
$0
0
$0
0
$0
Aggregated Statistics For Year 2006 (Based on 4 partial tracts)
A) FHA, FSA/RHS & VA Home Purchase Loans
B) Conventional Home Purchase Loans
C) Refinancings
D) Home Improvement Loans
F) Non-occupant Loans on < 5 Family Dwellings (A B C & D)
G) Loans On Manufactured Home Dwelling (A B C & D)
Number
Average Value
Number
Average Value
Number
Average Value
Number
Average Value
Number
Average Value
Number
Average Value
LOANS ORIGINATED
1
$86,810
11
$87,320
16
$83,251
9
$31,486
2
$43,735
3
$46,520
APPLICATIONS APPROVED, NOT ACCEPTED
0
$0
2
$42,095
5
$60,148
2
$27,845
0
$0
1
$45,540
APPLICATIONS DENIED
0
$0
6
$78,405
34
$72,679
15
$31,078
3
$38,000
10
$63,129
APPLICATIONS WITHDRAWN
0
$0
2
$88,450
13
$87,998
1
$75,020
0
$0
1
$49,140
FILES CLOSED FOR INCOMPLETENESS
0
$0
1
$101,880
3
$94,457
0
$0
0
$0
0
$0
Aggregated Statistics For Year 2005 (Based on 4 partial tracts)
A) FHA, FSA/RHS & VA Home Purchase Loans
B) Conventional Home Purchase Loans
C) Refinancings
D) Home Improvement Loans
F) Non-occupant Loans on < 5 Family Dwellings (A B C & D)
G) Loans On Manufactured Home Dwelling (A B C & D)
Number
Average Value
Number
Average Value
Number
Average Value
Number
Average Value
Number
Average Value
Number
Average Value
LOANS ORIGINATED
1
$75,020
10
$65,258
23
$74,650
9
$26,936
1
$52,090
4
$41,932
APPLICATIONS APPROVED, NOT ACCEPTED
0
$0
3
$47,173
7
$52,323
1
$30,790
0
$0
2
$55,855
APPLICATIONS DENIED
0
$0
11
$44,077
41
$64,985
15
$29,637
3
$31,450
12
$44,226
APPLICATIONS WITHDRAWN
0
$0
0
$0
18
$78,970
2
$88,780
0
$0
2
$49,630
FILES CLOSED FOR INCOMPLETENESS
0
$0
0
$0
2
$128,585
0
$0
0
$0
0
$0
Aggregated Statistics For Year 2004 (Based on 4 partial tracts)
A) FHA, FSA/RHS & VA Home Purchase Loans
B) Conventional Home Purchase Loans
C) Refinancings
D) Home Improvement Loans
F) Non-occupant Loans on < 5 Family Dwellings (A B C & D)
G) Loans On Manufactured Home Dwelling (A B C & D)
Number
Average Value
Number
Average Value
Number
Average Value
Number
Average Value
Number
Average Value
Number
Average Value
LOANS ORIGINATED
1
$43,900
12
$72,700
28
$65,029
9
$28,610
4
$44,390
6
$49,958
APPLICATIONS APPROVED, NOT ACCEPTED
0
$0
2
$68,470
9
$66,758
2
$10,810
0
$0
1
$23,910
APPLICATIONS DENIED
0
$0
12
$61,452
51
$66,663
14
$35,287
4
$39,475
16
$59,602
APPLICATIONS WITHDRAWN
0
$0
4
$56,102
27
$63,761
1
$54,710
1
$76,990
4
$54,462
FILES CLOSED FOR INCOMPLETENESS
0
$0
0
$0
8
$83,784
0
$0
0
$0
0
$0
Aggregated Statistics For Year 2003 (Based on 4 partial tracts)
A) FHA, FSA/RHS & VA Home Purchase Loans
B) Conventional Home Purchase Loans
C) Refinancings
D) Home Improvement Loans
F) Non-occupant Loans on < 5 Family Dwellings (A B C & D)
Number
Average Value
Number
Average Value
Number
Average Value
Number
Average Value
Number
Average Value
LOANS ORIGINATED
2
$56,840
12
$56,457
39
$75,743
7
$22,557
2
$58,970
APPLICATIONS APPROVED, NOT ACCEPTED
0
$0
1
$38,980
9
$74,474
2
$17,525
0
$0
APPLICATIONS DENIED
0
$0
4
$53,070
32
$69,728
7
$20,171
1
$32,430
APPLICATIONS WITHDRAWN
1
$42,920
4
$22,195
28
$65,426
2
$21,130
2
$35,215
FILES CLOSED FOR INCOMPLETENESS
0
$0
1
$35,380
2
$62,735
1
$52,420
0
$0
Aggregated Statistics For Year 2002 (Based on 4 partial tracts)
A) FHA, FSA/RHS & VA Home Purchase Loans
B) Conventional Home Purchase Loans
C) Refinancings
D) Home Improvement Loans
F) Non-occupant Loans on < 5 Family Dwellings (A B C & D)
Number
Average Value
Number
Average Value
Number
Average Value
Number
Average Value
Number
Average Value
LOANS ORIGINATED
1
$48,160
9
$66,030
33
$63,525
8
$14,332
2
$21,460
APPLICATIONS APPROVED, NOT ACCEPTED
0
$0
1
$88,450
9
$61,661
1
$28,830
0
$0
APPLICATIONS DENIED
0
$0
7
$37,954
28
$55,996
3
$9,500
1
$38,000
APPLICATIONS WITHDRAWN
0
$0
3
$63,337
26
$70,207
2
$17,525
0
$0
FILES CLOSED FOR INCOMPLETENESS
0
$0
0
$0
3
$53,070
0
$0
0
$0
Aggregated Statistics For Year 2001 (Based on 4 partial tracts)
A) FHA, FSA/RHS & VA Home Purchase Loans
B) Conventional Home Purchase Loans
C) Refinancings
D) Home Improvement Loans
F) Non-occupant Loans on < 5 Family Dwellings (A B C & D)
Number
Average Value
Number
Average Value
Number
Average Value
Number
Average Value
Number
Average Value
LOANS ORIGINATED
1
$98,940
10
$62,211
23
$60,193
5
$28,304
2
$28,175
APPLICATIONS APPROVED, NOT ACCEPTED
0
$0
3
$45,537
8
$53,645
0
$0
1
$35,050
APPLICATIONS DENIED
0
$0
9
$43,680
29
$58,482
8
$16,216
2
$32,105
APPLICATIONS WITHDRAWN
0
$0
3
$40,077
14
$58,243
2
$10,320
0
$0
FILES CLOSED FOR INCOMPLETENESS
0
$0
0
$0
1
$60,610
0
$0
0
$0
Aggregated Statistics For Year 2000 (Based on 4 partial tracts)
A) FHA, FSA/RHS & VA Home Purchase Loans
B) Conventional Home Purchase Loans
C) Refinancings
D) Home Improvement Loans
F) Non-occupant Loans on < 5 Family Dwellings (A B C & D)
Number
Average Value
Number
Average Value
Number
Average Value
Number
Average Value
Number
Average Value
LOANS ORIGINATED
1
$105,810
10
$55,201
18
$35,508
7
$20,311
2
$23,260
APPLICATIONS APPROVED, NOT ACCEPTED
0
$0
4
$35,790
5
$73,710
3
$24,243
0
$0
APPLICATIONS DENIED
0
$0
15
$37,521
22
$52,014
5
$17,036
2
$36,035
APPLICATIONS WITHDRAWN
0
$0
2
$11,955
10
$43,669
1
$56,020
0
$0
FILES CLOSED FOR INCOMPLETENESS
0
$0
0
$0
2
$58,640
0
$0
0
$0
Aggregated Statistics For Year 1999 (Based on 2 partial tracts)
B) Conventional Home Purchase Loans
C) Refinancings
D) Home Improvement Loans
F) Non-occupant Loans on < 5 Family Dwellings (A B C & D)
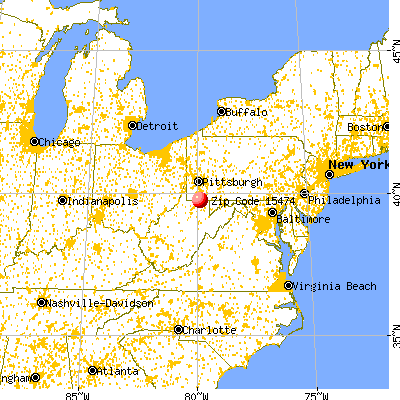


 Nearest zip codes: 15467, 15460, 15451, 15327, 15461, 15315.