Estimated zip code population in 2022: 2,465 Zip code population in 2010: 2,365 Zip code population in 2000: 2,672
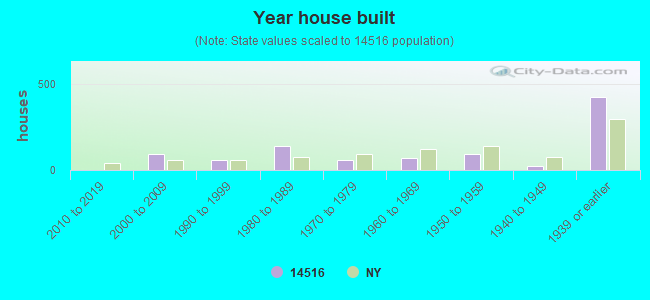
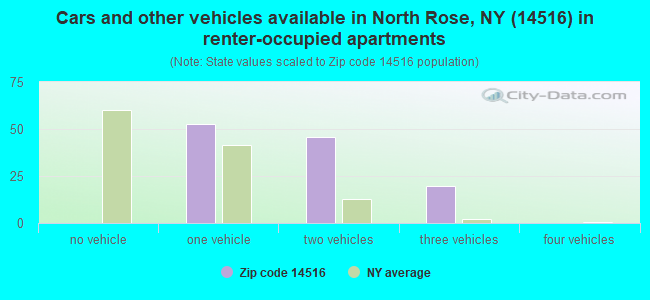
Houses and condos: 982 Renter-occupied apartments: 119
% of renters here:
13%
State:
46%
March 2022 cost of living index in zip code 14516: 94.9 (less than average, U.S. average is 100)
Land area: 28.3 sq. mi. Water area: 1.8 sq. mi.
Population density: 87 people per square mile
(very low).
OSM Map
General Map
Google Map
MSN Map
OSM Map
General Map
Google Map
MSN Map
OSM Map
General Map
Google Map
MSN Map
OSM Map
General Map
Google Map
MSN Map
Please wait while loading the map...
Real estate property taxes paid for housing units in 2022:
This zip code:
1.9% ($2,469)
New York:
1.5% ($6,180)
Median real estate property taxes paid for housing units with mortgages in 2022: $3,194 (2.5%) Median real estate property taxes paid for housing units with no mortgage in 2022: $2,048 (1.6%)
Business Search- 14 Million verified businesses
Males: 1,323
(53.7%)
Females: 1,142
(46.3%)
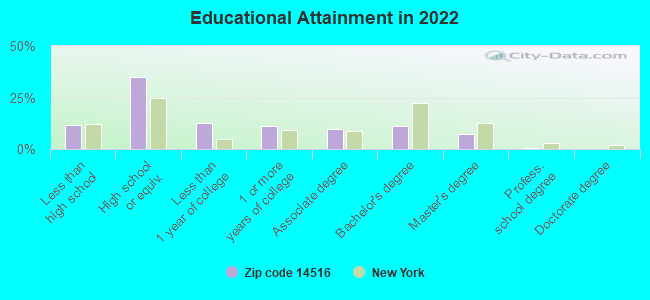
For population 25 years and over in 14516:
High school or higher: 87.3%
Bachelor's degree or higher: 19.3%
Graduate or professional degree: 8.2%
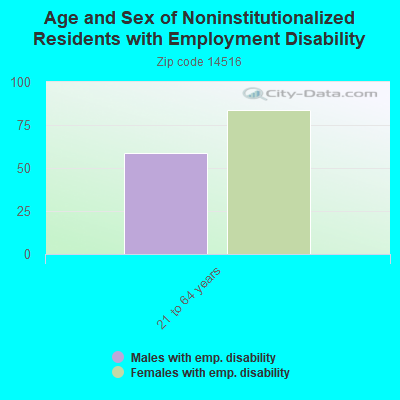
Unemployed: 9.7%
Mean travel time to work (commute): 24.2 minutes
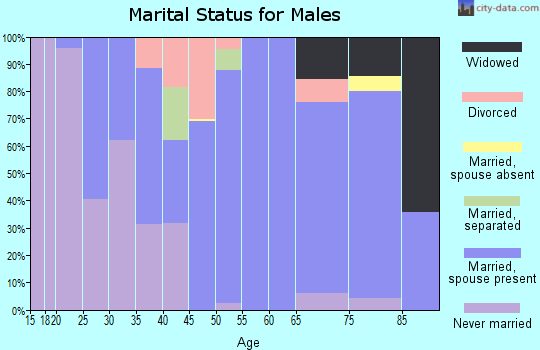
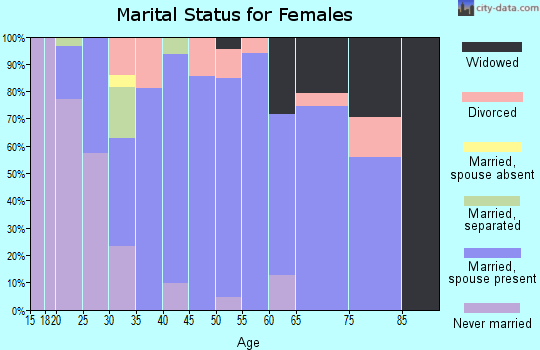
For population 15 years and over in 14516:
Never married: 31.7%
Now married: 48.2%
Separated: 2.8%
Widowed: 9.2%
Divorced: 8.1%
Zip code 14516 compared to state average:
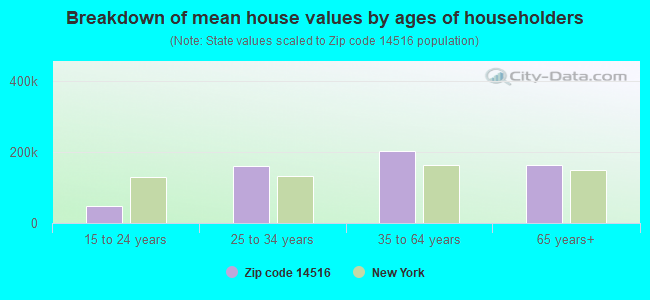
Median house value significantly below state average.
Unemployed percentage above state average.
Black race population percentage below state average.
Hispanic race population percentage significantly below state average.
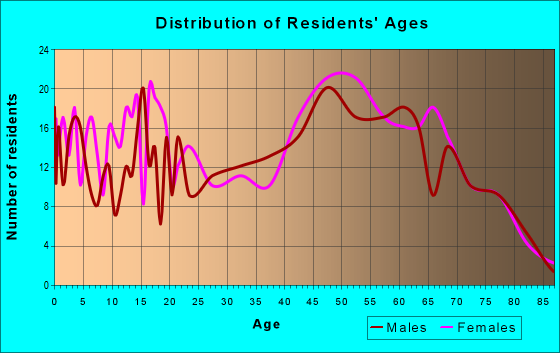
Median age below state average.
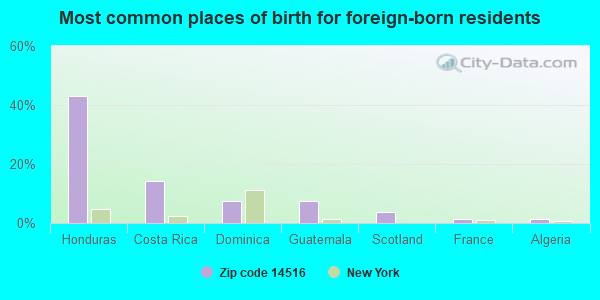
Foreign-born population percentage significantly below state average.
Renting percentage significantly below state average.
Length of stay since moving in significantly above state average.
Number of rooms per house above state average.
Number of college students significantly below state average.
Percentage of population with a bachelor's degree or higher significantly below state average.
Averages for the 2020 tax year for zip code 14516, filed in 2021:
Average Adjusted Gross Income (AGI) in 2020: $59,391 (Individual Income Tax Returns)
Here:
$59,391
State:
$90,930
Salary/wage: $51,483 (reported on 77.9% of returns)
Here:
$51,483
State:
$72,104
(% of AGI for various income ranges: 1248.3% for AGIs below $25k, 3498.3% for AGIs $25k-50k, 6115.4% for AGIs $50k-75k, 8638.6% for AGIs $75k-100k, 18956.7% for AGIs $100k-200k)
Taxable interest for individuals: $598 (reported on 43.3% of returns)
This zip code:
$598
New York:
$3,075
(% of AGI for various income ranges: 10.6% for AGIs below $25k, 12.5% for AGIs $25k-50k, 44.6% for AGIs $50k-75k, 55.7% for AGIs $75k-100k, 88.9% for AGIs $100k-200k)
Ordinary dividends: $3,483 (reported on 17.3% of returns)
Here:
$3,483
State:
$11,095
(% of AGI for various income ranges: 18.3% for AGIs below $25k, 30.0% for AGIs $25k-50k, 50.0% for AGIs $50k-75k, 35.7% for AGIs $75k-100k, 480.0% for AGIs $100k-200k)
Net capital gain/loss in AGI: +$15,759 (reported on 16.3% of returns)
Here:
+$15,759
State:
+$44,925
(% of AGI for various income ranges: 28.9% for AGIs below $25k, 3.8% for AGIs $25k-50k, 68.5% for AGIs $50k-75k, 405.7% for AGIs $75k-100k, 2494.4% for AGIs $100k-200k)
Profit/loss from business: +$8,682 (reported on 10.6% of returns)
Here:
+$8,682
State:
+$14,940
(% of AGI for various income ranges: 230.4% for AGIs $25k-50k, 179.2% for AGIs $50k-75k, 187.8% for AGIs $100k-200k)
Taxable individual retirement arrangement distribution: $19,700 (reported on 13.5% of returns)
14516:
$19,700
New York:
$19,609
(% of AGI for various income ranges: 96.1% for AGIs below $25k, 201.3% for AGIs $25k-50k, 652.3% for AGIs $50k-75k, 1393.3% for AGIs $100k-200k)
Total itemized deductions: $20,900 (reported on 2.9% of returns)
Here:
$20,900
State:
$39,326
(% of AGI for various income ranges: 895.7% for AGIs $75k-100k)
Taxes paid: $8,967 (reported on 2.9% of returns)
14516:
$8,967
State:
$9,183
(% of AGI for various income ranges: 384.3% for AGIs $75k-100k)
Earned income credit: $2,293 (reported on 13.5% of returns)
Here:
$2,293
State:
$2,138
(% of AGI for various income ranges: 92.8% for AGIs below $25k, 64.2% for AGIs $25k-50k)
Percentage of individuals using paid preparers for their 2020 taxes: 94.2%
Here:
94%
State:
95%
(% for various income ranges: 92.9% for AGIs below $25k, 93.8% for AGIs $25k-50k, 100.0% for AGIs $50k-75k, 90.9% for AGIs $75k-100k, 92.9% for AGIs $100k-200k, 100.0% for AGIs over 200k)
Averages for the 2012 tax year for zip code 14516, filed in 2013:
Average Adjusted Gross Income (AGI) in 2012: $49,348 (Individual Income Tax Returns)
Here:
$49,348
State:
$77,088
Salary/wage: $38,560 (reported on 81.7% of returns)
Here:
$38,560
State:
$60,593
(% of AGI for various income ranges: 71.5% for AGIs below $25k, 77.4% for AGIs $25k-50k, 71.2% for AGIs $50k-75k, 70.7% for AGIs $75k-100k, 46.2% for AGIs $100k-200k)
Taxable interest for individuals: $917 (reported on 44.2% of returns)
This zip code:
$917
New York:
$3,125
(% of AGI for various income ranges: 0.8% for AGIs below $25k, 0.7% for AGIs $25k-50k, 0.4% for AGIs $50k-75k, 1.0% for AGIs $75k-100k, 1.0% for AGIs $100k-200k)
Ordinary dividends: $2,729 (reported on 20.2% of returns)
Here:
$2,729
State:
$10,299
(% of AGI for various income ranges: 1.7% for AGIs below $25k, 0.5% for AGIs $25k-50k, 1.5% for AGIs $50k-75k, 1.0% for AGIs $75k-100k, 1.2% for AGIs $100k-200k)
Net capital gain/loss in AGI: +$1,107 (reported on 14.4% of returns)
Here:
+$1,107
State:
+$42,474
(% of AGI for various income ranges: 0.1% for AGIs $25k-50k, 1.6% for AGIs $75k-100k, 0.2% for AGIs $100k-200k)
Profit/loss from business: +$7,382 (reported on 10.6% of returns)
Here:
+$7,382
State:
+$16,168
(% of AGI for various income ranges: 4.0% for AGIs below $25k, 1.0% for AGIs $25k-50k, 2.9% for AGIs $100k-200k)
Taxable individual retirement arrangement distribution: $17,675 (reported on 15.4% of returns)
14516:
$17,675
New York:
$17,621
(% of AGI for various income ranges: 4.7% for AGIs below $25k, 4.7% for AGIs $25k-50k, 5.8% for AGIs $50k-75k, 7.5% for AGIs $75k-100k, 5.1% for AGIs $100k-200k)
Total itemized deductions: $21,246 (22% of AGI, reported on 23.1% of returns)
Here:
$21,246
State:
$34,985
Here:
21.8% of AGI
State:
21.3% of AGI
(% of AGI for various income ranges: 7.7% for AGIs $25k-50k, 8.2% for AGIs $50k-75k, 10.0% for AGIs $75k-100k, 14.9% for AGIs $100k-200k)
Charity contributions: $2,668 (reported on 18.3% of returns)
Here:
$2,668
State:
$5,572
(% of AGI for various income ranges: 0.6% for AGIs $25k-50k, 1.0% for AGIs $50k-75k, 1.0% for AGIs $75k-100k, 1.5% for AGIs $100k-200k)
Taxes paid: $11,000 (reported on 23.1% of returns)
14516:
$11,000
State:
$18,656
(% of AGI for various income ranges: 3.0% for AGIs $25k-50k, 3.8% for AGIs $50k-75k, 5.0% for AGIs $75k-100k, 8.7% for AGIs $100k-200k)
Earned income credit: $2,072 (reported on 17.3% of returns)
Here:
$2,072
State:
$2,230
(% of AGI for various income ranges: 4.7% for AGIs below $25k, 1.3% for AGIs $25k-50k)
Percentage of individuals using paid preparers for their 2012 taxes: 60.6%
Here:
61%
State:
66%
(% for various income ranges: 55.3% for AGIs below $25k, 56.7% for AGIs $25k-50k, 66.7% for AGIs $50k-75k, 70.0% for AGIs $75k-100k, 72.7% for AGIs $100k-200k)
Averages for the 2004 tax year for zip code 14516, filed in 2005:
Average Adjusted Gross Income (AGI) in 2004: $43,305 (Individual Income Tax Returns)
Here:
$43,305
State:
$59,519
Salary/wage: $35,006 (reported on 82.4% of returns)
Here:
$35,006
State:
$50,673
(% of AGI for various income ranges: 119.3% for AGIs below $10k, 69.2% for AGIs $10k-25k, 74.7% for AGIs $25k-50k, 76.1% for AGIs $50k-75k, 74.3% for AGIs $75k-100k, 43.7% for AGIs over 100k)
Taxable interest for individuals: $1,120 (reported on 54.5% of returns)
This zip code:
$1,120
New York:
$2,377
(% of AGI for various income ranges: 6.1% for AGIs below $10k, 2.5% for AGIs $10k-25k, 1.4% for AGIs $25k-50k, 0.6% for AGIs $50k-75k, 0.6% for AGIs $75k-100k, 2.0% for AGIs over 100k)
Taxable dividends: $2,060 (reported on 28.2% of returns)
Here:
$2,060
State:
$5,394
(% of AGI for various income ranges: 4.6% for AGIs below $10k, 1.7% for AGIs $10k-25k, 0.9% for AGIs $25k-50k, 1.0% for AGIs $50k-75k, 0.9% for AGIs $75k-100k, 2.0% for AGIs over 100k)
Net capital gain/loss: +$5,157 (reported on 18.4% of returns)
Here:
+$5,157
State:
+$23,581
(% of AGI for various income ranges: -2.7% for AGIs below $10k, 0.5% for AGIs $10k-25k, -0.2% for AGIs $25k-50k, 0.0% for AGIs $50k-75k, 0.8% for AGIs $75k-100k, 7.7% for AGIs over 100k)
Profit/loss from business: +$5,961 (reported on 9.5% of returns)
Here:
+$5,961
State:
+$13,809
(% of AGI for various income ranges: -7.6% for AGIs below $10k, 2.8% for AGIs $10k-25k, 3.3% for AGIs $25k-50k, 0.3% for AGIs $50k-75k, 1.2% for AGIs over 100k)
IRA payment deduction: $2,357 (reported on 1.3% of returns)
14516:
$2,357
New York:
$3,115
Total itemized deductions: $17,063 (20% of AGI, reported on 28.3% of returns)
Here:
$17,063
State:
$25,864
Here:
20.4% of AGI
State:
21.9% of AGI
(% of AGI for various income ranges: 10.2% for AGIs $10k-25k, 10.5% for AGIs $25k-50k, 10.4% for AGIs $50k-75k, 12.8% for AGIs $75k-100k, 12.3% for AGIs over 100k)
Charity contributions deductions: $2,241 (3% of AGI, reported on 24.0% of returns)
Here:
$2,241
State:
$4,439
Here:
2.6% of AGI
State:
3.6% of AGI
(% of AGI for various income ranges: 1.1% for AGIs $10k-25k, 0.9% for AGIs $25k-50k, 1.4% for AGIs $50k-75k, 2.2% for AGIs $75k-100k, 0.9% for AGIs over 100k)
Total tax: $5,814 (reported on 75.8% of returns)
14516:
$5,814
State:
$11,730
(% of AGI for various income ranges: 2.9% for AGIs below $10k, 3.9% for AGIs $10k-25k, 7.0% for AGIs $25k-50k, 8.7% for AGIs $50k-75k, 10.6% for AGIs $75k-100k, 16.4% for AGIs over 100k)
Earned income credit: $1,623 (reported on 12.9% of returns)
Here:
$1,623
State:
$1,757
Percentage of individuals using paid preparers for their 2004 taxes: 65.9%
Here:
66%
State:
67%
(% for various income ranges: 56.9% for AGIs below $10k, 64.3% for AGIs $10k-25k, 68.1% for AGIs $25k-50k, 70.9% for AGIs $50k-75k, 71.1% for AGIs $75k-100k, 71.0% for AGIs over 100k)
Household received Food Stamps/SNAP in the past 12 months: 137 Household did not receive Food Stamps/SNAP in the past 12 months: 756
Women who had a birth in the past 12 months: 17 (7 now married, 10 unmarried) Women who did not have a birth in the past 12 months: 507 (228 now married, 276 unmarried)
Housing units in zip code 14516 with a mortgage: 381 (32 second mortgage, 3 home equity loan, 29 both second mortgage and home equity loan) Houses without a mortgage: 40
Median monthly owner costs for units with a mortgage: $1,200 Median monthly owner costs for units without a mortgage: $550
Residents with income below the poverty level in 2022:
This zip code:
22.2%
Whole state:
14.3%
Residents with income below 50% of the poverty level in 2022:
This zip code:
6.8%
Whole state:
6.8%
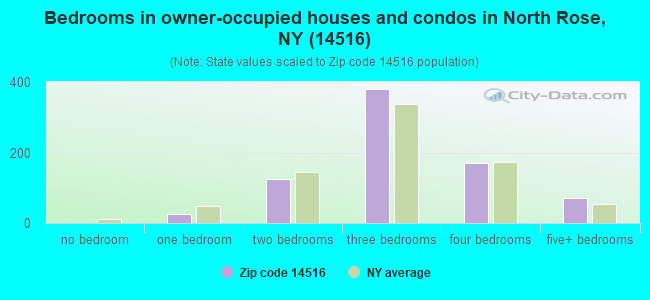
Median number of rooms in houses and condos:
Here:
6.8
State:
6.3
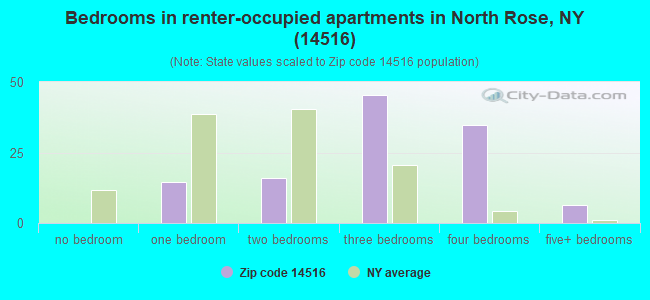
Median number of rooms in apartments:
Here:
7.6
State:
3.8
Notable locations in this zip code not listed on our city pages
Churches in zip code 14516 include: Rose United Methodist Church (A), Alton United Methodist Church (B), Free Methodist Church (C). Display/hide their locations on the map
In group quarters: 220 (-1 institutionalized population)
Size of family households: 244 2-persons, 122 3-persons, 41 4-persons, 92 5-persons, 25 6-persons, 22 7-or-more-persons
Size of nonfamily households: 243 1-person, 100 2-persons, 5 3-persons
466 married couples with children.
114 single-parent households (106 men, 8 women).
94.9% of residents of 14516 zip code speak English at home.
3.5% of residents speak Spanish at home (16% very well, 11% well, 72% not at all).
0.7% of residents speak other Indo-European language at home (100% very well).
0.8% of residents speak other language at home (44% very well, 56% not well).
Foreign born population: 131 (5.3%) (42.3% of them are naturalized citizens)
This zip code:
5.3%
Whole state:
22.7%
43%Honduras
14%Costa Rica
8%Dominica
8%Guatemala
4%Scotland
2%France
2%Algeria
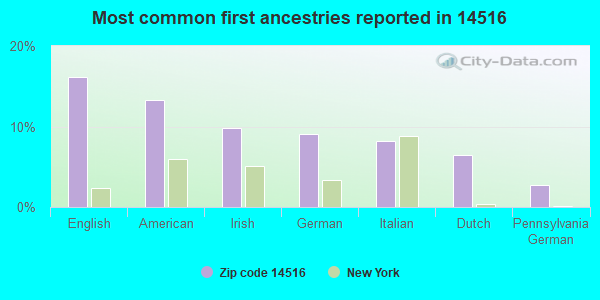
16%English
13%American
10%Irish
9%German
8%Italian
6%Dutch
3%Pennsylvania German
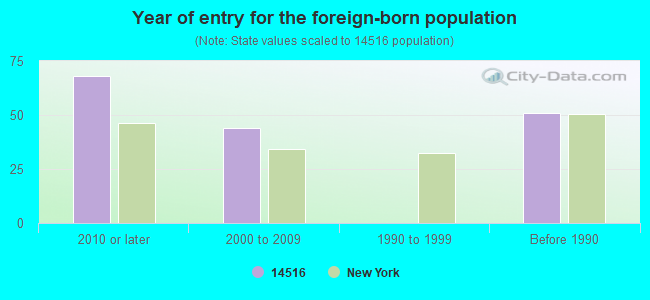
Year of entry for the foreign-born population
682010 or later
442000 to 2009
01990 to 1999
51Before 1990
Facilities with environmental interests located in this zip code:
A.C.D.S. RESEARCH, INC. (9813 GLENMARK ROAD in NORTH ROSE, NY)
ENFORCEMENT/COMPLIANCE ACTIVITY (Integrated Compliance Information System)
Housing units lacking complete kitchen facilities: 1.0%
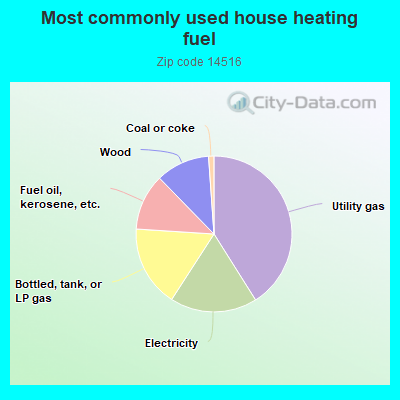
41.1%Utility gas
18.1%Electricity
16.9%Bottled, tank, or LP gas
11.7%Fuel oil, kerosene, etc.
11.2%Wood
1.1%Coal or coke
Population in 1990: 2,428. Population change in the 1990s: +244 (+10.0%).
Place of birth for U.S.-born residents:
This state: 2,004
Northeast: 61
Midwest: 8
South: 186
West: 35
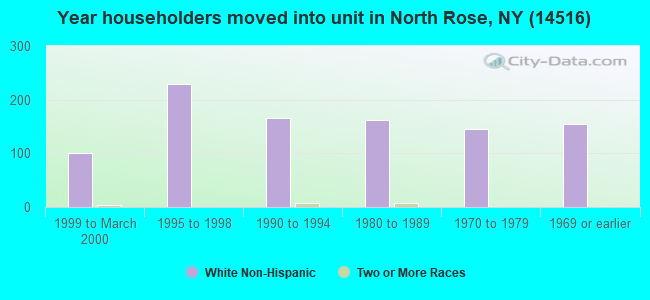
68% of the 14516 zip code residents lived in the same house 5 years ago. Out of people who lived in different houses, 67% lived in this county. Out of people who lived in different counties, 50% lived in New York.
82% of the 14516 zip code residents lived in the same house 1 year ago. Out of people who lived in different houses, 39% moved from this county. Out of people who lived in different houses, 30% moved from different county within same state. Out of people who lived in different houses, 10% moved from different state. Out of people who lived in different houses, 23% moved from abroad.
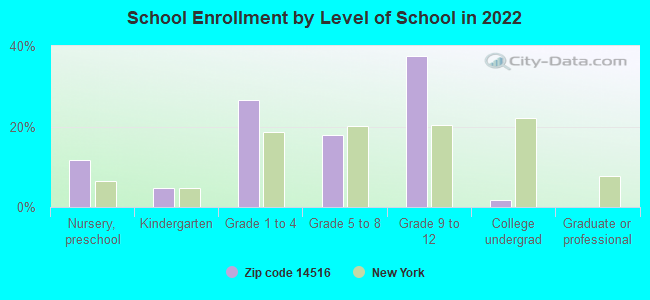
Private vs. public school enrollment:
Students in private schools in grades 1 to 8 (elementary and middle school): 21
Here:
8.0%
New York:
15.6%
Students in private schools in grades 9 to 12 (high school): 92
Here:
39.5%
New York:
15.0%
Students in private undergraduate colleges:
Here:
0.0%
New York:
39.2%
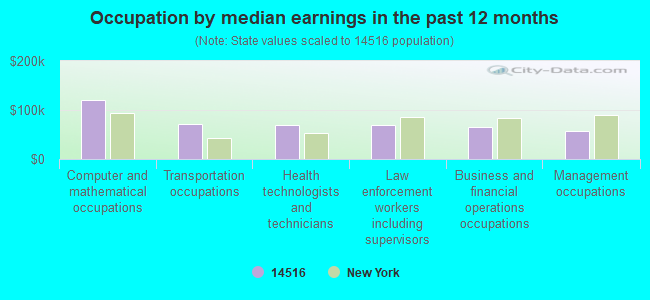
Occupation by median earnings in the past 12 months ($)
119,652Computer and mathematical occupations
71,509Transportation occupations
69,149Health technologists and technicians
69,037Law enforcement workers including supervisors
64,371Business and financial operations occupations
56,163Management occupations
Top industries in this zip code by the number of employees in 2005:
Wholesale Trade: Fresh Fruit and Vegetable Merchant Wholesalers (20-49 employees: 1 establishment, 1-4 employees: 1 establishment)
Health Care and Social Assistance: Child Day Care Services (10-19: 1)
Accommodation and Food Services: Full-Service Restaurants (5-9: 1, 1-4: 1)
People in group quarters in 2010:
6 people in workers' group living quarters and job corps centers
People in group quarters in 2000:
6 people in agriculture workers' dormitories on farms
Fatal accident statistics in 2012:
Fatal accident count: 1
Vehicles involved in fatal accidents: 2
Fatal accidents caused by drunken drivers: 0
Fatalities: 1
Persons involved in fatal accidents: 4
Pedestrians involved in fatal accidents: 0
Fatal accident statistics in 2010:
Fatal accident count: 1
Vehicles involved in fatal accidents: 1
Fatal accidents caused by drunken drivers: 0
Fatalities: 1
Persons involved in fatal accidents: 1
Pedestrians involved in fatal accidents: 0
Home Mortgage Disclosure Act Aggregated Statistics For Year 2009 (Based on 4 partial tracts)
A) FHA, FSA/RHS & VA Home Purchase Loans
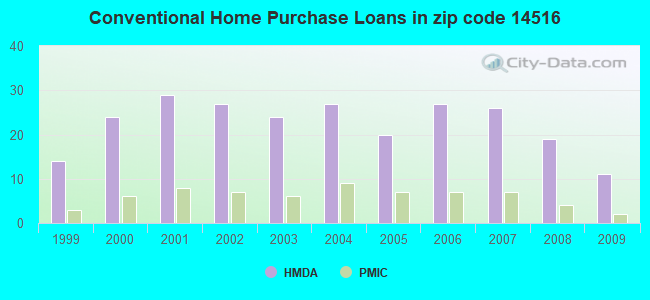
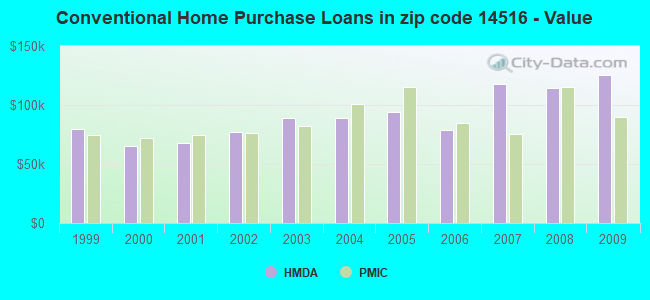
B) Conventional Home Purchase Loans
C) Refinancings
D) Home Improvement Loans
F) Non-occupant Loans on < 5 Family Dwellings (A B C & D)
G) Loans On Manufactured Home Dwelling (A B C & D)
Number
Average Value
Number
Average Value
Number
Average Value
Number
Average Value
Number
Average Value
Number
Average Value
LOANS ORIGINATED
8
$85,579
11
$125,690
33
$102,801
11
$16,051
10
$138,746
3
$72,203
APPLICATIONS APPROVED, NOT ACCEPTED
0
$0
1
$113,360
5
$100,488
0
$0
1
$144,430
0
$0
APPLICATIONS DENIED
3
$73,340
1
$80,090
11
$88,849
11
$13,903
0
$0
2
$29,490
APPLICATIONS WITHDRAWN
1
$164,960
0
$0
4
$92,540
0
$0
0
$0
0
$0
FILES CLOSED FOR INCOMPLETENESS
0
$0
0
$0
1
$40,880
0
$0
0
$0
0
$0
Aggregated Statistics For Year 2008 (Based on 4 partial tracts)
A) FHA, FSA/RHS & VA Home Purchase Loans
B) Conventional Home Purchase Loans
C) Refinancings
D) Home Improvement Loans
F) Non-occupant Loans on < 5 Family Dwellings (A B C & D)
G) Loans On Manufactured Home Dwelling (A B C & D)
Number
Average Value
Number
Average Value
Number
Average Value
Number
Average Value
Number
Average Value
Number
Average Value
LOANS ORIGINATED
6
$63,252
19
$114,659
20
$106,990
23
$20,033
10
$160,067
6
$61,345
APPLICATIONS APPROVED, NOT ACCEPTED
0
$0
2
$225,085
2
$73,585
2
$85,260
2
$154,235
0
$0
APPLICATIONS DENIED
1
$93,510
5
$57,832
27
$107,833
26
$23,784
2
$129,875
6
$52,908
APPLICATIONS WITHDRAWN
0
$0
1
$269,680
12
$83,682
2
$26,945
2
$141,155
0
$0
FILES CLOSED FOR INCOMPLETENESS
0
$0
1
$95,920
1
$68,570
1
$61,660
1
$95,920
0
$0
Aggregated Statistics For Year 2007 (Based on 4 partial tracts)
A) FHA, FSA/RHS & VA Home Purchase Loans
B) Conventional Home Purchase Loans
C) Refinancings
D) Home Improvement Loans
F) Non-occupant Loans on < 5 Family Dwellings (A B C & D)
G) Loans On Manufactured Home Dwelling (A B C & D)
Number
Average Value
Number
Average Value
Number
Average Value
Number
Average Value
Number
Average Value
Number
Average Value
LOANS ORIGINATED
3
$97,890
26
$117,848
30
$82,773
21
$19,553
11
$152,686
5
$62,524
APPLICATIONS APPROVED, NOT ACCEPTED
0
$0
3
$114,137
7
$84,797
2
$47,450
2
$97,285
0
$0
APPLICATIONS DENIED
0
$0
8
$47,574
42
$86,863
18
$22,346
4
$57,045
7
$71,191
APPLICATIONS WITHDRAWN
0
$0
1
$91,430
23
$83,293
3
$64,783
1
$22,350
1
$46,380
FILES CLOSED FOR INCOMPLETENESS
0
$0
1
$23,440
6
$126,072
0
$0
1
$39,230
0
$0
Aggregated Statistics For Year 2006 (Based on 4 partial tracts)
A) FHA, FSA/RHS & VA Home Purchase Loans
B) Conventional Home Purchase Loans
C) Refinancings
D) Home Improvement Loans
F) Non-occupant Loans on < 5 Family Dwellings (A B C & D)
G) Loans On Manufactured Home Dwelling (A B C & D)
Number
Average Value
Number
Average Value
Number
Average Value
Number
Average Value
Number
Average Value
Number
Average Value
LOANS ORIGINATED
3
$121,987
27
$79,014
29
$77,014
17
$23,573
15
$80,510
2
$58,805
APPLICATIONS APPROVED, NOT ACCEPTED
1
$36,520
4
$96,078
6
$70,802
3
$41,757
2
$64,585
2
$57,015
APPLICATIONS DENIED
2
$59,880
5
$94,212
52
$76,685
23
$26,138
5
$69,684
5
$70,222
APPLICATIONS WITHDRAWN
1
$69,820
3
$104,383
28
$91,929
6
$41,907
1
$95,380
0
$0
FILES CLOSED FOR INCOMPLETENESS
0
$0
2
$85,715
9
$94,132
0
$0
2
$59,405
0
$0
Aggregated Statistics For Year 2005 (Based on 4 partial tracts)
A) FHA, FSA/RHS & VA Home Purchase Loans
B) Conventional Home Purchase Loans
C) Refinancings
D) Home Improvement Loans
F) Non-occupant Loans on < 5 Family Dwellings (A B C & D)
G) Loans On Manufactured Home Dwelling (A B C & D)
Number
Average Value
Number
Average Value
Number
Average Value
Number
Average Value
Number
Average Value
Number
Average Value
LOANS ORIGINATED
2
$56,355
20
$94,035
31
$81,722
25
$18,872
11
$113,867
7
$52,420
APPLICATIONS APPROVED, NOT ACCEPTED
1
$56,410
2
$56,130
7
$66,434
2
$23,460
1
$43,600
1
$48,390
APPLICATIONS DENIED
1
$93,090
12
$72,487
53
$74,389
20
$30,443
2
$50,720
5
$52,344
APPLICATIONS WITHDRAWN
1
$29,430
3
$63,033
29
$76,001
6
$57,855
2
$73,695
2
$48,000
FILES CLOSED FOR INCOMPLETENESS
0
$0
3
$102,973
6
$120,942
1
$38,150
1
$93,740
0
$0
Aggregated Statistics For Year 2004 (Based on 4 partial tracts)
A) FHA, FSA/RHS & VA Home Purchase Loans
B) Conventional Home Purchase Loans
C) Refinancings
D) Home Improvement Loans
F) Non-occupant Loans on < 5 Family Dwellings (A B C & D)
G) Loans On Manufactured Home Dwelling (A B C & D)
Number
Average Value
Number
Average Value
Number
Average Value
Number
Average Value
Number
Average Value
Number
Average Value
LOANS ORIGINATED
5
$71,650
27
$88,966
39
$70,012
23
$21,053
11
$99,335
6
$58,893
APPLICATIONS APPROVED, NOT ACCEPTED
0
$0
2
$124,225
9
$86,072
1
$29,190
0
$0
0
$0
APPLICATIONS DENIED
1
$71,570
8
$60,745
55
$74,272
16
$27,385
1
$60,500
9
$41,796
APPLICATIONS WITHDRAWN
0
$0
3
$52,407
34
$84,869
3
$25,750
1
$107,370
3
$65,803
FILES CLOSED FOR INCOMPLETENESS
0
$0
1
$30,750
8
$112,690
1
$28,360
0
$0
0
$0
Aggregated Statistics For Year 2003 (Based on 4 partial tracts)
A) FHA, FSA/RHS & VA Home Purchase Loans
B) Conventional Home Purchase Loans
C) Refinancings
D) Home Improvement Loans
F) Non-occupant Loans on < 5 Family Dwellings (A B C & D)
Number
Average Value
Number
Average Value
Number
Average Value
Number
Average Value
Number
Average Value
LOANS ORIGINATED
7
$72,780
24
$89,297
69
$74,537
16
$13,969
15
$84,861
APPLICATIONS APPROVED, NOT ACCEPTED
0
$0
5
$73,604
13
$71,731
1
$26,400
2
$52,050
APPLICATIONS DENIED
0
$0
7
$64,460
46
$69,816
14
$18,481
2
$60,265
APPLICATIONS WITHDRAWN
0
$0
2
$66,445
33
$73,869
3
$18,273
1
$107,370
FILES CLOSED FOR INCOMPLETENESS
0
$0
0
$0
5
$59,274
0
$0
0
$0
Aggregated Statistics For Year 2002 (Based on 4 partial tracts)
A) FHA, FSA/RHS & VA Home Purchase Loans
B) Conventional Home Purchase Loans
C) Refinancings
D) Home Improvement Loans
F) Non-occupant Loans on < 5 Family Dwellings (A B C & D)
Number
Average Value
Number
Average Value
Number
Average Value
Number
Average Value
Number
Average Value
LOANS ORIGINATED
7
$65,740
27
$76,912
62
$62,978
12
$11,972
10
$74,393
APPLICATIONS APPROVED, NOT ACCEPTED
0
$0
4
$73,708
18
$65,708
1
$2,730
1
$78,480
APPLICATIONS DENIED
1
$58,190
5
$61,444
35
$60,240
12
$15,720
1
$99,570
APPLICATIONS WITHDRAWN
1
$81,170
4
$67,708
29
$74,990
3
$20,770
1
$56,680
FILES CLOSED FOR INCOMPLETENESS
0
$0
0
$0
4
$70,665
0
$0
0
$0
Aggregated Statistics For Year 2001 (Based on 4 partial tracts)
A) FHA, FSA/RHS & VA Home Purchase Loans
B) Conventional Home Purchase Loans
C) Refinancings
D) Home Improvement Loans
F) Non-occupant Loans on < 5 Family Dwellings (A B C & D)
Number
Average Value
Number
Average Value
Number
Average Value
Number
Average Value
Number
Average Value
LOANS ORIGINATED
4
$55,708
29
$67,382
42
$63,166
19
$11,246
9
$75,628
APPLICATIONS APPROVED, NOT ACCEPTED
0
$0
7
$63,220
7
$65,653
3
$9,513
1
$11,450
APPLICATIONS DENIED
1
$73,560
12
$47,260
50
$54,474
11
$13,108
1
$46,960
APPLICATIONS WITHDRAWN
1
$31,170
2
$88,930
32
$64,993
3
$18,397
1
$72,480
FILES CLOSED FOR INCOMPLETENESS
0
$0
1
$39,150
4
$55,122
1
$8,180
0
$0
Aggregated Statistics For Year 2000 (Based on 4 partial tracts)
A) FHA, FSA/RHS & VA Home Purchase Loans
B) Conventional Home Purchase Loans
C) Refinancings
D) Home Improvement Loans
F) Non-occupant Loans on < 5 Family Dwellings (A B C & D)
Number
Average Value
Number
Average Value
Number
Average Value
Number
Average Value
Number
Average Value
LOANS ORIGINATED
6
$65,108
24
$65,307
32
$56,151
22
$14,373
6
$55,937
APPLICATIONS APPROVED, NOT ACCEPTED
1
$68,670
12
$60,362
11
$47,100
6
$11,955
1
$31,500
APPLICATIONS DENIED
1
$47,120
21
$50,574
44
$59,957
14
$13,193
3
$45,917
APPLICATIONS WITHDRAWN
0
$0
4
$46,058
14
$52,132
2
$7,205
0
$0
FILES CLOSED FOR INCOMPLETENESS
0
$0
0
$0
5
$63,668
0
$0
0
$0
Aggregated Statistics For Year 1999 (Based on 2 partial tracts)
A) FHA, FSA/RHS & VA Home Purchase Loans
B) Conventional Home Purchase Loans
C) Refinancings
D) Home Improvement Loans
F) Non-occupant Loans on < 5 Family Dwellings (A B C & D)


 Nearest zip codes: 14542, 14555, 14590, 14433, 14551, 14489.