Estimated zip code population in 2022: 1,225 Zip code population in 2010: 1,189 Zip code population in 2000: 1,341
Houses and condos: 692 Renter-occupied apartments: 89
% of renters here:
17%
State:
46%
March 2022 cost of living index in zip code 13464: 93.8 (less than average, U.S. average is 100)
Land area: 38.3 sq. mi. Water area: 0.1 sq. mi.
Population density: 32 people per square mile
(very low).
OSM Map
General Map
Google Map
MSN Map
OSM Map
General Map
Google Map
MSN Map
OSM Map
General Map
Google Map
MSN Map
OSM Map
General Map
Google Map
MSN Map
Please wait while loading the map...
Real estate property taxes paid for housing units in 2022:
This zip code:
2.9% ($1,960)
New York:
1.5% ($6,180)
Median real estate property taxes paid for housing units with mortgages in 2022: $2,394 (2.7%) Median real estate property taxes paid for housing units with no mortgage in 2022: $1,761 (2.9%)
Business Search- 14 Million verified businesses
Males: 661
(54.0%)
Females: 563
(46.0%)
For population 25 years and over in 13464:
High school or higher: 87.0%
Bachelor's degree or higher: 7.7%
Graduate or professional degree: 2.1%
Unemployed: 5.1%
Mean travel time to work (commute): 18.5 minutes
For population 15 years and over in 13464:
Never married: 25.8%
Now married: 57.0%
Separated: 2.6%
Widowed: 6.0%
Divorced: 8.6%
Zip code 13464 compared to state average:
Median household income below state average.
Median house value significantly below state average.
Black race population percentage significantly below state average.
Hispanic race population percentage significantly below state average.
Median age significantly above state average.
Foreign-born population percentage significantly below state average.
Renting percentage significantly below state average.
Length of stay since moving in significantly above state average.
Number of college students significantly below state average.
Percentage of population with a bachelor's degree or higher significantly below state average.
Averages for the 2020 tax year for zip code 13464, filed in 2021:
Average Adjusted Gross Income (AGI) in 2020: $41,381 (Individual Income Tax Returns)
Here:
$41,381
State:
$90,930
Salary/wage: $38,445 (reported on 83.0% of returns)
Here:
$38,445
State:
$72,104
(% of AGI for various income ranges: 1216.2% for AGIs below $25k, 3405.0% for AGIs $25k-50k, 6615.0% for AGIs $50k-75k, 5175.0% for AGIs $75k-100k)
Taxable interest for individuals: $245 (reported on 20.8% of returns)
This zip code:
$245
New York:
$3,075
(% of AGI for various income ranges: 4.6% for AGIs below $25k, 5.6% for AGIs $25k-50k, 13.3% for AGIs $50k-75k, 6.7% for AGIs $75k-100k)
Ordinary dividends: $2,400 (reported on 9.4% of returns)
Here:
$2,400
State:
$11,095
(% of AGI for various income ranges: 53.1% for AGIs below $25k, 85.0% for AGIs $50k-75k)
Net capital gain/loss in AGI: +$3,350 (reported on 7.5% of returns)
Here:
+$3,350
State:
+$44,925
(% of AGI for various income ranges: 223.3% for AGIs $50k-75k)
Profit/loss from business: +$3,020 (reported on 9.4% of returns)
Here:
+$3,020
State:
+$14,940
(% of AGI for various income ranges: 82.3% for AGIs below $25k, 27.5% for AGIs $25k-50k)
Taxable individual retirement arrangement distribution: $9,867 (reported on 5.7% of returns)
13464:
$9,867
New York:
$19,609
(% of AGI for various income ranges: 227.7% for AGIs below $25k)
Earned income credit: $2,217 (reported on 22.6% of returns)
Here:
$2,217
State:
$2,138
(% of AGI for various income ranges: 106.2% for AGIs below $25k, 80.0% for AGIs $25k-50k)
Percentage of individuals using paid preparers for their 2020 taxes: 96.2%
Here:
96%
State:
95%
(% for various income ranges: 94.4% for AGIs below $25k, 94.7% for AGIs $25k-50k, 100.0% for AGIs $50k-75k, 100.0% for AGIs $75k-100k, 100.0% for AGIs $100k-200k)
Averages for the 2012 tax year for zip code 13464, filed in 2013:
Average Adjusted Gross Income (AGI) in 2012: $34,164 (Individual Income Tax Returns)
Here:
$34,164
State:
$77,088
Salary/wage: $31,968 (reported on 82.0% of returns)
Here:
$31,968
State:
$60,593
(% of AGI for various income ranges: 72.8% for AGIs below $25k, 81.7% for AGIs $25k-50k, 76.5% for AGIs $50k-75k, 160.7% for AGIs $75k-100k)
Taxable interest for individuals: $362 (reported on 26.0% of returns)
This zip code:
$362
New York:
$3,125
(% of AGI for various income ranges: 0.6% for AGIs below $25k, 0.2% for AGIs $25k-50k, 0.4% for AGIs $50k-75k, 0.2% for AGIs $75k-100k)
Ordinary dividends: $1,300 (reported on 14.0% of returns)
Here:
$1,300
State:
$10,299
Net capital gain/loss in AGI: +$1,925 (reported on 8.0% of returns)
Here:
+$1,925
State:
+$42,474
Profit/loss from business: +$6,483 (reported on 12.0% of returns)
Here:
+$6,483
State:
+$16,168
Taxable individual retirement arrangement distribution: $4,375 (reported on 8.0% of returns)
13464:
$4,375
New York:
$17,621
Total itemized deductions: $16,617 (24% of AGI, reported on 12.0% of returns)
Here:
$16,617
State:
$34,985
Here:
24.4% of AGI
State:
21.3% of AGI
Charity contributions: $925 (reported on 8.0% of returns)
Here:
$925
State:
$5,572
Taxes paid: $7,083 (reported on 12.0% of returns)
13464:
$7,083
State:
$18,656
Earned income credit: $2,073 (reported on 22.0% of returns)
Here:
$2,073
State:
$2,230
(% of AGI for various income ranges: 5.1% for AGIs below $25k, 1.6% for AGIs $25k-50k)
Percentage of individuals using paid preparers for their 2012 taxes: 50.0%
Here:
50%
State:
66%
(% for various income ranges: 47.8% for AGIs below $25k, 40.0% for AGIs $25k-50k, 85.7% for AGIs $50k-75k, 100.0% for AGIs $100k-200k)
Averages for the 2004 tax year for zip code 13464, filed in 2005:
Average Adjusted Gross Income (AGI) in 2004: $32,026 (Individual Income Tax Returns)
Here:
$32,026
State:
$59,519
Salary/wage: $29,048 (reported on 85.1% of returns)
Here:
$29,048
State:
$50,673
(% of AGI for various income ranges: 86.9% for AGIs below $10k, 74.4% for AGIs $10k-25k, 86.1% for AGIs $25k-50k, 82.7% for AGIs $50k-75k, 77.1% for AGIs $75k-100k, 49.3% for AGIs over 100k)
Taxable interest for individuals: $611 (reported on 38.8% of returns)
This zip code:
$611
New York:
$2,377
(% of AGI for various income ranges: 0.8% for AGIs below $10k, 1.7% for AGIs $10k-25k, 0.2% for AGIs $25k-50k, 1.0% for AGIs $50k-75k, 0.1% for AGIs $75k-100k, 0.6% for AGIs over 100k)
Taxable dividends: $697 (reported on 16.4% of returns)
Here:
$697
State:
$5,394
(% of AGI for various income ranges: 0.7% for AGIs $10k-25k, 0.3% for AGIs $25k-50k, 0.3% for AGIs $50k-75k, 0.4% for AGIs $75k-100k)
Net capital gain/loss: +$3,123 (reported on 12.3% of returns)
Here:
+$3,123
State:
+$23,581
(% of AGI for various income ranges: 2.3% for AGIs below $10k, 0.5% for AGIs $10k-25k, 0.3% for AGIs $25k-50k, -0.0% for AGIs $50k-75k, 7.8% for AGIs $75k-100k)
Profit/loss from business: +$6,000 (reported on 9.9% of returns)
Here:
+$6,000
State:
+$13,809
Profit/loss from farming: +$5,706 (reported on 3.7% of returns)
Here:
+$5,706
State:
-$2,666
Total itemized deductions: $13,931 (19% of AGI, reported on 12.5% of returns)
Here:
$13,931
State:
$25,864
Here:
19.1% of AGI
State:
21.9% of AGI
Charity contributions deductions: $1,578 (2% of AGI, reported on 9.7% of returns)
Here:
$1,578
State:
$4,439
Here:
2.1% of AGI
State:
3.6% of AGI
Total tax: $3,976 (reported on 71.6% of returns)
13464:
$3,976
State:
$11,730
(% of AGI for various income ranges: 4.1% for AGIs below $10k, 4.3% for AGIs $10k-25k, 5.5% for AGIs $25k-50k, 9.1% for AGIs $50k-75k, 12.9% for AGIs $75k-100k, 18.6% for AGIs over 100k)
Earned income credit: $1,683 (reported on 22.4% of returns)
Here:
$1,683
State:
$1,757
Percentage of individuals using paid preparers for their 2004 taxes: 61.6%
Here:
62%
State:
67%
(% for various income ranges: 55.3% for AGIs below $10k, 63.7% for AGIs $10k-25k, 63.2% for AGIs $25k-50k, 56.7% for AGIs $50k-75k, 72.7% for AGIs $75k-100k, 83.3% for AGIs over 100k)
Likely homosexual households (counted as self-reported same-sex unmarried-partner households)
Lesbian couples: 0.4% of all households
Gay men: 0.0% of all households
Household received Food Stamps/SNAP in the past 12 months: 145 Household did not receive Food Stamps/SNAP in the past 12 months: 395
Women who had a birth in the past 12 months: 3 (3 now married, 0 unmarried) Women who did not have a birth in the past 12 months: 148 (52 now married, 95 unmarried)
Housing units in zip code 13464 with a mortgage: 135 (10 second mortgage, 10 both second mortgage and home equity loan) Median monthly owner costs for units with a mortgage: $810 Median monthly owner costs for units without a mortgage: $444
Residents with income below the poverty level in 2022:
This zip code:
15.6%
Whole state:
14.3%
Residents with income below 50% of the poverty level in 2022:
This zip code:
3.4%
Whole state:
6.8%
Median number of rooms in houses and condos:
Here:
5.3
State:
6.3
Median number of rooms in apartments:
Here:
6.2
State:
3.8
Notable locations in this zip code not listed on our city pages
Churches in zip code 13464 include: Smyrna Baptist Church (A), Smyrna United Methodist Church (B), West Smyrna Baptist Church (C). Display/hide their locations on the map
Cemeteries: Stover Cemetery (1), Bonney Cemetery (2), Smyrna East Cemetery (3), West End Cemetery (4), Reynolds Cemetery (5). Display/hide their locations on the map
Size of family households: 210 2-persons, 33 3-persons, 67 4-persons, 21 5-persons, 30 6-persons
Size of nonfamily households: 161 1-person, 8 2-persons
46 married couples with children.
89 single-parent households (18 men, 71 women).
97.6% of residents of 13464 zip code speak English at home.
1.3% of residents speak Spanish at home (100% very well).
0.8% of residents speak other Indo-European language at home (100% very well).
0.5% of residents speak Asian or Pacific Island language at home (100% very well).
Foreign born population: 0 (0.0%)
:
0.0%
Whole state:
22.7%
32%American
20%English
11%Italian
8%Irish
5%Scottish
5%German
4%French
Facilities with environmental interests located in this zip code:
BAILLIE LUMBER CO (SCHOOL STREET in SMYRNA, NY)
AIR SYNTHETIC MINOR (AIRS/AFS) STATE MASTER (New York facility tracking) - 401 CERTIFICATION, AIR PROGRAM, National Pollutant Discharge Elimination System Permit, SECTION 404 PERMITTING, 401 CERTIFICATION Business SIC classification: SAWMILLS AND PLANING MILLS, GENERAL Organizations: BAILLIE LUMBER CO INC (LEGALLY RESPONSIBLE PARTY)
Housing units lacking complete plumbing facilities: 3.5% Housing units lacking complete kitchen facilities: 2.0%
47.4%Fuel oil, kerosene, etc.
24.8%Wood
8.7%Bottled, tank, or LP gas
8.7%Other fuel
6.2%Coal or coke
4.2%Electricity
0.6%Utility gas
Population in 1990: 1,209. Population change in the 1990s: +132 (+10.9%).
Place of birth for U.S.-born residents:
This state: 920
Northeast: 227
Midwest: 14
South: 47
West: 11
68% of the 13464 zip code residents lived in the same house 5 years ago. Out of people who lived in different houses, 72% lived in this county. Out of people who lived in different counties, 50% lived in New York.
92% of the 13464 zip code residents lived in the same house 1 year ago. Out of people who lived in different houses, 23% moved from this county. Out of people who lived in different houses, 74% moved from different county within same state. Out of people who lived in different houses, 3% moved from different state.
Private vs. public school enrollment:
Students in private schools in grades 1 to 8 (elementary and middle school):
Here:
0.0%
New York:
15.6%
Students in private schools in grades 9 to 12 (high school): 5
Here:
16.4%
New York:
15.0%
Students in private undergraduate colleges: 13
Here:
68.1%
New York:
39.2%
Occupation by median earnings in the past 12 months ($)
58,352Health diagnosing and treating practitioners and other technical occupations
48,686Management occupations
48,106Installation, maintenance, and repair occupations
42,985Production occupations
41,960Sales and related occupations
37,100Transportation occupations
Top industries in this zip code by the number of employees in 2005:
Arts, Entertainment, and Recreation: All Other Amusement and Recreation Industries (50-99 employees: 1 establishment)
Professional, Scientific, and Technical Services: Offices of Lawyers (5-9: 1)
Administrative and Support and Waste Management and Remediation Services: Solid Waste Landfill (5-9: 1)
Administrative and Support and Waste Management and Remediation Services: Solid Waste Collection (1-4: 1)
Administrative and Support and Waste Management and Remediation Services: Septic Tank and Related Services (1-4: 1)
Information: Libraries and Archives (1-4: 1)
Fatal accident statistics in 2012:
Fatal accident count: 1
Vehicles involved in fatal accidents: 1
Fatal accidents caused by drunken drivers: 1
Fatalities: 1
Persons involved in fatal accidents: 1
Pedestrians involved in fatal accidents: 0
2002 - 2018 National Fire Incident Reporting System (NFIRS) incidents
Based on the data from the years 2002 - 2018 the average number of fires per year is 8. The highest number of reported fires - 21 took place in 2014, and the least - 1 in 2013. The data has a growing trend.
When looking into fire subcategories, the most incidents belonged to: Structure Fires (58.3%), and Outside Fires (18.0%).
Fire incident types reported to NFIRS in Zip Code 13464


+$5,706
-$2,666
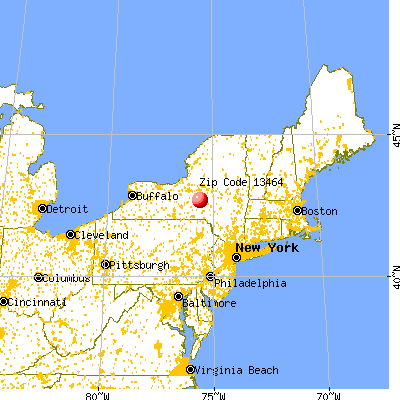
 Nearest zip codes: 13832, 13332, 13844, 13334, 13346, 13155.


 Based on the data from the years 2002 - 2018 the average number of fires per year is 8. The highest number of reported fires - 21 took place in 2014, and the least - 1 in 2013. The data has a growing trend.
 When looking into fire subcategories, the most incidents belonged to: Structure Fires (58.3%), and Outside Fires (18.0%).