Estimated median house/condo value in 2022: $106,120
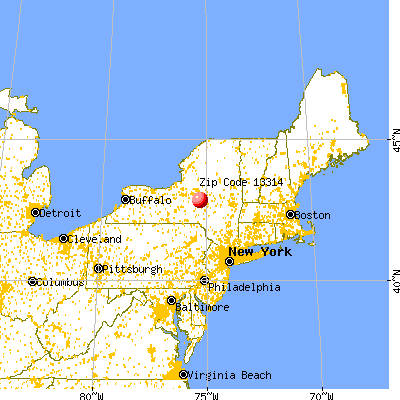
13314:
$106,120
New York:
$400,400
According to our research of New York and other state lists, there was 1 registered sex offender living in 13314 zip code as of May 23, 2024. The ratio of all residents to sex offenders in zip code 13314 is 490 to 1.
Median resident age:
This zip code:
37.3 years
New York median age:
40.0 years
Average household size:
This zip code:
4.6 people
New York:
2.5 people
Averages for the 2020 tax year for zip code 13314, filed in 2021:
Average Adjusted Gross Income (AGI) in 2020: $48,600 (Individual Income Tax Returns)
Here:
$48,600
State:
$90,930
Salary/wage: $40,320 (reported on 83.3% of returns)
Here:
$40,320
State:
$72,104
(% of AGI for various income ranges: 1540.0% for AGIs below $25k, 3038.0% for AGIs $25k-50k, 5605.0% for AGIs $50k-75k, 13960.0% for AGIs $75k-100k)
Taxable interest for individuals: $367 (reported on 33.3% of returns)
This zip code:
$367
New York:
$3,075
(% of AGI for various income ranges: 30.0% for AGIs $25k-50k, 35.0% for AGIs $75k-100k)
Earned income credit: $2,200 (reported on 22.2% of returns)
Here:
$2,200
State:
$2,138
(% of AGI for various income ranges: 176.0% for AGIs $25k-50k)
Percentage of individuals using paid preparers for their 2020 taxes: 100.0%
Here:
100%
State:
95%
(% for various income ranges: 100.0% for AGIs below $25k, 100.0% for AGIs $25k-50k, 100.0% for AGIs $50k-75k, 100.0% for AGIs $75k-100k)
Averages for the 2012 tax year for zip code 13314, filed in 2013:
Average Adjusted Gross Income (AGI) in 2012: $39,264 (Individual Income Tax Returns)
Here:
$39,264
State:
$77,088
Salary/wage: $34,382 (reported on 77.3% of returns)
Here:
$34,382
State:
$60,593
(% of AGI for various income ranges: 63.3% for AGIs below $25k, 78.2% for AGIs $25k-50k, 65.3% for AGIs $50k-75k, 64.7% for AGIs $75k-100k)
Taxable interest for individuals: $617 (reported on 27.3% of returns)
This zip code:
$617
New York:
$3,125
Ordinary dividends: $567 (reported on 13.6% of returns)
Here:
$567
State:
$10,299
Profit/loss from business: +$4,000 (reported on 9.1% of returns)
Here:
+$4,000
State:
+$16,168
Total itemized deductions: $14,033 (21% of AGI, reported on 13.6% of returns)
Here:
$14,033
State:
$34,985
Here:
20.7% of AGI
State:
21.3% of AGI
Taxes paid: $5,300 (reported on 13.6% of returns)
13314:
$5,300
State:
$18,656
Earned income credit: $2,600 (reported on 22.7% of returns)
Here:
$2,600
State:
$2,230
(% of AGI for various income ranges: 10.6% for AGIs below $25k)
Percentage of individuals using paid preparers for their 2012 taxes: 59.1%
Here:
59%
State:
66%
(% for various income ranges: 66.7% for AGIs below $25k, 83.3% for AGIs $25k-50k, 66.7% for AGIs $75k-100k)
Averages for the 2004 tax year for zip code 13314, filed in 2005:
Average Adjusted Gross Income (AGI) in 2004: $32,138 (Individual Income Tax Returns)
Here:
$32,138
State:
$59,519
Salary/wage: $30,694 (reported on 85.0% of returns)
Here:
$30,694
State:
$50,673
(% of AGI for various income ranges: 87.1% for AGIs below $10k, 72.2% for AGIs $10k-25k, 88.3% for AGIs $25k-50k, 82.1% for AGIs $50k-75k, 76.2% for AGIs $75k-100k)
Taxable interest for individuals: $468 (reported on 38.2% of returns)
This zip code:
$468
New York:
$2,377
(% of AGI for various income ranges: 1.1% for AGIs below $10k, 1.2% for AGIs $10k-25k, 0.3% for AGIs $25k-50k, 0.6% for AGIs $50k-75k, 0.2% for AGIs $75k-100k)
Taxable dividends: $838 (reported on 15.0% of returns)
Here:
$838
State:
$5,394
Net capital gain/loss: +$217 (reported on 9.3% of returns)
Here:
+$217
State:
+$23,581
Profit/loss from business: +$526 (reported on 7.7% of returns)
Here:
+$526
State:
+$13,809
Total itemized deductions: $12,370 (18% of AGI, reported on 11.0% of returns)
Here:
$12,370
State:
$25,864
Here:
18.2% of AGI
State:
21.9% of AGI
Charity contributions deductions: $714 (1% of AGI, reported on 8.5% of returns)
Here:
$714
State:
$4,439
Here:
1.1% of AGI
State:
3.6% of AGI
Total tax: $3,594 (reported on 73.2% of returns)
13314:
$3,594
State:
$11,730
(% of AGI for various income ranges: 2.7% for AGIs below $10k, 4.2% for AGIs $10k-25k, 5.8% for AGIs $25k-50k, 8.6% for AGIs $50k-75k, 14.4% for AGIs $75k-100k)
Earned income credit: $1,702 (reported on 19.1% of returns)
Here:
$1,702
State:
$1,757
Percentage of individuals using paid preparers for their 2004 taxes: 67.5%
Here:
67%
State:
67%
(% for various income ranges: 61.2% for AGIs below $10k, 69.3% for AGIs $10k-25k, 69.7% for AGIs $25k-50k, 95.0% for AGIs $50k-75k)
Household received Food Stamps/SNAP in the past 12 months: 15 Household did not receive Food Stamps/SNAP in the past 12 months: 18
Women who did not have a birth in the past 12 months: 22 (15 now married, 5 unmarried)
Housing units in zip code 13314 with a mortgage: 27 (5 second mortgage, 5 both second mortgage and home equity loan) Residents with income below the poverty level in 2022:
This zip code:
78.0%
Whole state:
14.3%
Median number of rooms in houses and condos:
Here:
7.8
State:
6.3
Notable locations in this zip code not listed on our city pages
Size of family households: 7 2-persons, 6 4-persons, 14 7-or-more-persons
Size of nonfamily households: 4 1-person
59 married couples with children.
0 single-parent households ().
94.0% of residents of 13314 zip code speak English at home.
4.0% of residents speak Spanish at home (100% very well).
Foreign born population: 0 (0.0%)
:
0.0%
Whole state:
22.7%
73%American
26%English
Facilities with environmental interests located in this zip code:
BROOKFIELD CENTRAL SCHOOL (FAIR ST OFF BEVER CRK RD in BROOKFIELD, NY)
(Integrated Compliance Information System) - ICIS-02-1988-0168, FORMAL ENFORCEMENT ACTION Conditionally Exempt Small Quantity Generators, less than 100 kg/month of hazardous waste (Resource Conservation and Recovery Act (tracking hazardous waste)) - notification Organizations: JOHN DUNN (CONTACT/OWNER)
BROOKFIELD CENTRAL SCHOOL ( in BROOKFIELD, NY)
(National Center for Education Statistics) - STATE ID-250109040001 Organizations: BROOKFIELD CSD (SCHOOL DISTRICT)
51.1%Bottled, tank, or LP gas
28.8%Fuel oil, kerosene, etc.
12.8%Coal or coke
9.6%Wood
Population in 1990: 5. Population change in the 1990s: +934 (+18680.0%).
Place of birth for U.S.-born residents:
This state: 149
76% of the 13314 zip code residents lived in the same house 5 years ago. Out of people who lived in different houses, 33% lived in this county. Out of people who lived in different counties, 50% lived in New York.
77% of the 13314 zip code residents lived in the same house 1 year ago. Out of people who lived in different houses, 100% moved from different county within same state.
Private vs. public school enrollment:
Students in private schools in grades 1 to 8 (elementary and middle school): 14
Here:
22.9%
New York:
15.6%
Students in private schools in grades 9 to 12 (high school):
Here:
0.0%
New York:
15.0%
Students in private undergraduate colleges:
Here:
0.0%
New York:
39.2%
Top industries in this zip code by the number of employees in 2005:
Construction: New Single-Family Housing Construction (except Operative Builders) (1-4 employees: 2 establishments)
Construction: Framing Contractors (1-4: 1)
Accommodation and Food Services: Full-Service Restaurants (1-4: 1)
Administrative and Support and Waste Management and Remediation Services: Landscaping Services (1-4: 1)
Other Services (except Public Administration): Religious Organizations (1-4: 1)
Home Mortgage Disclosure Act Aggregated Statistics For Year 2009 (Based on 2 partial tracts)
A) FHA, FSA/RHS & VA Home Purchase Loans
B) Conventional Home Purchase Loans
C) Refinancings
D) Home Improvement Loans
F) Non-occupant Loans on < 5 Family Dwellings (A B C & D)
G) Loans On Manufactured Home Dwelling (A B C & D)
Number
Average Value
Number
Average Value
Number
Average Value
Number
Average Value
Number
Average Value
Number
Average Value
LOANS ORIGINATED
2
$117,420
4
$76,788
11
$83,205
4
$37,390
2
$151,720
2
$81,885
APPLICATIONS APPROVED, NOT ACCEPTED
1
$30,280
0
$0
1
$56,860
1
$53,150
0
$0
1
$87,140
APPLICATIONS DENIED
0
$0
2
$112,785
7
$95,171
1
$4,940
1
$42,020
2
$52,840
APPLICATIONS WITHDRAWN
1
$40,170
1
$43,260
4
$121,900
0
$0
1
$24,720
1
$42,640
FILES CLOSED FOR INCOMPLETENESS
0
$0
0
$0
0
$0
0
$0
0
$0
0
$0
Aggregated Statistics For Year 2008 (Based on 2 partial tracts)
A) FHA, FSA/RHS & VA Home Purchase Loans
B) Conventional Home Purchase Loans
C) Refinancings
D) Home Improvement Loans
F) Non-occupant Loans on < 5 Family Dwellings (A B C & D)
G) Loans On Manufactured Home Dwelling (A B C & D)
Number
Average Value
Number
Average Value
Number
Average Value
Number
Average Value
Number
Average Value
Number
Average Value
LOANS ORIGINATED
0
$0
9
$77,044
11
$68,598
4
$65,200
3
$81,577
6
$47,792
APPLICATIONS APPROVED, NOT ACCEPTED
0
$0
1
$27,190
1
$121,130
1
$21,630
0
$0
1
$27,190
APPLICATIONS DENIED
2
$64,270
2
$68,905
11
$96,071
13
$24,149
1
$21,630
4
$31,982
APPLICATIONS WITHDRAWN
0
$0
0
$0
4
$90,538
0
$0
0
$0
1
$44,500
FILES CLOSED FOR INCOMPLETENESS
0
$0
0
$0
1
$102,590
0
$0
0
$0
0
$0
Aggregated Statistics For Year 2007 (Based on 2 partial tracts)
A) FHA, FSA/RHS & VA Home Purchase Loans
B) Conventional Home Purchase Loans
C) Refinancings
D) Home Improvement Loans
F) Non-occupant Loans on < 5 Family Dwellings (A B C & D)
G) Loans On Manufactured Home Dwelling (A B C & D)
Number
Average Value
Number
Average Value
Number
Average Value
Number
Average Value
Number
Average Value
Number
Average Value
LOANS ORIGINATED
2
$85,900
8
$81,035
11
$49,384
2
$61,490
0
$0
4
$72,305
APPLICATIONS APPROVED, NOT ACCEPTED
0
$0
1
$23,480
3
$46,763
1
$6,180
0
$0
1
$23,480
APPLICATIONS DENIED
0
$0
5
$121,252
20
$103,638
14
$24,102
2
$90,535
4
$62,728
APPLICATIONS WITHDRAWN
0
$0
1
$9,270
7
$102,147
2
$39,245
0
$0
1
$30,900
FILES CLOSED FOR INCOMPLETENESS
0
$0
1
$30,900
1
$278,100
0
$0
0
$0
1
$278,100
Aggregated Statistics For Year 2006 (Based on 2 partial tracts)
A) FHA, FSA/RHS & VA Home Purchase Loans
B) Conventional Home Purchase Loans
C) Refinancings
D) Home Improvement Loans
F) Non-occupant Loans on < 5 Family Dwellings (A B C & D)
G) Loans On Manufactured Home Dwelling (A B C & D)
Number
Average Value
Number
Average Value
Number
Average Value
Number
Average Value
Number
Average Value
Number
Average Value
LOANS ORIGINATED
2
$62,420
13
$78,201
22
$56,800
11
$16,742
2
$82,810
5
$58,586
APPLICATIONS APPROVED, NOT ACCEPTED
1
$21,010
1
$72,920
5
$102,340
0
$0
0
$0
0
$0
APPLICATIONS DENIED
0
$0
2
$65,815
12
$94,039
9
$34,333
2
$61,490
2
$51,910
APPLICATIONS WITHDRAWN
1
$59,950
0
$0
12
$64,169
1
$46,350
1
$25,340
1
$18,540
FILES CLOSED FOR INCOMPLETENESS
0
$0
1
$95,170
4
$72,152
1
$8,030
1
$56,240
0
$0
Aggregated Statistics For Year 2005 (Based on 2 partial tracts)
A) FHA, FSA/RHS & VA Home Purchase Loans
B) Conventional Home Purchase Loans
C) Refinancings
D) Home Improvement Loans
F) Non-occupant Loans on < 5 Family Dwellings (A B C & D)
G) Loans On Manufactured Home Dwelling (A B C & D)
Number
Average Value
Number
Average Value
Number
Average Value
Number
Average Value
Number
Average Value
Number
Average Value
LOANS ORIGINATED
0
$0
12
$79,052
15
$60,152
11
$19,439
1
$148,320
5
$40,294
APPLICATIONS APPROVED, NOT ACCEPTED
0
$0
5
$54,014
4
$79,105
1
$58,090
1
$49,440
3
$56,857
APPLICATIONS DENIED
0
$0
4
$45,888
13
$82,004
9
$17,441
1
$24,720
3
$18,333
APPLICATIONS WITHDRAWN
1
$19,780
1
$158,210
9
$90,502
0
$0
1
$178,600
1
$19,780
FILES CLOSED FOR INCOMPLETENESS
0
$0
0
$0
3
$76,633
1
$21,630
1
$44,500
0
$0
Aggregated Statistics For Year 2004 (Based on 2 partial tracts)
B) Conventional Home Purchase Loans
C) Refinancings
D) Home Improvement Loans
F) Non-occupant Loans on < 5 Family Dwellings (A B C & D)
G) Loans On Manufactured Home Dwelling (A B C & D)
Number
Average Value
Number
Average Value
Number
Average Value
Number
Average Value
Number
Average Value
LOANS ORIGINATED
11
$71,688
16
$60,989
12
$26,059
2
$87,445
5
$36,710
APPLICATIONS APPROVED, NOT ACCEPTED
1
$23,480
3
$53,353
1
$9,270
0
$0
1
$23,480
APPLICATIONS DENIED
4
$63,035
16
$71,224
7
$35,050
2
$91,155
5
$64,642
APPLICATIONS WITHDRAWN
0
$0
7
$52,000
1
$14,830
1
$41,410
0
$0
FILES CLOSED FOR INCOMPLETENESS
0
$0
8
$80,649
0
$0
0
$0
0
$0
Aggregated Statistics For Year 2003 (Based on 2 partial tracts)
A) FHA, FSA/RHS & VA Home Purchase Loans
B) Conventional Home Purchase Loans
C) Refinancings
D) Home Improvement Loans
F) Non-occupant Loans on < 5 Family Dwellings (A B C & D)
Number
Average Value
Number
Average Value
Number
Average Value
Number
Average Value
Number
Average Value
LOANS ORIGINATED
1
$37,700
7
$83,607
27
$58,527
8
$19,621
1
$108,150
APPLICATIONS APPROVED, NOT ACCEPTED
1
$18,540
2
$45,425
6
$50,677
1
$31,520
0
$0
APPLICATIONS DENIED
1
$18,540
3
$78,073
15
$47,627
4
$25,338
2
$80,650
APPLICATIONS WITHDRAWN
0
$0
1
$39,550
9
$49,028
0
$0
0
$0
FILES CLOSED FOR INCOMPLETENESS
0
$0
1
$71,070
1
$72,310
0
$0
0
$0
Aggregated Statistics For Year 2002 (Based on 2 partial tracts)
A) FHA, FSA/RHS & VA Home Purchase Loans
B) Conventional Home Purchase Loans
C) Refinancings
D) Home Improvement Loans
Number
Average Value
Number
Average Value
Number
Average Value
Number
Average Value
LOANS ORIGINATED
2
$99,500
6
$43,260
22
$50,002
10
$11,866
APPLICATIONS APPROVED, NOT ACCEPTED
0
$0
2
$64,890
2
$64,890
1
$9,270
APPLICATIONS DENIED
0
$0
4
$35,690
12
$73,078
5
$14,708
APPLICATIONS WITHDRAWN
0
$0
1
$21,630
11
$55,171
2
$34,915
FILES CLOSED FOR INCOMPLETENESS
0
$0
0
$0
2
$120,200
0
$0
Aggregated Statistics For Year 2001 (Based on 2 partial tracts)
A) FHA, FSA/RHS & VA Home Purchase Loans
B) Conventional Home Purchase Loans
C) Refinancings
D) Home Improvement Loans
F) Non-occupant Loans on < 5 Family Dwellings (A B C & D)
Number
Average Value
Number
Average Value
Number
Average Value
Number
Average Value
Number
Average Value
LOANS ORIGINATED
2
$76,325
7
$54,031
19
$49,993
9
$9,270
1
$42,020
APPLICATIONS APPROVED, NOT ACCEPTED
1
$16,690
2
$61,800
1
$43,880
1
$13,600
0
$0
APPLICATIONS DENIED
0
$0
6
$40,067
13
$49,298
11
$9,214
1
$12,360
APPLICATIONS WITHDRAWN
1
$32,750
1
$29,050
10
$44,681
1
$23,480
0
$0
FILES CLOSED FOR INCOMPLETENESS
0
$0
0
$0
2
$38,625
0
$0
0
$0
Aggregated Statistics For Year 2000 (Based on 2 partial tracts)
A) FHA, FSA/RHS & VA Home Purchase Loans
B) Conventional Home Purchase Loans
C) Refinancings
D) Home Improvement Loans
F) Non-occupant Loans on < 5 Family Dwellings (A B C & D)
Number
Average Value
Number
Average Value
Number
Average Value
Number
Average Value
Number
Average Value
LOANS ORIGINATED
1
$51,910
6
$42,230
11
$40,338
7
$14,214
0
$0
APPLICATIONS APPROVED, NOT ACCEPTED
0
$0
1
$21,010
4
$52,530
3
$8,653
0
$0
APPLICATIONS DENIED
1
$28,430
7
$63,301
12
$41,148
4
$19,930
1
$30,900
APPLICATIONS WITHDRAWN
1
$30,280
1
$4,330
6
$63,138
1
$23,480
0
$0
FILES CLOSED FOR INCOMPLETENESS
0
$0
0
$0
2
$22,250
0
$0
0
$0
Aggregated Statistics For Year 1999 (Based on 1 partial tract)
B) Conventional Home Purchase Loans
C) Refinancings
D) Home Improvement Loans
F) Non-occupant Loans on < 5 Family Dwellings (A B C & D)


 Nearest zip codes: 13485, 13364, 13418, 13313, 13480, 13355.


