Estimated zip code population in 2022: 2,504 Zip code population in 2010: 2,603 Zip code population in 2000: 2,882
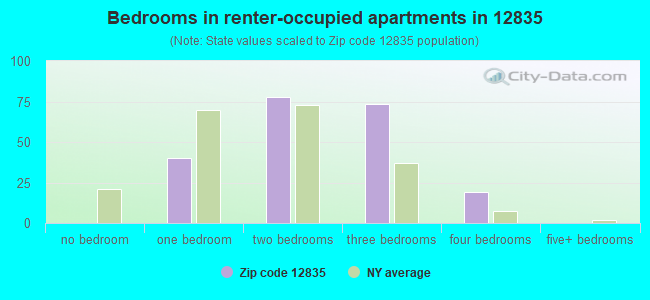
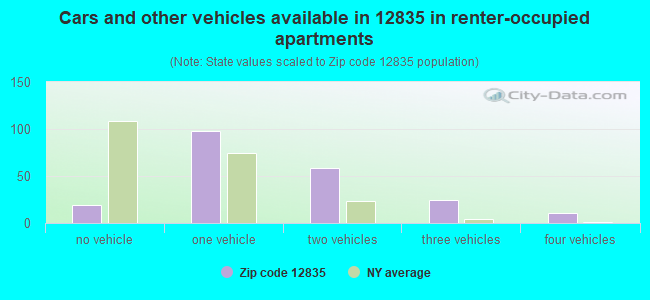
Houses and condos: 2,832 Renter-occupied apartments: 212
% of renters here:
17%
State:
46%
March 2022 cost of living index in zip code 12835: 95.4 (near average, U.S. average is 100)
Land area: 97.4 sq. mi. Water area: 2.0 sq. mi.
Population density: 26 people per square mile
(very low).
OSM Map
General Map
Google Map
MSN Map
OSM Map
General Map
Google Map
MSN Map
OSM Map
General Map
Google Map
MSN Map
OSM Map
General Map
Google Map
MSN Map
Please wait while loading the map...
Real estate property taxes paid for housing units in 2022:
This zip code:
1.0% ($2,326)
New York:
1.5% ($6,180)
Median real estate property taxes paid for housing units with mortgages in 2022: $2,235 (1.0%) Median real estate property taxes paid for housing units with no mortgage in 2022: $2,489 (1.0%)
Business Search- 14 Million verified businesses
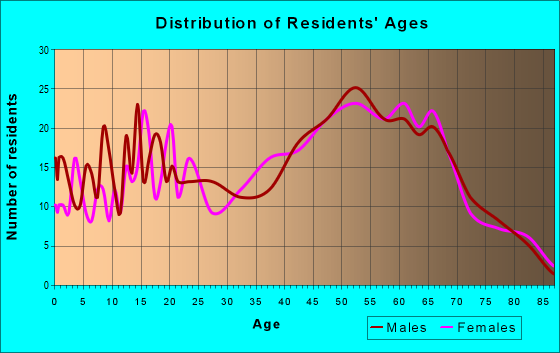
Males: 1,293
(51.6%)
Females: 1,211
(48.4%)
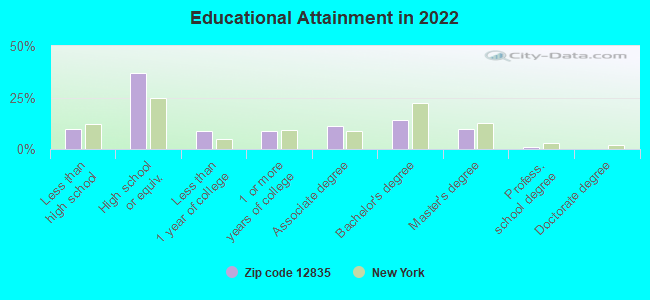
For population 25 years and over in 12835:
High school or higher: 89.5%
Bachelor's degree or higher: 24.6%
Graduate or professional degree: 10.9%
Unemployed: 3.7%
Mean travel time to work (commute): 30.4 minutes
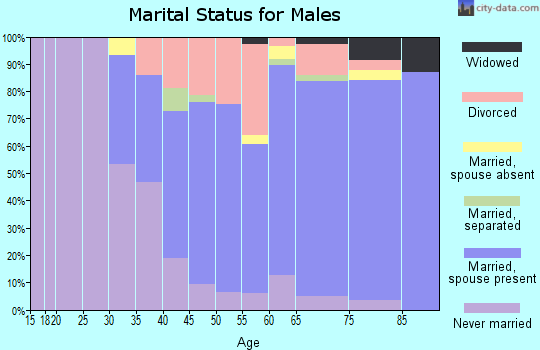
For population 15 years and over in 12835:
Never married: 19.6%
Now married: 62.2%
Separated: 0.6%
Widowed: 5.8%
Divorced: 11.8%
Zip code 12835 compared to state average:
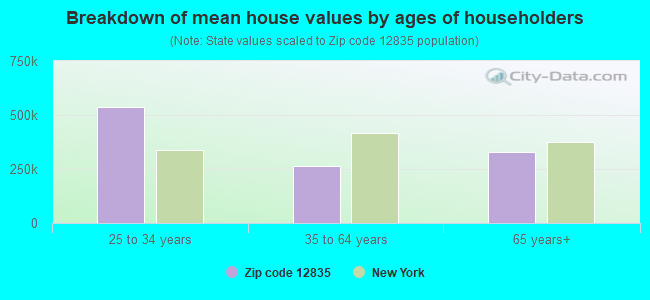
Median house value below state average.
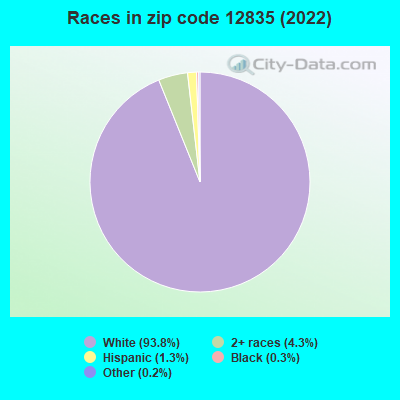
Black race population percentage significantly below state average.
Hispanic race population percentage significantly below state average.
Median age significantly above state average.
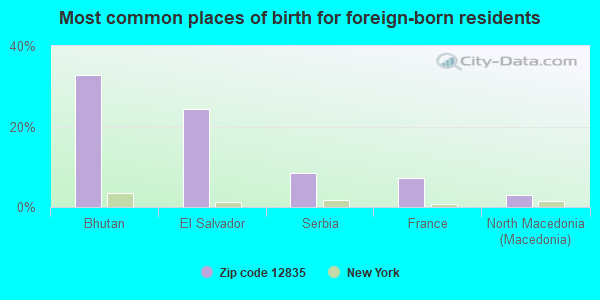
Foreign-born population percentage significantly below state average.
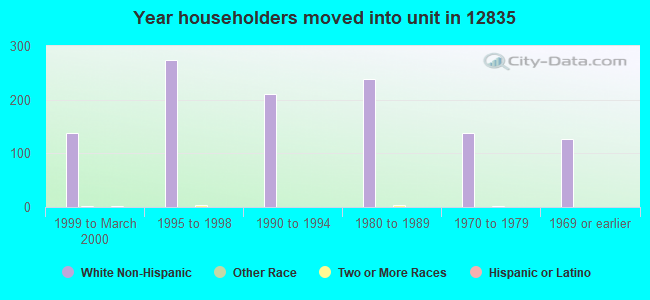
Renting percentage significantly below state average.
Length of stay since moving in significantly above state average.
Number of college students significantly below state average.
Averages for the 2020 tax year for zip code 12835, filed in 2021:
Average Adjusted Gross Income (AGI) in 2020: $58,879 (Individual Income Tax Returns)
Here:
$58,879
State:
$90,930
Salary/wage: $50,090 (reported on 71.8% of returns)
Here:
$50,090
State:
$72,104
(% of AGI for various income ranges: 986.8% for AGIs below $25k, 3021.6% for AGIs $25k-50k, 5405.6% for AGIs $50k-75k, 8527.0% for AGIs $75k-100k, 12762.7% for AGIs $100k-200k)
Taxable interest for individuals: $844 (reported on 38.2% of returns)
This zip code:
$844
New York:
$3,075
(% of AGI for various income ranges: 19.3% for AGIs below $25k, 19.2% for AGIs $25k-50k, 61.9% for AGIs $50k-75k, 49.0% for AGIs $75k-100k, 119.1% for AGIs $100k-200k)
Ordinary dividends: $3,670 (reported on 22.9% of returns)
Here:
$3,670
State:
$11,095
(% of AGI for various income ranges: 30.0% for AGIs below $25k, 32.4% for AGIs $25k-50k, 114.4% for AGIs $50k-75k, 156.0% for AGIs $75k-100k, 542.7% for AGIs $100k-200k)
Net capital gain/loss in AGI: +$7,446 (reported on 18.3% of returns)
Here:
+$7,446
State:
+$44,925
(% of AGI for various income ranges: 21.8% for AGIs below $25k, 18.4% for AGIs $25k-50k, 148.1% for AGIs $50k-75k, 223.0% for AGIs $75k-100k, 677.3% for AGIs $100k-200k)
Profit/loss from business: +$9,535 (reported on 13.0% of returns)
Here:
+$9,535
State:
+$14,940
(% of AGI for various income ranges: 66.8% for AGIs below $25k, 173.2% for AGIs $25k-50k, 113.1% for AGIs $50k-75k, 138.0% for AGIs $75k-100k, 620.0% for AGIs $100k-200k)
Taxable individual retirement arrangement distribution: $17,006 (reported on 13.7% of returns)
12835:
$17,006
New York:
$19,609
(% of AGI for various income ranges: 93.2% for AGIs below $25k, 102.4% for AGIs $25k-50k, 351.2% for AGIs $50k-75k, 614.0% for AGIs $75k-100k, 1243.6% for AGIs $100k-200k)
Total itemized deductions: $24,900 (reported on 3.8% of returns)
Here:
$24,900
State:
$39,326
(% of AGI for various income ranges: 360.0% for AGIs $50k-75k, 608.2% for AGIs $100k-200k)
Charity contributions: $5,033 (reported on 2.3% of returns)
Here:
$5,033
State:
$15,420
(% of AGI for various income ranges: 151.0% for AGIs $75k-100k)
Taxes paid: $8,220 (reported on 3.8% of returns)
12835:
$8,220
State:
$9,183
(% of AGI for various income ranges: 112.5% for AGIs $50k-75k, 210.0% for AGIs $100k-200k)
Earned income credit: $1,800 (reported on 13.0% of returns)
Here:
$1,800
State:
$2,138
(% of AGI for various income ranges: 71.8% for AGIs below $25k, 42.0% for AGIs $25k-50k)
Percentage of individuals using paid preparers for their 2020 taxes: 94.7%
Here:
95%
State:
95%
(% for various income ranges: 92.3% for AGIs below $25k, 96.8% for AGIs $25k-50k, 95.8% for AGIs $50k-75k, 93.8% for AGIs $75k-100k, 94.4% for AGIs $100k-200k, 100.0% for AGIs over 200k)
Averages for the 2012 tax year for zip code 12835, filed in 2013:
Average Adjusted Gross Income (AGI) in 2012: $46,041 (Individual Income Tax Returns)
Here:
$46,041
State:
$77,088
Salary/wage: $38,327 (reported on 76.4% of returns)
Here:
$38,327
State:
$60,593
(% of AGI for various income ranges: 61.8% for AGIs below $25k, 67.8% for AGIs $25k-50k, 67.9% for AGIs $50k-75k, 61.0% for AGIs $75k-100k, 59.9% for AGIs $100k-200k)
Taxable interest for individuals: $624 (reported on 40.7% of returns)
This zip code:
$624
New York:
$3,125
(% of AGI for various income ranges: 1.2% for AGIs below $25k, 0.5% for AGIs $25k-50k, 0.5% for AGIs $50k-75k, 0.2% for AGIs $75k-100k, 0.6% for AGIs $100k-200k)
Ordinary dividends: $2,621 (reported on 23.6% of returns)
Here:
$2,621
State:
$10,299
(% of AGI for various income ranges: 2.2% for AGIs below $25k, 0.7% for AGIs $25k-50k, 1.2% for AGIs $50k-75k, 1.2% for AGIs $75k-100k, 1.7% for AGIs $100k-200k)
Net capital gain/loss in AGI: +$3,975 (reported on 13.0% of returns)
Here:
+$3,975
State:
+$42,474
(% of AGI for various income ranges: 0.3% for AGIs below $25k, 1.0% for AGIs $75k-100k, 3.2% for AGIs $100k-200k)
Profit/loss from business: +$7,733 (reported on 14.6% of returns)
Here:
+$7,733
State:
+$16,168
(% of AGI for various income ranges: 8.2% for AGIs below $25k, 2.6% for AGIs $25k-50k, 1.8% for AGIs $50k-75k, 4.1% for AGIs $75k-100k)
Taxable individual retirement arrangement distribution: $11,732 (reported on 15.4% of returns)
12835:
$11,732
New York:
$17,621
(% of AGI for various income ranges: 3.2% for AGIs below $25k, 3.6% for AGIs $25k-50k, 5.5% for AGIs $50k-75k, 5.4% for AGIs $100k-200k)
Total itemized deductions: $19,262 (24% of AGI, reported on 27.6% of returns)
Here:
$19,262
State:
$34,985
Here:
24.2% of AGI
State:
21.3% of AGI
(% of AGI for various income ranges: 7.7% for AGIs below $25k, 9.2% for AGIs $25k-50k, 10.9% for AGIs $50k-75k, 12.4% for AGIs $75k-100k, 14.5% for AGIs $100k-200k)
Charity contributions: $1,692 (reported on 20.3% of returns)
Here:
$1,692
State:
$5,572
(% of AGI for various income ranges: 0.5% for AGIs below $25k, 0.8% for AGIs $25k-50k, 0.6% for AGIs $50k-75k, 0.6% for AGIs $75k-100k, 1.0% for AGIs $100k-200k)
Taxes paid: $7,274 (reported on 27.6% of returns)
12835:
$7,274
State:
$18,656
(% of AGI for various income ranges: 2.4% for AGIs below $25k, 2.3% for AGIs $25k-50k, 3.8% for AGIs $50k-75k, 4.4% for AGIs $75k-100k, 6.8% for AGIs $100k-200k)
Earned income credit: $2,062 (reported on 17.1% of returns)
Here:
$2,062
State:
$2,230
(% of AGI for various income ranges: 5.8% for AGIs below $25k, 0.7% for AGIs $25k-50k)
Percentage of individuals using paid preparers for their 2012 taxes: 53.7%
Here:
54%
State:
66%
(% for various income ranges: 49.0% for AGIs below $25k, 54.8% for AGIs $25k-50k, 55.0% for AGIs $50k-75k, 63.6% for AGIs $75k-100k, 58.3% for AGIs $100k-200k)
Averages for the 2004 tax year for zip code 12835, filed in 2005:
Average Adjusted Gross Income (AGI) in 2004: $36,444 (Individual Income Tax Returns)
Here:
$36,444
State:
$59,519
Salary/wage: $32,018 (reported on 81.2% of returns)
Here:
$32,018
State:
$50,673
(% of AGI for various income ranges: 84.5% for AGIs below $10k, 63.4% for AGIs $10k-25k, 75.5% for AGIs $25k-50k, 73.0% for AGIs $50k-75k, 70.9% for AGIs $75k-100k, 66.8% for AGIs over 100k)
Taxable interest for individuals: $816 (reported on 48.9% of returns)
This zip code:
$816
New York:
$2,377
(% of AGI for various income ranges: 2.5% for AGIs below $10k, 2.5% for AGIs $10k-25k, 1.4% for AGIs $25k-50k, 0.7% for AGIs $50k-75k, 0.6% for AGIs $75k-100k, 0.4% for AGIs over 100k)
Taxable dividends: $1,673 (reported on 26.7% of returns)
Here:
$1,673
State:
$5,394
(% of AGI for various income ranges: 2.4% for AGIs below $10k, 1.9% for AGIs $10k-25k, 0.8% for AGIs $25k-50k, 0.7% for AGIs $50k-75k, 1.5% for AGIs $75k-100k, 1.7% for AGIs over 100k)
Net capital gain/loss: +$2,829 (reported on 17.9% of returns)
Here:
+$2,829
State:
+$23,581
(% of AGI for various income ranges: -2.0% for AGIs below $10k, 1.1% for AGIs $10k-25k, 1.0% for AGIs $25k-50k, 0.4% for AGIs $50k-75k, 1.0% for AGIs $75k-100k, 4.4% for AGIs over 100k)
Profit/loss from business: +$3,759 (reported on 14.4% of returns)
Here:
+$3,759
State:
+$13,809
(% of AGI for various income ranges: 6.7% for AGIs below $10k, 7.6% for AGIs $10k-25k, 0.2% for AGIs $25k-50k, 1.1% for AGIs $50k-75k, 0.3% for AGIs $75k-100k, -0.1% for AGIs over 100k)
IRA payment deduction: $2,825 (reported on 3.4% of returns)
12835:
$2,825
New York:
$3,115
Total itemized deductions: $15,548 (22% of AGI, reported on 23.8% of returns)
Here:
$15,548
State:
$25,864
Here:
22.4% of AGI
State:
21.9% of AGI
(% of AGI for various income ranges: 7.1% for AGIs $10k-25k, 8.7% for AGIs $25k-50k, 11.1% for AGIs $50k-75k, 12.6% for AGIs $75k-100k, 12.7% for AGIs over 100k)
Charity contributions deductions: $1,935 (3% of AGI, reported on 20.8% of returns)
Here:
$1,935
State:
$4,439
Here:
2.7% of AGI
State:
3.6% of AGI
(% of AGI for various income ranges: 0.7% for AGIs $10k-25k, 0.9% for AGIs $25k-50k, 1.1% for AGIs $50k-75k, 2.0% for AGIs $75k-100k, 1.1% for AGIs over 100k)
Total tax: $4,581 (reported on 75.0% of returns)
12835:
$4,581
State:
$11,730
(% of AGI for various income ranges: 2.3% for AGIs below $10k, 4.5% for AGIs $10k-25k, 6.6% for AGIs $25k-50k, 9.2% for AGIs $50k-75k, 10.9% for AGIs $75k-100k, 17.0% for AGIs over 100k)
Earned income credit: $1,689 (reported on 16.1% of returns)
Here:
$1,689
State:
$1,757
Percentage of individuals using paid preparers for their 2004 taxes: 62.7%
Here:
63%
State:
67%
(% for various income ranges: 53.4% for AGIs below $10k, 65.7% for AGIs $10k-25k, 61.9% for AGIs $25k-50k, 64.4% for AGIs $50k-75k, 78.3% for AGIs $75k-100k, 66.7% for AGIs over 100k)
Likely homosexual households (counted as self-reported same-sex unmarried-partner households)
Lesbian couples: 0.6% of all households
Gay men: 0.0% of all households
Household received Food Stamps/SNAP in the past 12 months: 139 Household did not receive Food Stamps/SNAP in the past 12 months: 1,084
Women who had a birth in the past 12 months: 13 (13 now married, 0 unmarried) Women who did not have a birth in the past 12 months: 333 (182 now married, 147 unmarried)
Housing units in zip code 12835 with a mortgage: 470 (44 second mortgage, 7 home equity loan, 25 both second mortgage and home equity loan) Houses without a mortgage: 29
Median monthly owner costs for units with a mortgage: $1,410 Median monthly owner costs for units without a mortgage: $551
Residents with income below the poverty level in 2022:
This zip code:
10.1%
Whole state:
14.3%
Residents with income below 50% of the poverty level in 2022:
This zip code:
6.3%
Whole state:
6.8%
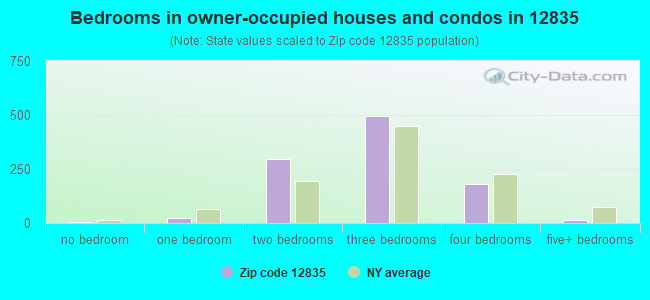
Median number of rooms in houses and condos:
Here:
5.9
State:
6.3
Median number of rooms in apartments:
Here:
4.6
State:
3.8
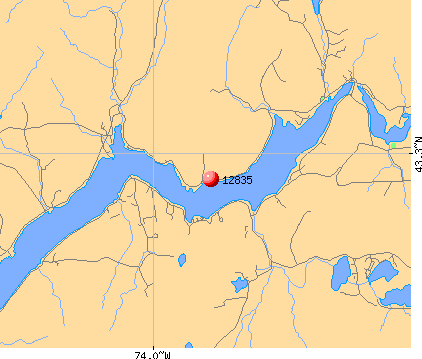
Notable locations in this zip code not listed on our city pages
Lakes and reservoirs: Livingston Lake (A), O'Keefe Pond (B), Sand Lake (C), Tenant Lake (D), Bullhead Pond (E), Stewarts Bridge Reservoir (F), Bell Brook Pond (G). Display/hide their locations on the map
Streams, rivers, and creeks: Glasshouse Creek (A), Parker Brook (B), Wolf Creek (C), Sacandaga River (D), Breen Brook (E), Tank Brook (F), Man Shanty Brook (G), Beecher Creek (H). Display/hide their locations on the map
In group quarters: 22 (-1 institutionalized population)
Size of family households: 611 2-persons, 63 3-persons, 73 4-persons, 40 5-persons, 14 6-persons
Size of nonfamily households: 310 1-person, 129 2-persons, 2 3-persons
157 married couples with children.
42 single-parent households (42 women).
99.1% of residents of 12835 zip code speak English at home.
0.2% of residents speak Spanish at home (100% very well).
1.4% of residents speak other Indo-European language at home (77% very well, 6% well, 17% not well).
Foreign born population: 71 (2.9%) (100.0% of them are naturalized citizens)
This zip code:
2.9%
Whole state:
22.7%
33%Bhutan
24%El Salvador
9%Serbia
7%France
3%North Macedonia (Macedonia)
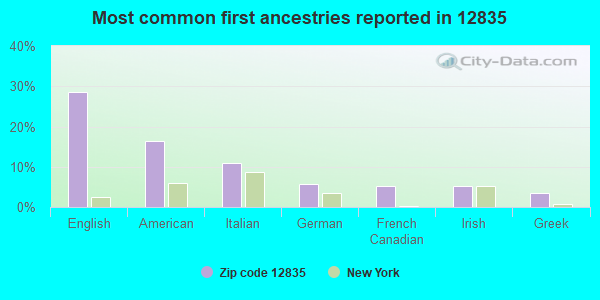
29%English
16%American
11%Italian
6%German
5%French Canadian
5%Irish
4%Greek
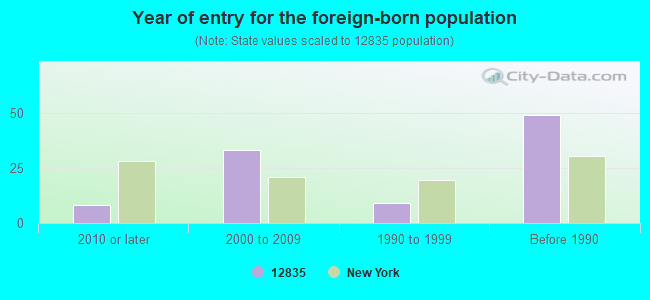
Year of entry for the foreign-born population
82010 or later
332000 to 2009
91990 to 1999
49Before 1990
Facilities with environmental interests located in this zip code:
HADELY (T) WWTP (WOODWARD AVENUE EXTENSION in HADLEY, NY)
National Pollutant Discharge Elimination System NON-MAJOR (Tracking pollutant discharge elimination systems) - permit Business SIC classification: SEWERAGE SYSTEMS Organizations: HADLEY (T) (CONTACT/OWNER)
Alternative names: HADLEY (T), HADLEY (T) STP
AGWAY ENERGY PRODUCTS (N SHORE RD in HADLEY, NY)
(Resource Conservation and Recovery Act (tracking hazardous waste))
HADLEY SUBSTATION (ROCKWELL ST in HADLEY, NY)
(Resource Conservation and Recovery Act (tracking hazardous waste))
HADLEY SUBSTATION (CONKLINVILLE ROAD in HADLEY, NY)
(Resource Conservation and Recovery Act (tracking hazardous waste))
HADLEY SANITARY LANDFILL (4043 N SHORE RD in HADLEY, NY)
CRITERIA AND HAZARDOUS AIR POLLUTANT INVENTORY (Inventory of air pollution sources) Business SIC classification: REFUSE SYSTEMS Business NAICS classification: SOLID WASTE LANDFILL.
Housing units lacking complete plumbing facilities: 7.9% Housing units lacking complete kitchen facilities: 3.1%
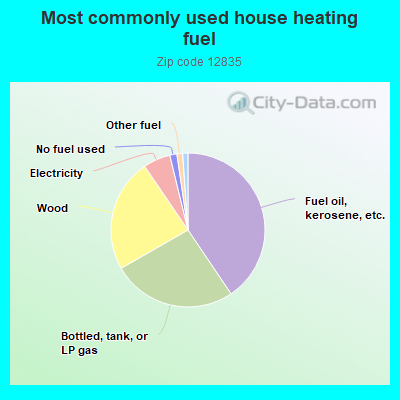
40.6%Fuel oil, kerosene, etc.
26.2%Bottled, tank, or LP gas
23.8%Wood
5.7%Electricity
1.5%No fuel used
1.2%Other fuel
0.6%Utility gas
0.6%Coal or coke
Population in 1990: 1,840. Population change in the 1990s: +1,042 (+56.6%).
Place of birth for U.S.-born residents:
This state: 1,860
Northeast: 107
Midwest: 34
South: 298
West: 95
64% of the 12835 zip code residents lived in the same house 5 years ago. Out of people who lived in different houses, 54% lived in this county. Out of people who lived in different counties, 50% lived in New York.
84% of the 12835 zip code residents lived in the same house 1 year ago. Out of people who lived in different houses, 13% moved from this county. Out of people who lived in different houses, 75% moved from different county within same state. Out of people who lived in different houses, 14% moved from different state. Out of people who lived in different houses, 1% moved from abroad.
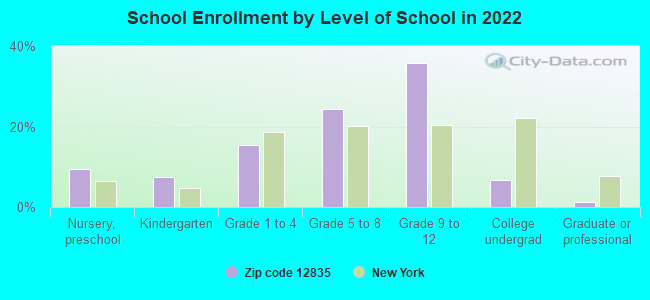
Private vs. public school enrollment:
Students in private schools in grades 1 to 8 (elementary and middle school): 7
Here:
6.9%
New York:
15.6%
Students in private schools in grades 9 to 12 (high school): 13
Here:
14.6%
New York:
15.0%
Students in private undergraduate colleges: 4
Here:
27.7%
New York:
39.2%
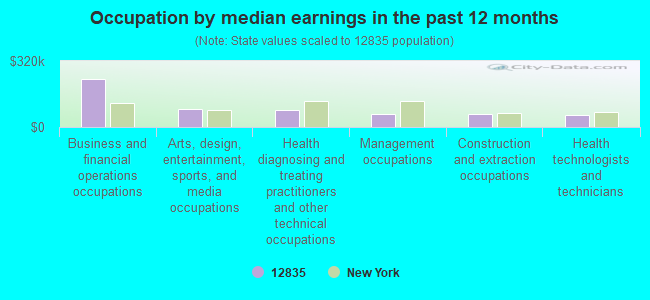
Occupation by median earnings in the past 12 months ($)
233,331Business and financial operations occupations
89,319Arts, design, entertainment, sports, and media occupations
82,397Health diagnosing and treating practitioners and other technical occupations
64,896Management occupations
64,702Construction and extraction occupations
58,136Health technologists and technicians
Top industries in this zip code by the number of employees in 2005:
Other Services (except Public Administration): Religious Organizations (10-19 employees: 1 establishment, 1-4 employees: 1 establishment)
Construction: Electrical Contractors (10-19: 1)
Administrative and Support and Waste Management and Remediation Services: Landscaping Services (5-9: 1, 1-4: 1)
Accommodation and Food Services: Full-Service Restaurants (5-9: 1)
Arts, Entertainment, and Recreation: Golf Courses and Country Clubs (1-4: 1)
Construction: Roofing Contractors (1-4: 1)
Other Services (except Public Administration): General Automotive Repair (1-4: 1)
Construction: Poured Concrete Foundation and Structure Contractors (1-4: 1)
Accommodation and Food Services: RV (Recreational Vehicle) Parks and Campgrounds (1-4: 1)
Arts, Entertainment, and Recreation: All Other Amusement and Recreation Industries (1-4: 1)
People in group quarters in 2010:
14 people in group homes intended for adults
People in group quarters in 2000:
23 people in homes for the mentally retarded
Fatal accident statistics in 2014:
Fatal accident count: 1
Vehicles involved in fatal accidents: 1
Fatal accidents caused by drunken drivers: 1
Fatalities: 1
Persons involved in fatal accidents: 1
Pedestrians involved in fatal accidents: 0
Fatal accident statistics in 2012:
Fatal accident count: 1
Vehicles involved in fatal accidents: 1
Fatal accidents caused by drunken drivers: 0
Fatalities: 1
Persons involved in fatal accidents: 1
Pedestrians involved in fatal accidents: 0
Home Mortgage Disclosure Act Aggregated Statistics For Year 2009 (Based on 6 partial tracts)
A) FHA, FSA/RHS & VA Home Purchase Loans
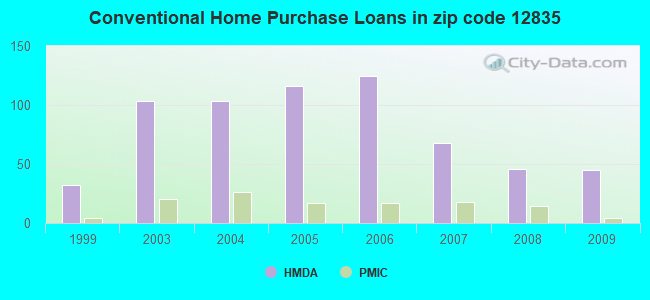
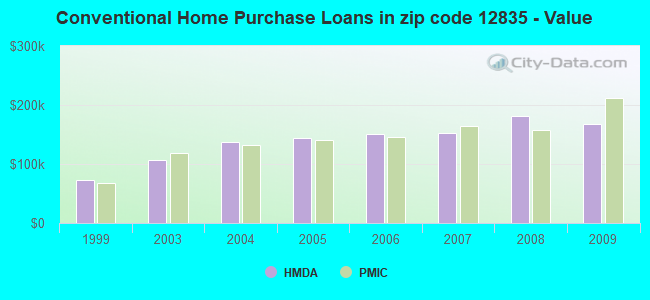
B) Conventional Home Purchase Loans
C) Refinancings
D) Home Improvement Loans
F) Non-occupant Loans on < 5 Family Dwellings (A B C & D)
G) Loans On Manufactured Home Dwelling (A B C & D)
Number
Average Value
Number
Average Value
Number
Average Value
Number
Average Value
Number
Average Value
Number
Average Value
LOANS ORIGINATED
21
$162,871
45
$167,634
106
$157,993
31
$36,258
49
$191,999
8
$134,308
APPLICATIONS APPROVED, NOT ACCEPTED
0
$0
0
$0
16
$192,244
3
$167,207
3
$187,643
0
$0
APPLICATIONS DENIED
7
$153,043
8
$126,606
64
$164,299
16
$68,249
24
$177,416
3
$49,697
APPLICATIONS WITHDRAWN
1
$143,520
10
$169,013
23
$165,003
4
$118,418
6
$222,480
1
$239,770
FILES CLOSED FOR INCOMPLETENESS
0
$0
0
$0
10
$133,425
3
$101,107
1
$401,300
0
$0
Aggregated Statistics For Year 2008 (Based on 6 partial tracts)
A) FHA, FSA/RHS & VA Home Purchase Loans
B) Conventional Home Purchase Loans
C) Refinancings
D) Home Improvement Loans
F) Non-occupant Loans on < 5 Family Dwellings (A B C & D)
G) Loans On Manufactured Home Dwelling (A B C & D)
Number
Average Value
Number
Average Value
Number
Average Value
Number
Average Value
Number
Average Value
Number
Average Value
LOANS ORIGINATED
14
$140,623
46
$181,840
110
$141,931
31
$35,955
56
$160,584
10
$86,177
APPLICATIONS APPROVED, NOT ACCEPTED
0
$0
16
$133,926
19
$140,725
3
$9,290
11
$138,865
3
$104,307
APPLICATIONS DENIED
4
$109,472
18
$93,522
91
$143,665
23
$28,464
20
$137,462
18
$48,362
APPLICATIONS WITHDRAWN
0
$0
6
$169,237
34
$149,013
4
$103,635
4
$217,022
0
$0
FILES CLOSED FOR INCOMPLETENESS
1
$200,770
1
$196,440
11
$119,399
0
$0
1
$136,550
0
$0
Aggregated Statistics For Year 2007 (Based on 6 partial tracts)
A) FHA, FSA/RHS & VA Home Purchase Loans
B) Conventional Home Purchase Loans
C) Refinancings
D) Home Improvement Loans
F) Non-occupant Loans on < 5 Family Dwellings (A B C & D)
G) Loans On Manufactured Home Dwelling (A B C & D)
Number
Average Value
Number
Average Value
Number
Average Value
Number
Average Value
Number
Average Value
Number
Average Value
LOANS ORIGINATED
10
$134,185
68
$152,847
117
$148,742
44
$36,493
63
$155,017
7
$74,217
APPLICATIONS APPROVED, NOT ACCEPTED
3
$108,810
16
$117,497
23
$148,720
7
$130,693
4
$166,162
6
$88,902
APPLICATIONS DENIED
3
$140,033
20
$132,196
150
$129,631
34
$53,732
17
$153,848
23
$72,083
APPLICATIONS WITHDRAWN
1
$141,550
10
$126,057
59
$167,881
10
$101,853
14
$198,043
0
$0
FILES CLOSED FOR INCOMPLETENESS
0
$0
7
$176,491
10
$168,389
3
$24,367
3
$104,500
0
$0
Aggregated Statistics For Year 2006 (Based on 6 partial tracts)
A) FHA, FSA/RHS & VA Home Purchase Loans
B) Conventional Home Purchase Loans
C) Refinancings
D) Home Improvement Loans
E) Loans on Dwellings For 5+ Families
F) Non-occupant Loans on < 5 Family Dwellings (A B C & D)
G) Loans On Manufactured Home Dwelling (A B C & D)
Number
Average Value
Number
Average Value
Number
Average Value
Number
Average Value
Number
Average Value
Number
Average Value
Number
Average Value
LOANS ORIGINATED
19
$109,224
125
$150,814
154
$147,063
40
$54,680
0
$0
59
$185,091
9
$78,556
APPLICATIONS APPROVED, NOT ACCEPTED
0
$0
11
$196,042
27
$144,651
7
$97,114
0
$0
8
$166,338
1
$59,920
APPLICATIONS DENIED
1
$229,910
18
$112,464
85
$133,564
44
$36,110
1
$26,000
13
$92,667
6
$53,878
APPLICATIONS WITHDRAWN
3
$113,853
10
$160,756
55
$155,959
7
$55,683
0
$0
10
$170,692
3
$84,963
FILES CLOSED FOR INCOMPLETENESS
0
$0
4
$198,842
18
$168,076
1
$72,220
0
$0
6
$139,528
0
$0
Aggregated Statistics For Year 2005 (Based on 6 partial tracts)
A) FHA, FSA/RHS & VA Home Purchase Loans
B) Conventional Home Purchase Loans
C) Refinancings
D) Home Improvement Loans
F) Non-occupant Loans on < 5 Family Dwellings (A B C & D)
G) Loans On Manufactured Home Dwelling (A B C & D)
Number
Average Value
Number
Average Value
Number
Average Value
Number
Average Value
Number
Average Value
Number
Average Value
LOANS ORIGINATED
9
$90,138
116
$143,593
133
$125,118
33
$25,467
83
$148,866
10
$73,610
APPLICATIONS APPROVED, NOT ACCEPTED
3
$138,180
14
$138,891
27
$104,003
7
$33,503
4
$192,985
1
$192,110
APPLICATIONS DENIED
0
$0
35
$120,947
100
$113,779
31
$65,982
17
$191,804
11
$45,840
APPLICATIONS WITHDRAWN
0
$0
10
$131,537
81
$106,593
7
$54,996
8
$151,532
0
$0
FILES CLOSED FOR INCOMPLETENESS
0
$0
6
$128,610
17
$147,487
3
$419,327
1
$278,680
0
$0
Aggregated Statistics For Year 2004 (Based on 6 partial tracts)
A) FHA, FSA/RHS & VA Home Purchase Loans
B) Conventional Home Purchase Loans
C) Refinancings
D) Home Improvement Loans
E) Loans on Dwellings For 5+ Families
F) Non-occupant Loans on < 5 Family Dwellings (A B C & D)
G) Loans On Manufactured Home Dwelling (A B C & D)
Number
Average Value
Number
Average Value
Number
Average Value
Number
Average Value
Number
Average Value
Number
Average Value
Number
Average Value
LOANS ORIGINATED
10
$107,636
103
$136,876
154
$90,371
29
$35,360
1
$102,550
55
$136,336
7
$104,669
APPLICATIONS APPROVED, NOT ACCEPTED
0
$0
9
$121,333
43
$99,753
4
$141,592
0
$0
0
$0
0
$0
APPLICATIONS DENIED
0
$0
29
$111,240
99
$113,023
23
$37,103
0
$0
13
$183,213
4
$78,132
APPLICATIONS WITHDRAWN
1
$126,800
10
$115,224
58
$97,695
3
$60,720
0
$0
7
$74,447
4
$120,738
FILES CLOSED FOR INCOMPLETENESS
0
$0
1
$50,160
6
$97,337
1
$46,220
0
$0
1
$50,160
0
$0
Aggregated Statistics For Year 2003 (Based on 6 partial tracts)
A) FHA, FSA/RHS & VA Home Purchase Loans
B) Conventional Home Purchase Loans
C) Refinancings
D) Home Improvement Loans
F) Non-occupant Loans on < 5 Family Dwellings (A B C & D)
Number
Average Value
Number
Average Value
Number
Average Value
Number
Average Value
Number
Average Value
LOANS ORIGINATED
11
$99,234
103
$106,849
227
$99,177
17
$18,077
91
$119,482
APPLICATIONS APPROVED, NOT ACCEPTED
0
$0
8
$130,808
30
$115,913
3
$21,497
4
$102,415
APPLICATIONS DENIED
1
$91,960
25
$73,357
85
$79,139
17
$12,734
18
$77,693
APPLICATIONS WITHDRAWN
4
$91,618
17
$149,461
48
$86,776
3
$29,313
7
$138,941
FILES CLOSED FOR INCOMPLETENESS
0
$0
1
$220,160
14
$96,624
0
$0
1
$220,160
Aggregated Statistics For Year 1999 (Based on 1 full and 2 partial tracts)
A) FHA, FSA/RHS & VA Home Purchase Loans
B) Conventional Home Purchase Loans
C) Refinancings
D) Home Improvement Loans
F) Non-occupant Loans on < 5 Family Dwellings (A B C & D)
Detailed PMIC statistics for the following Tracts:0605.01
, 0605.02
2002 - 2018 National Fire Incident Reporting System (NFIRS) incidents
According to the data from the years 2002 - 2018 the average number of fire incidents per year is 12. The highest number of reported fires - 18 took place in 2008, and the least - 0 in 2003. The data has an increasing trend.
When looking into fire subcategories, the most incidents belonged to: Structure Fires (44.1%), and Outside Fires (37.1%).
Fire incident types reported to NFIRS in Zip Code 12835
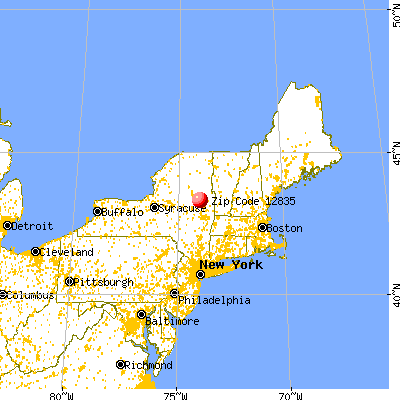


 Nearest zip codes: 12878, 12822, 12810, 12859, 12846, 12850.
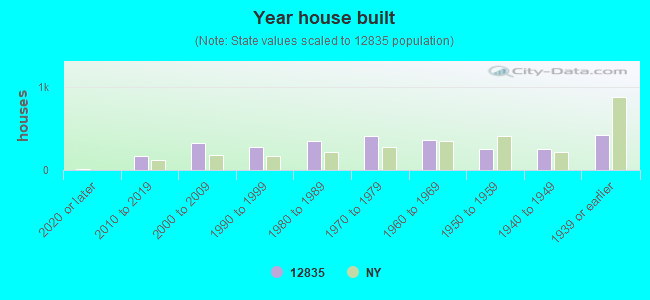


 According to the data from the years 2002 - 2018 the average number of fire incidents per year is 12. The highest number of reported fires - 18 took place in 2008, and the least - 0 in 2003. The data has an increasing trend.
 When looking into fire subcategories, the most incidents belonged to: Structure Fires (44.1%), and Outside Fires (37.1%).