Estimated zip code population in 2022: 2,336 Zip code population in 2010: 2,196 Zip code population in 2000: 2,121
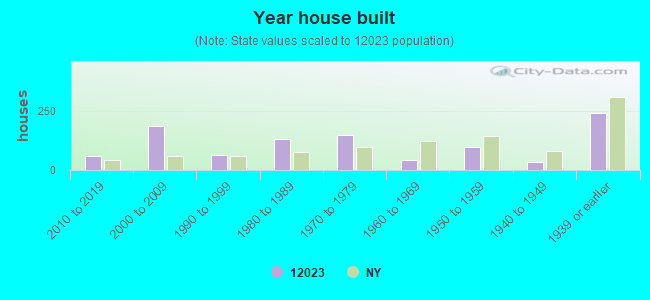
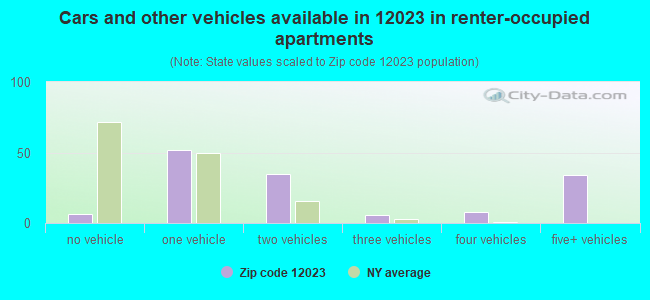
Houses and condos: 985 Renter-occupied apartments: 143
% of renters here:
17%
State:
46%
March 2022 cost of living index in zip code 12023: 95.3 (near average, U.S. average is 100)
Land area: 57.6 sq. mi. Water area: 0.3 sq. mi.
Population density: 41 people per square mile
(very low).
OSM Map
General Map
Google Map
MSN Map
OSM Map
General Map
Google Map
MSN Map
OSM Map
General Map
Google Map
MSN Map
OSM Map
General Map
Google Map
MSN Map
Please wait while loading the map...
Real estate property taxes paid for housing units in 2022:
This zip code:
1.9% ($4,955)
New York:
1.5% ($6,180)
Median real estate property taxes paid for housing units with mortgages in 2022: $4,913 (1.9%) Median real estate property taxes paid for housing units with no mortgage in 2022: $4,993 (2.0%)
Business Search- 14 Million verified businesses
Males: 1,217
(52.1%)
Females: 1,118
(47.9%)
For population 25 years and over in 12023:
High school or higher: 97.5%
Bachelor's degree or higher: 30.2%
Graduate or professional degree: 11.9%
Unemployed: 4.5%
Mean travel time to work (commute): 36.1 minutes
For population 15 years and over in 12023:
Never married: 27.7%
Now married: 63.0%
Separated: 1.7%
Widowed: 3.2%
Divorced: 4.4%
Zip code 12023 compared to state average:
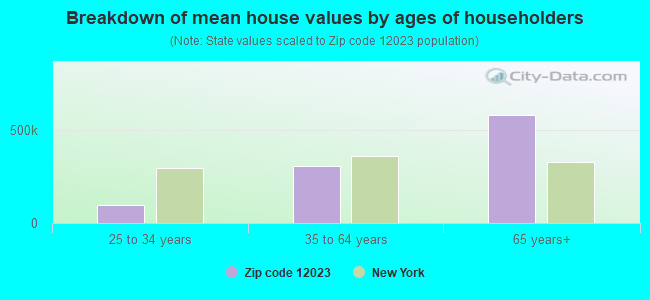
Median house value below state average.
Black race population percentage significantly below state average.
Hispanic race population percentage significantly below state average.
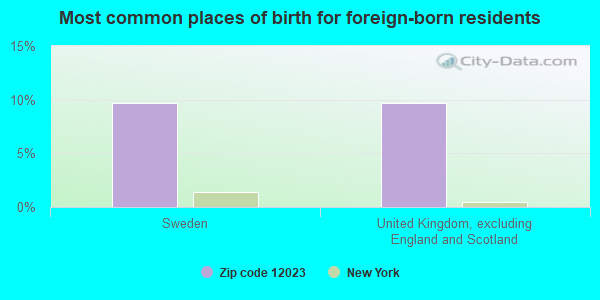
Foreign-born population percentage significantly below state average.
Renting percentage significantly below state average.
Estimated median house/condo value in 2022: $257,795
12023:
$257,795
New York:
$400,400
According to our research of New York and other state lists, there was 1 registered sex offender living in 12023 zip code as of May 24, 2024. The ratio of all residents to sex offenders in zip code 12023 is 2,163 to 1. The ratio of registered sex offenders to all residents in this zip code is lower than the state average.
Median resident age:
This zip code:
37.7 years
New York median age:
40.0 years
Average household size:
This zip code:
2.7 people
New York:
2.5 people
Averages for the 2020 tax year for zip code 12023, filed in 2021:
Average Adjusted Gross Income (AGI) in 2020: $67,272 (Individual Income Tax Returns)
Here:
$67,272
State:
$90,930
Salary/wage: $59,346 (reported on 75.7% of returns)
Here:
$59,346
State:
$72,104
(% of AGI for various income ranges: 1022.5% for AGIs below $25k, 3577.8% for AGIs $25k-50k, 6111.7% for AGIs $50k-75k, 8606.2% for AGIs $75k-100k, 13919.3% for AGIs $100k-200k)
Taxable interest for individuals: $428 (reported on 41.7% of returns)
This zip code:
$428
New York:
$3,075
(% of AGI for various income ranges: 16.9% for AGIs below $25k, 18.3% for AGIs $25k-50k, 22.5% for AGIs $50k-75k, 38.8% for AGIs $75k-100k, 44.0% for AGIs $100k-200k)
Ordinary dividends: $2,223 (reported on 21.4% of returns)
Here:
$2,223
State:
$11,095
(% of AGI for various income ranges: 36.2% for AGIs below $25k, 25.6% for AGIs $25k-50k, 44.2% for AGIs $50k-75k, 53.8% for AGIs $75k-100k, 192.7% for AGIs $100k-200k)
Net capital gain/loss in AGI: +$5,384 (reported on 18.4% of returns)
Here:
+$5,384
State:
+$44,925
(% of AGI for various income ranges: 35.0% for AGIs below $25k, 22.2% for AGIs $25k-50k, 102.5% for AGIs $50k-75k, 91.2% for AGIs $75k-100k, 487.3% for AGIs $100k-200k)
Profit/loss from business: +$10,531 (reported on 12.6% of returns)
Here:
+$10,531
State:
+$14,940
(% of AGI for various income ranges: 137.5% for AGIs below $25k, 159.2% for AGIs $50k-75k, 208.8% for AGIs $75k-100k, 527.3% for AGIs $100k-200k)
Taxable individual retirement arrangement distribution: $17,450 (reported on 9.7% of returns)
12023:
$17,450
New York:
$19,609
(% of AGI for various income ranges: 167.2% for AGIs $25k-50k, 373.3% for AGIs $50k-75k, 664.0% for AGIs $100k-200k)
Total itemized deductions: $25,140 (reported on 4.9% of returns)
Here:
$25,140
State:
$39,326
(% of AGI for various income ranges: 534.2% for AGIs $50k-75k, 410.7% for AGIs $100k-200k)
Charity contributions: $6,967 (reported on 2.9% of returns)
Here:
$6,967
State:
$15,420
(% of AGI for various income ranges: 261.2% for AGIs $75k-100k)
Taxes paid: $9,240 (reported on 4.9% of returns)
12023:
$9,240
State:
$9,183
(% of AGI for various income ranges: 212.5% for AGIs $50k-75k, 138.0% for AGIs $100k-200k)
Earned income credit: $1,970 (reported on 9.7% of returns)
Here:
$1,970
State:
$2,138
(% of AGI for various income ranges: 58.8% for AGIs below $25k, 57.2% for AGIs $25k-50k)
Percentage of individuals using paid preparers for their 2020 taxes: 94.2%
Here:
94%
State:
95%
(% for various income ranges: 92.0% for AGIs below $25k, 95.8% for AGIs $25k-50k, 94.1% for AGIs $50k-75k, 91.7% for AGIs $75k-100k, 95.5% for AGIs $100k-200k, 100.0% for AGIs over 200k)
Averages for the 2012 tax year for zip code 12023, filed in 2013:
Average Adjusted Gross Income (AGI) in 2012: $52,967 (Individual Income Tax Returns)
Here:
$52,967
State:
$77,088
Salary/wage: $48,124 (reported on 82.0% of returns)
Here:
$48,124
State:
$60,593
(% of AGI for various income ranges: 64.8% for AGIs below $25k, 78.3% for AGIs $25k-50k, 72.0% for AGIs $50k-75k, 72.3% for AGIs $75k-100k, 77.5% for AGIs $100k-200k)
Taxable interest for individuals: $450 (reported on 44.0% of returns)
This zip code:
$450
New York:
$3,125
(% of AGI for various income ranges: 1.3% for AGIs below $25k, 0.5% for AGIs $25k-50k, 0.4% for AGIs $50k-75k, 0.2% for AGIs $75k-100k, 0.2% for AGIs $100k-200k)
Ordinary dividends: $1,412 (reported on 24.0% of returns)
Here:
$1,412
State:
$10,299
(% of AGI for various income ranges: 1.5% for AGIs below $25k, 0.8% for AGIs $25k-50k, 0.5% for AGIs $50k-75k, 0.5% for AGIs $75k-100k, 0.5% for AGIs $100k-200k)
Net capital gain/loss in AGI: +$1,986 (reported on 14.0% of returns)
Here:
+$1,986
State:
+$42,474
(% of AGI for various income ranges: 1.0% for AGIs below $25k, 0.2% for AGIs $50k-75k, 0.3% for AGIs $75k-100k, 0.9% for AGIs $100k-200k)
Profit/loss from business: +$8,940 (reported on 15.0% of returns)
Here:
+$8,940
State:
+$16,168
(% of AGI for various income ranges: 3.3% for AGIs below $25k, 3.4% for AGIs $25k-50k, 3.0% for AGIs $50k-75k, 1.2% for AGIs $75k-100k, 2.4% for AGIs $100k-200k)
Taxable individual retirement arrangement distribution: $8,810 (reported on 10.0% of returns)
12023:
$8,810
New York:
$17,621
(% of AGI for various income ranges: 3.6% for AGIs below $25k, 3.8% for AGIs $25k-50k, 3.7% for AGIs $75k-100k)
Total itemized deductions: $17,859 (20% of AGI, reported on 34.0% of returns)
Here:
$17,859
State:
$34,985
Here:
20.0% of AGI
State:
21.3% of AGI
(% of AGI for various income ranges: 6.3% for AGIs below $25k, 6.0% for AGIs $25k-50k, 12.1% for AGIs $50k-75k, 13.1% for AGIs $75k-100k, 13.8% for AGIs $100k-200k)
Charity contributions: $1,932 (reported on 25.0% of returns)
Here:
$1,932
State:
$5,572
(% of AGI for various income ranges: 0.5% for AGIs $25k-50k, 1.0% for AGIs $50k-75k, 1.0% for AGIs $75k-100k, 1.2% for AGIs $100k-200k)
Taxes paid: $9,132 (reported on 34.0% of returns)
12023:
$9,132
State:
$18,656
(% of AGI for various income ranges: 2.3% for AGIs below $25k, 2.6% for AGIs $25k-50k, 5.4% for AGIs $50k-75k, 6.5% for AGIs $75k-100k, 8.0% for AGIs $100k-200k)
Earned income credit: $2,100 (reported on 12.0% of returns)
Here:
$2,100
State:
$2,230
(% of AGI for various income ranges: 3.8% for AGIs below $25k, 1.0% for AGIs $25k-50k)
Percentage of individuals using paid preparers for their 2012 taxes: 50.0%
Here:
50%
State:
66%
(% for various income ranges: 41.2% for AGIs below $25k, 54.2% for AGIs $25k-50k, 50.0% for AGIs $50k-75k, 58.3% for AGIs $75k-100k, 57.1% for AGIs $100k-200k)
Averages for the 2004 tax year for zip code 12023, filed in 2005:
Average Adjusted Gross Income (AGI) in 2004: $41,739 (Individual Income Tax Returns)
Here:
$41,739
State:
$59,519
Salary/wage: $39,453 (reported on 84.0% of returns)
Here:
$39,453
State:
$50,673
(% of AGI for various income ranges: 81.6% for AGIs below $10k, 65.4% for AGIs $10k-25k, 80.4% for AGIs $25k-50k, 77.6% for AGIs $50k-75k, 82.6% for AGIs $75k-100k, 82.9% for AGIs over 100k)
Taxable interest for individuals: $733 (reported on 57.2% of returns)
This zip code:
$733
New York:
$2,377
(% of AGI for various income ranges: 8.6% for AGIs below $10k, 1.7% for AGIs $10k-25k, 0.8% for AGIs $25k-50k, 0.7% for AGIs $50k-75k, 1.0% for AGIs $75k-100k, 0.7% for AGIs over 100k)
Taxable dividends: $1,327 (reported on 26.6% of returns)
Here:
$1,327
State:
$5,394
(% of AGI for various income ranges: 1.6% for AGIs below $10k, 2.1% for AGIs $10k-25k, 1.1% for AGIs $25k-50k, 0.5% for AGIs $50k-75k, 0.7% for AGIs $75k-100k, 0.5% for AGIs over 100k)
Net capital gain/loss: +$2,293 (reported on 20.3% of returns)
Here:
+$2,293
State:
+$23,581
(% of AGI for various income ranges: -1.6% for AGIs below $10k, 4.1% for AGIs $10k-25k, 0.6% for AGIs $25k-50k, 1.1% for AGIs $50k-75k, 0.6% for AGIs $75k-100k, 1.2% for AGIs over 100k)
Profit/loss from business: +$5,329 (reported on 16.0% of returns)
Here:
+$5,329
State:
+$13,809
(% of AGI for various income ranges: 9.9% for AGIs below $10k, 2.1% for AGIs $10k-25k, 2.1% for AGIs $25k-50k, 1.2% for AGIs $50k-75k, 3.7% for AGIs $75k-100k, 0.4% for AGIs over 100k)
IRA payment deduction: $2,407 (reported on 2.6% of returns)
12023:
$2,407
New York:
$3,115
Total itemized deductions: $15,099 (21% of AGI, reported on 32.6% of returns)
Here:
$15,099
State:
$25,864
Here:
21.4% of AGI
State:
21.9% of AGI
(% of AGI for various income ranges: 8.9% for AGIs $10k-25k, 10.2% for AGIs $25k-50k, 11.7% for AGIs $50k-75k, 12.9% for AGIs $75k-100k, 15.1% for AGIs over 100k)
Charity contributions deductions: $1,873 (3% of AGI, reported on 28.5% of returns)
Here:
$1,873
State:
$4,439
Here:
2.5% of AGI
State:
3.6% of AGI
(% of AGI for various income ranges: 0.7% for AGIs $10k-25k, 1.3% for AGIs $25k-50k, 1.1% for AGIs $50k-75k, 1.1% for AGIs $75k-100k, 2.1% for AGIs over 100k)
Total tax: $4,893 (reported on 80.4% of returns)
12023:
$4,893
State:
$11,730
(% of AGI for various income ranges: 2.7% for AGIs below $10k, 5.0% for AGIs $10k-25k, 6.9% for AGIs $25k-50k, 8.7% for AGIs $50k-75k, 10.4% for AGIs $75k-100k, 15.0% for AGIs over 100k)
Earned income credit: $1,462 (reported on 10.4% of returns)
Here:
$1,462
State:
$1,757
Percentage of individuals using paid preparers for their 2004 taxes: 53.7%
Here:
54%
State:
67%
(% for various income ranges: 42.8% for AGIs below $10k, 54.4% for AGIs $10k-25k, 53.2% for AGIs $25k-50k, 64.9% for AGIs $50k-75k, 53.3% for AGIs $75k-100k, 58.1% for AGIs over 100k)
Household received Food Stamps/SNAP in the past 12 months: 65 Household did not receive Food Stamps/SNAP in the past 12 months: 792
Women who had a birth in the past 12 months: 37 (34 now married, 3 unmarried) Women who did not have a birth in the past 12 months: 431 (187 now married, 242 unmarried)
Housing units in zip code 12023 with a mortgage: 382 (33 second mortgage, 34 both second mortgage and home equity loan) Houses without a mortgage: 10
Median monthly owner costs for units with a mortgage: $1,688 Median monthly owner costs for units without a mortgage: $716
Residents with income below the poverty level in 2022:
This zip code:
2.0%
Whole state:
14.3%
Residents with income below 50% of the poverty level in 2022:
This zip code:
1.0%
Whole state:
6.8%
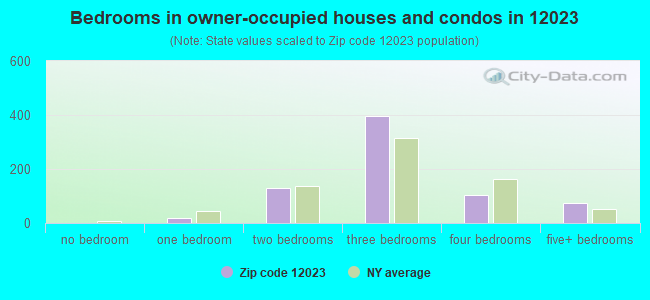
Median number of rooms in houses and condos:
Here:
6.2
State:
6.3
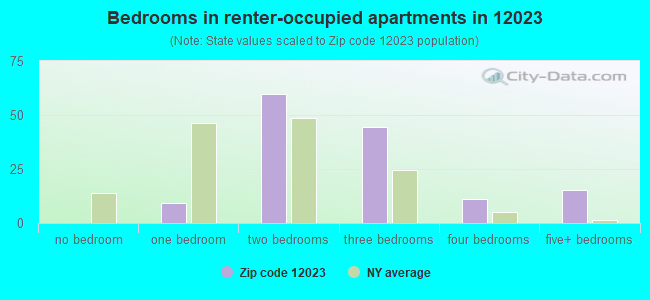
Median number of rooms in apartments:
Here:
5.8
State:
3.8
Notable locations in this zip code not listed on our city pages
Notable locations in zip code 12023: Shoefelt Corners (A), Zucks Corners (B), Morning Fog Farm (C), Elk Hill Winery (D). Display/hide their locations on the map
Cemeteries: Rural Cemetery (1), Berne Cemetery (2), Woodlawn Cemetery (3), Zimmer Cemetery (4), Gifford Hollow Burying Ground (5). Display/hide their locations on the map
Size of family households: 345 2-persons, 143 3-persons, 88 4-persons, 46 5-persons, 53 6-persons, 13 7-or-more-persons
Size of nonfamily households: 146 1-person, 23 2-persons
333 married couples with children.
161 single-parent households (43 men, 118 women).
99.5% of residents of 12023 zip code speak English at home.
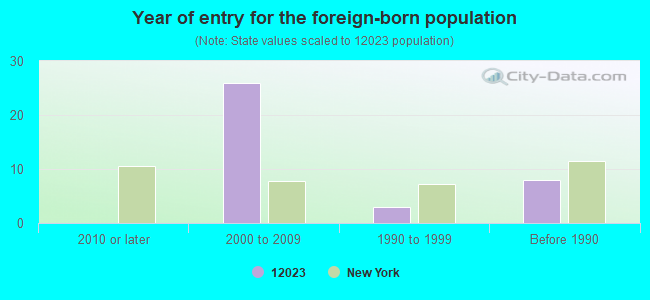
Foreign born population: 32 (1.4%) (88.1% of them are naturalized citizens)
This zip code:
1.4%
Whole state:
22.7%
10%Sweden
10%United Kingdom, excluding England and Scotland
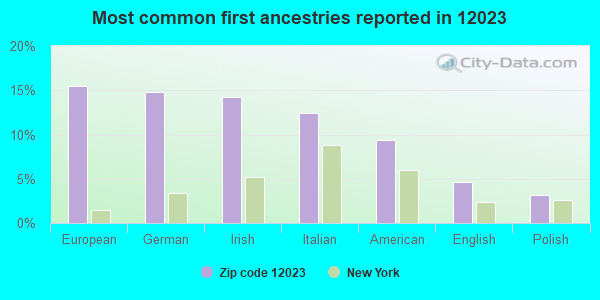
15%European
15%German
14%Irish
12%Italian
9%American
5%English
3%Polish
Year of entry for the foreign-born population
02010 or later
262000 to 2009
31990 to 1999
8Before 1990
Facilities with environmental interests located in this zip code:
BERNE-KNOX-WESTERLO ES ( in BERNE, NY)
(National Center for Education Statistics) - STATE ID-010201040002 Organizations: BERNE-KNOX-WESTERLO CSD (SCHOOL DISTRICT)
BERNE-KNOX-WESTERLO JSHS ( in BERNE, NY)
(National Center for Education Statistics) - STATE ID-010201040001 Organizations: BERNE-KNOX-WESTERLO CSD (SCHOOL DISTRICT)
BERNE KNOX WESTERLO SCHOOLS (2021 HELDERBERG TRAIL in BERNE, NY)
COMPLIANCE ACTIVITY (Tracking inspections of insecticide, fungicide, and rodenticide, and toxic substances) Conditionally Exempt Small Quantity Generators, less than 100 kg/month of hazardous waste (Resource Conservation and Recovery Act (tracking hazardous waste)) - notification Organizations: ROBERT E DRAKE (CONTACT/OWNER)
Alternative names: BERNE CENTRAL SCHOOL DISTRICT
BERNE-KNOX WESTLO SCHOOL BUS DISTRICT (1769 HELDERBERG TRAIL in BERNE, NY)
ENFORCEMENT/COMPLIANCE ACTIVITY (Integrated Compliance Information System)
Housing units lacking complete plumbing facilities: 5.0% Housing units lacking complete kitchen facilities: 4.3%
40.0%Fuel oil, kerosene, etc.
19.6%Wood
18.1%Bottled, tank, or LP gas
12.0%Coal or coke
6.6%Electricity
2.1%Other fuel
1.2%Utility gas
0.7%No fuel used
Population in 1990: 2,293.
Place of birth for U.S.-born residents:
This state: 1,995
Northeast: 130
Midwest: 43
South: 88
West: 29
78% of the 12023 zip code residents lived in the same house 5 years ago. Out of people who lived in different houses, 62% lived in this county. Out of people who lived in different counties, 50% lived in New York.
89% of the 12023 zip code residents lived in the same house 1 year ago. Out of people who lived in different houses, 69% moved from this county. Out of people who lived in different houses, 22% moved from different county within same state. Out of people who lived in different houses, 7% moved from different state.
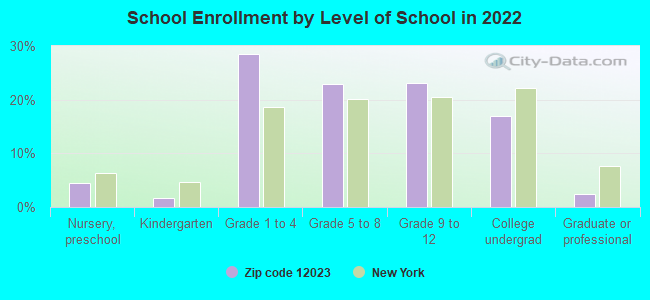
Private vs. public school enrollment:
Students in private schools in grades 1 to 8 (elementary and middle school): 33
Here:
11.9%
New York:
15.6%
Students in private schools in grades 9 to 12 (high school): 13
Here:
10.8%
New York:
15.0%
Students in private undergraduate colleges: 6
Here:
7.5%
New York:
39.2%
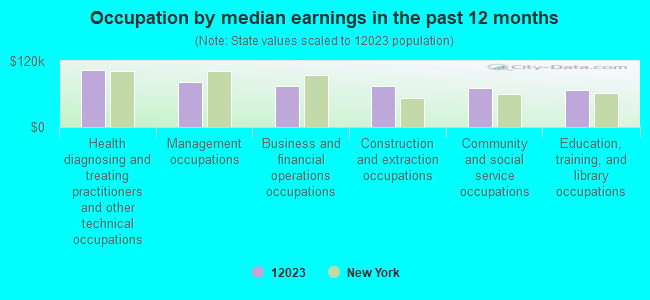
Occupation by median earnings in the past 12 months ($)
103,826Health diagnosing and treating practitioners and other technical occupations
81,374Management occupations
75,385Business and financial operations occupations
73,837Construction and extraction occupations
70,284Community and social service occupations
67,734Education, training, and library occupations
Top industries in this zip code by the number of employees in 2005:
Accommodation and Food Services: Full-Service Restaurants (10-19 employees: 1 establishment)
Health Care and Social Assistance: Offices of Physicians (except Mental Health Specialists) (10-19: 1)
Other Services (except Public Administration): Environment, Conservation and Wildlife Organizations (5-9: 1)
Construction: New Single-Family Housing Construction (except Operative Builders) (1-4: 2)
Finance and Insurance: Insurance Agencies and Brokerages (1-4: 1)
Health Care and Social Assistance: Home Health Care Services (1-4: 1)
Fatal accident statistics in 2012:
Fatal accident count: 1
Vehicles involved in fatal accidents: 1
Fatal accidents caused by drunken drivers: 0
Fatalities: 1
Persons involved in fatal accidents: 1
Pedestrians involved in fatal accidents: 0
Home Mortgage Disclosure Act Aggregated Statistics For Year 2009 (Based on 6 partial tracts)
A) FHA, FSA/RHS & VA Home Purchase Loans
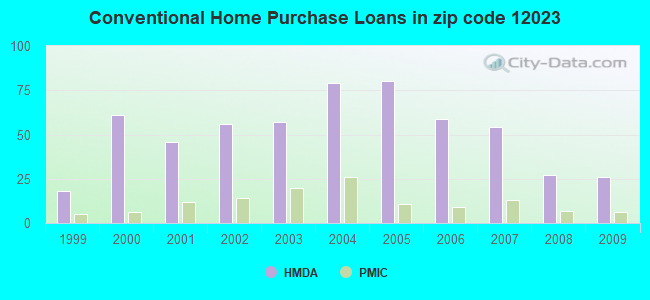
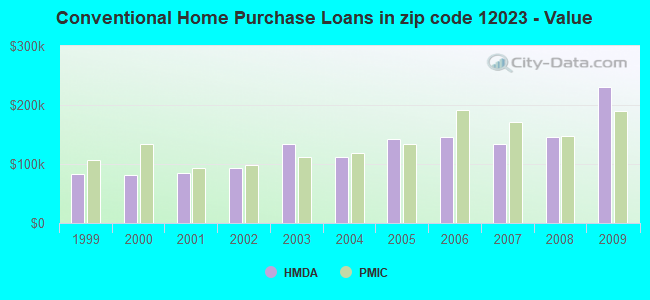
B) Conventional Home Purchase Loans
C) Refinancings
D) Home Improvement Loans
F) Non-occupant Loans on < 5 Family Dwellings (A B C & D)
G) Loans On Manufactured Home Dwelling (A B C & D)
Number
Average Value
Number
Average Value
Number
Average Value
Number
Average Value
Number
Average Value
Number
Average Value
LOANS ORIGINATED
20
$150,808
26
$230,627
108
$140,912
10
$39,287
6
$463,230
4
$36,888
APPLICATIONS APPROVED, NOT ACCEPTED
1
$114,690
3
$36,120
22
$150,548
1
$85,070
0
$0
3
$35,497
APPLICATIONS DENIED
3
$144,510
10
$44,744
31
$168,026
10
$39,938
2
$161,905
11
$35,825
APPLICATIONS WITHDRAWN
2
$121,375
2
$235,280
22
$140,506
1
$43,680
0
$0
1
$136,520
FILES CLOSED FOR INCOMPLETENESS
0
$0
0
$0
4
$163,940
1
$104,480
0
$0
0
$0
Aggregated Statistics For Year 2008 (Based on 6 partial tracts)
A) FHA, FSA/RHS & VA Home Purchase Loans
B) Conventional Home Purchase Loans
C) Refinancings
D) Home Improvement Loans
F) Non-occupant Loans on < 5 Family Dwellings (A B C & D)
G) Loans On Manufactured Home Dwelling (A B C & D)
Number
Average Value
Number
Average Value
Number
Average Value
Number
Average Value
Number
Average Value
Number
Average Value
LOANS ORIGINATED
8
$161,575
27
$145,284
70
$119,610
27
$59,481
4
$129,673
6
$41,875
APPLICATIONS APPROVED, NOT ACCEPTED
1
$107,530
7
$109,104
9
$137,499
7
$254,069
0
$0
4
$71,465
APPLICATIONS DENIED
1
$163,050
10
$90,353
42
$152,537
20
$52,722
2
$120,705
7
$62,690
APPLICATIONS WITHDRAWN
0
$0
3
$111,170
21
$159,668
3
$108,337
1
$59,220
0
$0
FILES CLOSED FOR INCOMPLETENESS
0
$0
1
$139,510
11
$162,137
0
$0
0
$0
0
$0
Aggregated Statistics For Year 2007 (Based on 6 partial tracts)
A) FHA, FSA/RHS & VA Home Purchase Loans
B) Conventional Home Purchase Loans
C) Refinancings
D) Home Improvement Loans
E) Loans on Dwellings For 5+ Families
F) Non-occupant Loans on < 5 Family Dwellings (A B C & D)
G) Loans On Manufactured Home Dwelling (A B C & D)
Number
Average Value
Number
Average Value
Number
Average Value
Number
Average Value
Number
Average Value
Number
Average Value
Number
Average Value
LOANS ORIGINATED
8
$144,070
54
$134,269
71
$142,541
26
$61,667
2
$254,905
6
$82,065
12
$62,020
APPLICATIONS APPROVED, NOT ACCEPTED
0
$0
8
$157,578
21
$118,018
3
$70,940
0
$0
1
$63,750
5
$70,052
APPLICATIONS DENIED
0
$0
21
$118,214
83
$152,170
28
$76,169
0
$0
10
$148,877
9
$40,811
APPLICATIONS WITHDRAWN
0
$0
3
$258,357
30
$174,372
2
$61,040
0
$0
1
$198,480
0
$0
FILES CLOSED FOR INCOMPLETENESS
0
$0
4
$93,608
7
$173,379
1
$28,370
0
$0
1
$114,550
0
$0
Aggregated Statistics For Year 2006 (Based on 6 partial tracts)
A) FHA, FSA/RHS & VA Home Purchase Loans
B) Conventional Home Purchase Loans
C) Refinancings
D) Home Improvement Loans
F) Non-occupant Loans on < 5 Family Dwellings (A B C & D)
G) Loans On Manufactured Home Dwelling (A B C & D)
Number
Average Value
Number
Average Value
Number
Average Value
Number
Average Value
Number
Average Value
Number
Average Value
LOANS ORIGINATED
4
$115,175
59
$145,114
94
$115,929
25
$50,197
9
$128,612
7
$68,257
APPLICATIONS APPROVED, NOT ACCEPTED
0
$0
12
$105,616
28
$107,120
6
$87,723
1
$69,960
5
$63,896
APPLICATIONS DENIED
1
$79,400
15
$120,271
98
$119,239
29
$51,069
4
$238,885
9
$48,316
APPLICATIONS WITHDRAWN
1
$91,110
8
$203,676
54
$125,880
2
$55,450
3
$83,187
1
$34,780
FILES CLOSED FOR INCOMPLETENESS
0
$0
5
$166,062
18
$137,139
0
$0
0
$0
0
$0
Aggregated Statistics For Year 2005 (Based on 6 partial tracts)
A) FHA, FSA/RHS & VA Home Purchase Loans
B) Conventional Home Purchase Loans
C) Refinancings
D) Home Improvement Loans
E) Loans on Dwellings For 5+ Families
F) Non-occupant Loans on < 5 Family Dwellings (A B C & D)
G) Loans On Manufactured Home Dwelling (A B C & D)
Number
Average Value
Number
Average Value
Number
Average Value
Number
Average Value
Number
Average Value
Number
Average Value
Number
Average Value
LOANS ORIGINATED
6
$109,102
80
$143,173
113
$110,477
34
$44,501
1
$230,740
18
$107,908
6
$66,395
APPLICATIONS APPROVED, NOT ACCEPTED
1
$121,850
10
$100,460
21
$97,049
7
$48,046
0
$0
2
$148,660
3
$36,827
APPLICATIONS DENIED
2
$106,510
16
$95,491
93
$124,210
24
$53,487
0
$0
8
$92,632
11
$55,505
APPLICATIONS WITHDRAWN
2
$218,770
10
$117,989
69
$123,444
12
$113,388
0
$0
1
$27,880
2
$279,865
FILES CLOSED FOR INCOMPLETENESS
0
$0
6
$171,998
19
$142,535
1
$39,770
0
$0
0
$0
0
$0
Aggregated Statistics For Year 2004 (Based on 6 partial tracts)
A) FHA, FSA/RHS & VA Home Purchase Loans
B) Conventional Home Purchase Loans
C) Refinancings
D) Home Improvement Loans
F) Non-occupant Loans on < 5 Family Dwellings (A B C & D)
G) Loans On Manufactured Home Dwelling (A B C & D)
Number
Average Value
Number
Average Value
Number
Average Value
Number
Average Value
Number
Average Value
Number
Average Value
LOANS ORIGINATED
10
$104,483
79
$111,978
104
$98,761
19
$35,516
9
$88,513
6
$58,798
APPLICATIONS APPROVED, NOT ACCEPTED
2
$69,835
12
$103,147
29
$103,867
4
$47,138
1
$171,000
2
$91,090
APPLICATIONS DENIED
1
$104,070
14
$60,481
68
$98,364
21
$28,718
4
$57,252
10
$38,611
APPLICATIONS WITHDRAWN
2
$104,450
7
$116,010
58
$111,534
4
$43,962
3
$182,863
0
$0
FILES CLOSED FOR INCOMPLETENESS
0
$0
3
$203,190
12
$117,079
3
$19,033
1
$187,440
0
$0
Aggregated Statistics For Year 2003 (Based on 6 partial tracts)
A) FHA, FSA/RHS & VA Home Purchase Loans
B) Conventional Home Purchase Loans
C) Refinancings
D) Home Improvement Loans
E) Loans on Dwellings For 5+ Families
F) Non-occupant Loans on < 5 Family Dwellings (A B C & D)
Number
Average Value
Number
Average Value
Number
Average Value
Number
Average Value
Number
Average Value
Number
Average Value
LOANS ORIGINATED
10
$100,792
57
$134,041
190
$98,444
5
$31,180
1
$137,320
13
$110,580
APPLICATIONS APPROVED, NOT ACCEPTED
1
$115,060
7
$73,961
43
$100,163
2
$28,940
0
$0
2
$73,545
APPLICATIONS DENIED
0
$0
12
$80,166
89
$93,434
9
$24,979
0
$0
4
$92,740
APPLICATIONS WITHDRAWN
3
$82,403
5
$105,222
52
$103,328
1
$24,180
0
$0
2
$51,575
FILES CLOSED FOR INCOMPLETENESS
0
$0
0
$0
5
$140,656
0
$0
0
$0
0
$0
Aggregated Statistics For Year 2002 (Based on 6 partial tracts)
A) FHA, FSA/RHS & VA Home Purchase Loans
B) Conventional Home Purchase Loans
C) Refinancings
D) Home Improvement Loans
F) Non-occupant Loans on < 5 Family Dwellings (A B C & D)
Number
Average Value
Number
Average Value
Number
Average Value
Number
Average Value
Number
Average Value
LOANS ORIGINATED
9
$91,719
56
$92,443
97
$91,310
7
$31,569
8
$61,129
APPLICATIONS APPROVED, NOT ACCEPTED
1
$38,180
6
$93,393
22
$81,870
1
$14,420
2
$90,985
APPLICATIONS DENIED
3
$99,893
20
$54,335
54
$86,508
9
$19,720
3
$63,230
APPLICATIONS WITHDRAWN
1
$89,690
8
$84,845
32
$82,031
4
$35,542
4
$64,108
FILES CLOSED FOR INCOMPLETENESS
0
$0
1
$48,660
3
$82,483
0
$0
0
$0
Aggregated Statistics For Year 2001 (Based on 6 partial tracts)
A) FHA, FSA/RHS & VA Home Purchase Loans
B) Conventional Home Purchase Loans
C) Refinancings
D) Home Improvement Loans
E) Loans on Dwellings For 5+ Families
F) Non-occupant Loans on < 5 Family Dwellings (A B C & D)
Number
Average Value
Number
Average Value
Number
Average Value
Number
Average Value
Number
Average Value
Number
Average Value
LOANS ORIGINATED
18
$84,195
46
$84,275
93
$84,473
18
$14,964
0
$0
6
$99,253
APPLICATIONS APPROVED, NOT ACCEPTED
0
$0
11
$54,961
17
$71,381
3
$22,130
0
$0
1
$125,780
APPLICATIONS DENIED
1
$77,870
19
$44,202
60
$67,819
13
$20,338
1
$69,220
2
$54,480
APPLICATIONS WITHDRAWN
2
$72,770
2
$75,545
40
$81,251
5
$28,000
0
$0
0
$0
FILES CLOSED FOR INCOMPLETENESS
0
$0
0
$0
3
$104,297
0
$0
0
$0
0
$0
Aggregated Statistics For Year 2000 (Based on 6 partial tracts)
A) FHA, FSA/RHS & VA Home Purchase Loans
B) Conventional Home Purchase Loans
C) Refinancings
D) Home Improvement Loans
E) Loans on Dwellings For 5+ Families
F) Non-occupant Loans on < 5 Family Dwellings (A B C & D)
Number
Average Value
Number
Average Value
Number
Average Value
Number
Average Value
Number
Average Value
Number
Average Value
LOANS ORIGINATED
14
$80,130
61
$81,433
42
$63,025
25
$18,198
1
$65,080
7
$80,744
APPLICATIONS APPROVED, NOT ACCEPTED
3
$75,177
7
$26,800
13
$68,257
7
$28,847
0
$0
0
$0
APPLICATIONS DENIED
4
$48,580
47
$44,506
47
$58,527
17
$22,696
0
$0
2
$39,390
APPLICATIONS WITHDRAWN
4
$64,652
3
$52,907
32
$73,006
3
$28,790
1
$38,460
1
$92,150
FILES CLOSED FOR INCOMPLETENESS
0
$0
1
$84,200
9
$66,670
0
$0
0
$0
0
$0
Aggregated Statistics For Year 1999 (Based on 3 partial tracts)
A) FHA, FSA/RHS & VA Home Purchase Loans
B) Conventional Home Purchase Loans
C) Refinancings
D) Home Improvement Loans
F) Non-occupant Loans on < 5 Family Dwellings (A B C & D)

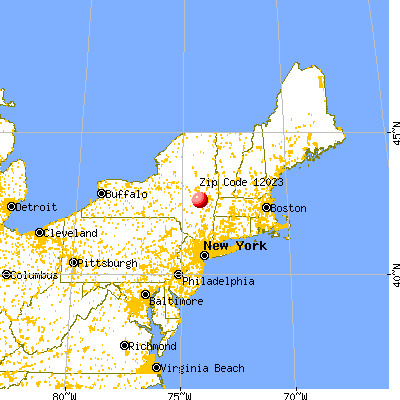


 Nearest zip codes: 12147, 12059, 12157, 12120, 12122, 12193.