Estimated zip code population in 2022: 7,980 Zip code population in 2010: 7,618 Zip code population in 2000: 7,431
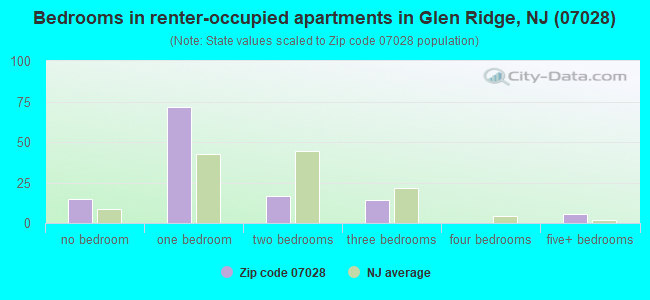
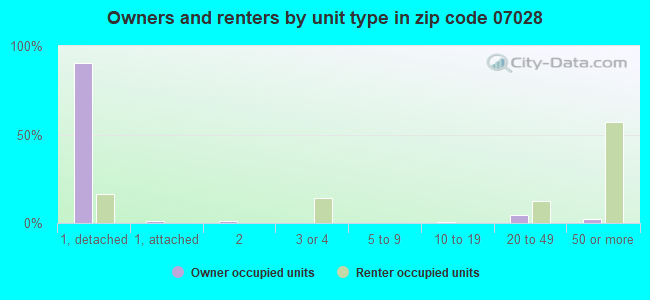
Houses and condos: 2,559 Renter-occupied apartments: 121
% of renters here:
5%
State:
35%
March 2022 cost of living index in zip code 07028: 112.9 (more than average, U.S. average is 100)
Land area: 1.3 sq. mi. Water area: 0.0 sq. mi.
Population density: 6,166 people per square mile
(high).
OSM Map
Google Map
MSN Map
OSM Map
General Map
Google Map
MSN Map
OSM Map
Google Map
MSN Map
OSM Map
Google Map
MSN Map
Please wait while loading the map...
Real estate property taxes paid for housing units in 2022:
This zip code:
1.3% ($9,521)
New Jersey:
2.1% ($8,897)
Median real estate property taxes paid for housing units with mortgages in 2022: $9,557 (1.2%) Median real estate property taxes paid for housing units with no mortgage in 2022: $9,483 (1.4%)
Business Search- 14 Million verified businesses
Males: 3,632
(45.5%)
Females: 4,347
(54.5%)
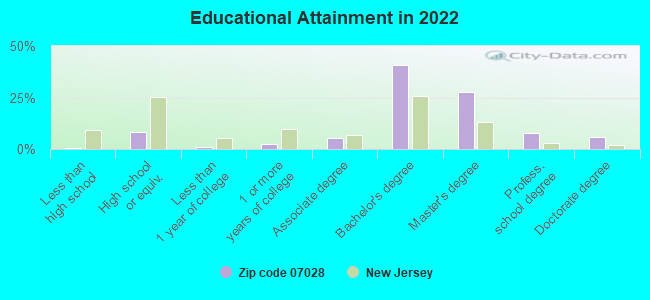
For population 25 years and over in 07028:
High school or higher: 101.7%
Bachelor's degree or higher: 84.2%
Graduate or professional degree: 42.6%
Unemployed: 5.6%
Mean travel time to work (commute): 36.6 minutes
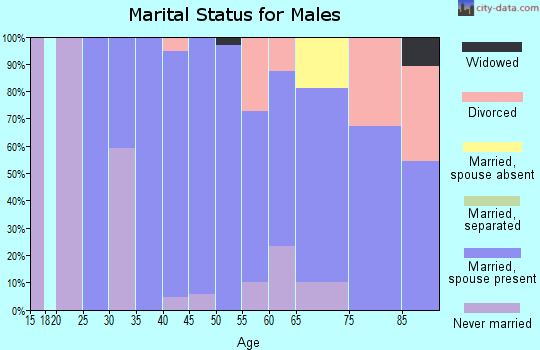
For population 15 years and over in 07028:
Never married: 24.4%
Now married: 69.0%
Separated: 1.1%
Widowed: 1.8%
Divorced: 3.7%
Zip code 07028 compared to state average:
Median household income significantly above state average.
Median house value above state average.
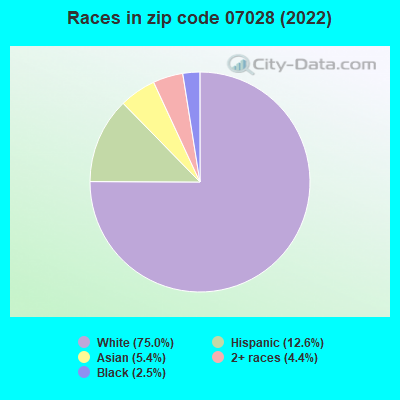
Black race population percentage significantly below state average.
Foreign-born population percentage below state average.
Renting percentage significantly below state average.
Length of stay since moving in significantly above state average.
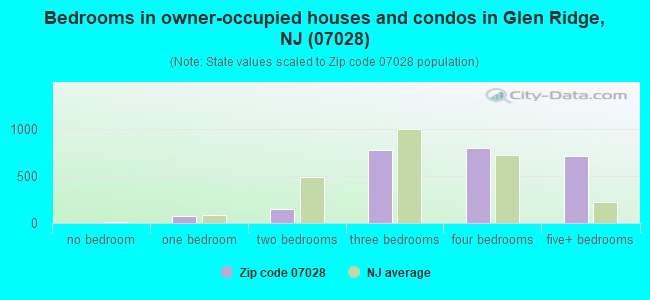
Number of rooms per house above state average.
House age above state average.
Percentage of population with a bachelor's degree or higher above state average.
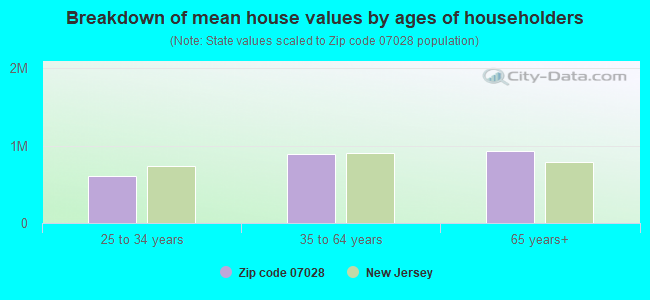
Estimated median house/condo value in 2022: $740,584
07028:
$740,584
New Jersey:
$428,900
Median resident age:
This zip code:
41.5 years
New Jersey median age:
40.4 years
Average household size:
This zip code:
3.1 people
New Jersey:
2.6 people
Averages for the 2020 tax year for zip code 07028, filed in 2021:
Average Adjusted Gross Income (AGI) in 2020: $285,301 (Individual Income Tax Returns)
Here:
$285,301
State:
$95,247
Salary/wage: $245,170 (reported on 82.0% of returns)
Here:
$245,170
State:
$80,635
(% of AGI for various income ranges: 1181.2% for AGIs below $25k, 3632.7% for AGIs $25k-50k, 7324.0% for AGIs $50k-75k, 9830.8% for AGIs $75k-100k, 21412.8% for AGIs $100k-200k, 138717.8% for AGIs over 200k)
Taxable interest for individuals: $2,941 (reported on 57.7% of returns)
This zip code:
$2,941
New Jersey:
$2,414
(% of AGI for various income ranges: 37.5% for AGIs below $25k, 60.7% for AGIs $25k-50k, 76.7% for AGIs $50k-75k, 104.6% for AGIs $75k-100k, 298.1% for AGIs $100k-200k, 1039.3% for AGIs over 200k)
Ordinary dividends: $10,802 (reported on 57.7% of returns)
Here:
$10,802
State:
$8,057
(% of AGI for various income ranges: 119.2% for AGIs below $25k, 245.3% for AGIs $25k-50k, 358.0% for AGIs $50k-75k, 538.5% for AGIs $75k-100k, 913.1% for AGIs $100k-200k, 3884.6% for AGIs over 200k)
Net capital gain/loss in AGI: +$55,827 (reported on 52.0% of returns)
Here:
+$55,827
State:
+$25,022
(% of AGI for various income ranges: 205.0% for AGIs below $25k, 177.3% for AGIs $25k-50k, 358.0% for AGIs $50k-75k, 332.3% for AGIs $75k-100k, 938.4% for AGIs $100k-200k, 22402.7% for AGIs over 200k)
Profit/loss from business: +$40,274 (reported on 23.1% of returns)
Here:
+$40,274
State:
+$18,035
(% of AGI for various income ranges: 152.5% for AGIs below $25k, 376.0% for AGIs $25k-50k, 586.0% for AGIs $50k-75k, 907.7% for AGIs $75k-100k, 1606.2% for AGIs $100k-200k, 5581.0% for AGIs over 200k)
Taxable individual retirement arrangement distribution: $34,716 (reported on 11.4% of returns)
07028:
$34,716
New Jersey:
$21,558
(% of AGI for various income ranges: 79.2% for AGIs below $25k, 290.7% for AGIs $25k-50k, 339.3% for AGIs $50k-75k, 510.0% for AGIs $75k-100k, 776.2% for AGIs $100k-200k, 2173.2% for AGIs over 200k)
Self-employed (Keogh) retirement plans: $39,840 (reported on 4.5% of returns)
07028:
$39,840
New Jersey:
$30,844
(% of AGI for various income ranges: 117.2% for AGIs $100k-200k, 1366.1% for AGIs over 200k)
Total itemized deductions: $42,408 (reported on 36.9% of returns)
Here:
$42,408
State:
$32,863
(% of AGI for various income ranges: 840.0% for AGIs $25k-50k, 973.3% for AGIs $50k-75k, 1714.6% for AGIs $75k-100k, 2070.0% for AGIs $100k-200k, 9899.8% for AGIs over 200k)
Charity contributions: $13,441 (reported on 32.4% of returns)
Here:
$13,441
State:
$7,880
(% of AGI for various income ranges: 54.0% for AGIs $25k-50k, 90.0% for AGIs $50k-75k, 196.9% for AGIs $75k-100k, 231.9% for AGIs $100k-200k, 3244.4% for AGIs over 200k)
Taxes paid: $9,711 (reported on 36.9% of returns)
07028:
$9,711
State:
$9,183
(% of AGI for various income ranges: 286.0% for AGIs $25k-50k, 354.0% for AGIs $50k-75k, 579.2% for AGIs $75k-100k, 693.4% for AGIs $100k-200k, 1954.4% for AGIs over 200k)
Earned income credit: $1,345 (reported on 3.3% of returns)
Here:
$1,345
State:
$2,148
(% of AGI for various income ranges: 40.4% for AGIs below $25k, 34.0% for AGIs $25k-50k)
Percentage of individuals using paid preparers for their 2020 taxes: 93.4%
Here:
93%
State:
92%
(% for various income ranges: 91.1% for AGIs below $25k, 88.5% for AGIs $25k-50k, 92.6% for AGIs $50k-75k, 91.7% for AGIs $75k-100k, 92.3% for AGIs $100k-200k, 96.3% for AGIs over 200k)
Averages for the 2012 tax year for zip code 07028, filed in 2013:
Average Adjusted Gross Income (AGI) in 2012: $188,902 (Individual Income Tax Returns)
Here:
$188,902
State:
$79,688
Salary/wage: $163,449 (reported on 83.3% of returns)
Here:
$163,449
State:
$68,122
(% of AGI for various income ranges: 64.1% for AGIs below $25k, 69.0% for AGIs $25k-50k, 65.8% for AGIs $50k-75k, 63.0% for AGIs $75k-100k, 77.4% for AGIs $100k-200k, 71.7% for AGIs over 200k)
Taxable interest for individuals: $2,500 (reported on 58.8% of returns)
This zip code:
$2,500
New Jersey:
$2,193
(% of AGI for various income ranges: 3.2% for AGIs below $25k, 1.1% for AGIs $25k-50k, 0.9% for AGIs $50k-75k, 0.8% for AGIs $75k-100k, 0.9% for AGIs $100k-200k, 0.7% for AGIs over 200k)
Ordinary dividends: $8,539 (reported on 51.5% of returns)
Here:
$8,539
State:
$6,828
(% of AGI for various income ranges: 8.5% for AGIs below $25k, 3.3% for AGIs $25k-50k, 3.2% for AGIs $50k-75k, 3.6% for AGIs $75k-100k, 1.8% for AGIs $100k-200k, 2.2% for AGIs over 200k)
Net capital gain/loss in AGI: +$19,428 (reported on 44.4% of returns)
Here:
+$19,428
State:
+$15,358
(% of AGI for various income ranges: 0.2% for AGIs below $25k, 0.6% for AGIs $25k-50k, 0.7% for AGIs $50k-75k, 0.8% for AGIs $75k-100k, 0.9% for AGIs $100k-200k, 6.1% for AGIs over 200k)
Profit/loss from business: +$33,626 (reported on 22.5% of returns)
Here:
+$33,626
State:
+$19,577
(% of AGI for various income ranges: 6.5% for AGIs below $25k, 4.4% for AGIs $25k-50k, 4.5% for AGIs $50k-75k, 9.1% for AGIs $75k-100k, 5.7% for AGIs $100k-200k, 3.2% for AGIs over 200k)
Taxable individual retirement arrangement distribution: $28,970 (reported on 13.5% of returns)
07028:
$28,970
New Jersey:
$18,214
(% of AGI for various income ranges: 5.7% for AGIs below $25k, 4.9% for AGIs $25k-50k, 4.4% for AGIs $50k-75k, 2.3% for AGIs $75k-100k, 3.0% for AGIs $100k-200k, 1.6% for AGIs over 200k)
Self-employment retirement plans: $29,075 (reported on 4.7% of returns)
07028:
$29,075
New Jersey:
$24,511
Total itemized deductions: $52,986 (20% of AGI, reported on 69.3% of returns)
Here:
$52,986
State:
$30,827
Here:
20.4% of AGI
State:
21.2% of AGI
(% of AGI for various income ranges: 32.2% for AGIs below $25k, 24.6% for AGIs $25k-50k, 25.8% for AGIs $50k-75k, 25.4% for AGIs $75k-100k, 24.3% for AGIs $100k-200k, 17.2% for AGIs over 200k)
Charity contributions: $5,419 (reported on 62.6% of returns)
Here:
$5,419
State:
$3,451
(% of AGI for various income ranges: 1.1% for AGIs below $25k, 1.8% for AGIs $25k-50k, 2.2% for AGIs $50k-75k, 2.3% for AGIs $75k-100k, 1.6% for AGIs $100k-200k, 1.8% for AGIs over 200k)
Taxes paid: $33,641 (reported on 69.3% of returns)
07028:
$33,641
State:
$15,801
(% of AGI for various income ranges: 13.8% for AGIs below $25k, 11.3% for AGIs $25k-50k, 12.3% for AGIs $50k-75k, 13.9% for AGIs $75k-100k, 14.1% for AGIs $100k-200k, 11.8% for AGIs over 200k)
Earned income credit: $1,710 (reported on 2.9% of returns)
Here:
$1,710
State:
$2,182
(% of AGI for various income ranges: 2.0% for AGIs below $25k, 0.4% for AGIs $25k-50k)
Percentage of individuals using paid preparers for their 2012 taxes: 71.1%
Here:
71%
State:
65%
(% for various income ranges: 68.1% for AGIs below $25k, 63.9% for AGIs $25k-50k, 68.6% for AGIs $50k-75k, 71.4% for AGIs $75k-100k, 71.4% for AGIs $100k-200k, 76.7% for AGIs over 200k)
Averages for the 2004 tax year for zip code 07028, filed in 2005:
Average Adjusted Gross Income (AGI) in 2004: $139,120 (Individual Income Tax Returns)
Here:
$139,120
State:
$64,921
Salary/wage: $131,757 (reported on 79.4% of returns)
Here:
$131,757
State:
$57,755
(% of AGI for various income ranges: 125.4% for AGIs below $10k, 57.8% for AGIs $10k-25k, 67.5% for AGIs $25k-50k, 70.9% for AGIs $50k-75k, 75.4% for AGIs $75k-100k, 75.9% for AGIs over 100k)
Taxable interest for individuals: $2,131 (reported on 70.3% of returns)
This zip code:
$2,131
New Jersey:
$2,068
(% of AGI for various income ranges: 20.5% for AGIs below $10k, 5.5% for AGIs $10k-25k, 2.7% for AGIs $25k-50k, 2.0% for AGIs $50k-75k, 1.5% for AGIs $75k-100k, 0.8% for AGIs over 100k)
Taxable dividends: $4,678 (reported on 57.1% of returns)
Here:
$4,678
State:
$3,959
(% of AGI for various income ranges: 26.6% for AGIs below $10k, 7.2% for AGIs $10k-25k, 3.5% for AGIs $25k-50k, 3.3% for AGIs $50k-75k, 2.2% for AGIs $75k-100k, 1.6% for AGIs over 100k)
Net capital gain/loss: +$12,439 (reported on 47.3% of returns)
Here:
+$12,439
State:
+$13,591
(% of AGI for various income ranges: -9.9% for AGIs below $10k, 1.0% for AGIs $10k-25k, -0.1% for AGIs $25k-50k, 1.6% for AGIs $50k-75k, 0.5% for AGIs $75k-100k, 4.9% for AGIs over 100k)
Profit/loss from business: +$25,613 (reported on 20.9% of returns)
Here:
+$25,613
State:
+$17,520
(% of AGI for various income ranges: 9.2% for AGIs below $10k, 5.7% for AGIs $10k-25k, 6.2% for AGIs $25k-50k, 6.7% for AGIs $50k-75k, 7.0% for AGIs $75k-100k, 3.3% for AGIs over 100k)
IRA payment deduction: $3,157 (reported on 3.6% of returns)
07028:
$3,157
New Jersey:
$3,270
(% of AGI for various income ranges: 2.8% for AGIs below $10k, 0.3% for AGIs $25k-50k, 0.4% for AGIs $50k-75k, 0.2% for AGIs $75k-100k, 0.0% for AGIs over 100k)
Self-employed pension: $19,565 (reported on 5.3% of returns)
Here:
$19,565
New Jersey:
$17,258
(% of AGI for various income ranges: 0.5% for AGIs $25k-50k, 0.5% for AGIs $50k-75k, 0.6% for AGIs $75k-100k, 0.8% for AGIs over 100k)
Total itemized deductions: $38,884 (20% of AGI, reported on 68.4% of returns)
Here:
$38,884
State:
$23,924
Here:
19.9% of AGI
State:
21.1% of AGI
(% of AGI for various income ranges: 48.1% for AGIs below $10k, 37.8% for AGIs $10k-25k, 29.5% for AGIs $25k-50k, 28.5% for AGIs $50k-75k, 27.3% for AGIs $75k-100k, 17.2% for AGIs over 100k)
Charity contributions deductions: $4,797 (2% of AGI, reported on 64.3% of returns)
Here:
$4,797
State:
$3,242
Here:
2.4% of AGI
State:
2.7% of AGI
(% of AGI for various income ranges: 1.4% for AGIs below $10k, 2.7% for AGIs $10k-25k, 2.8% for AGIs $25k-50k, 3.3% for AGIs $50k-75k, 2.8% for AGIs $75k-100k, 2.1% for AGIs over 100k)
Total tax: $32,982 (reported on 84.5% of returns)
07028:
$32,982
State:
$12,321
(% of AGI for various income ranges: 6.6% for AGIs below $10k, 4.2% for AGIs $10k-25k, 8.2% for AGIs $25k-50k, 9.4% for AGIs $50k-75k, 10.0% for AGIs $75k-100k, 22.1% for AGIs over 100k)
Earned income credit: $1,250 (reported on 2.3% of returns)
Here:
$1,250
State:
$1,711
Percentage of individuals using paid preparers for their 2004 taxes: 70.3%
Here:
70%
State:
65%
(% for various income ranges: 66.7% for AGIs below $10k, 63.9% for AGIs $10k-25k, 66.6% for AGIs $25k-50k, 68.6% for AGIs $50k-75k, 69.6% for AGIs $75k-100k, 75.1% for AGIs over 100k)
Household received Food Stamps/SNAP in the past 12 months: 6 Household did not receive Food Stamps/SNAP in the past 12 months: 2,560
Women who had a birth in the past 12 months: 44 (44 now married, 0 unmarried) Women who did not have a birth in the past 12 months: 1,877 (938 now married, 936 unmarried)
Housing units in zip code 07028 with a mortgage: 1,862 (196 second mortgage, 12 home equity loan, 186 both second mortgage and home equity loan) Median monthly owner costs for units with a mortgage: $3,744 Median monthly owner costs for units without a mortgage: $1,425
Residents with income below the poverty level in 2022:
This zip code:
1.2%
Whole state:
9.7%
Residents with income below 50% of the poverty level in 2022:
This zip code:
0.4%
Whole state:
5.2%
Median number of rooms in houses and condos:
Here:
8.1
State:
6.8
Median number of rooms in apartments:
Here:
4.8
State:
3.9
Notable locations in this zip code not listed on our city pages
Churches in zip code 07028 include: Glen Ridge Congregational Church (A), Christ Episcopal Church (B), Church of the Redeemer (C), East Orange Gospel Church (D). Display/hide their locations on the map
In group quarters: 31 (-1 institutionalized population)
Size of family households: 686 2-persons, 607 3-persons, 628 4-persons, 281 5-persons, 35 6-persons
Size of nonfamily households: 300 1-person, 37 2-persons
2,069 married couples with children.
201 single-parent households (201 women).
82.6% of residents of 07028 zip code speak English at home.
9.0% of residents speak Spanish at home (69% very well, 31% well).
5.8% of residents speak other Indo-European language at home (86% very well, 14% well).
1.5% of residents speak Asian or Pacific Island language at home (78% very well, 22% well).
0.7% of residents speak other language at home (100% very well).
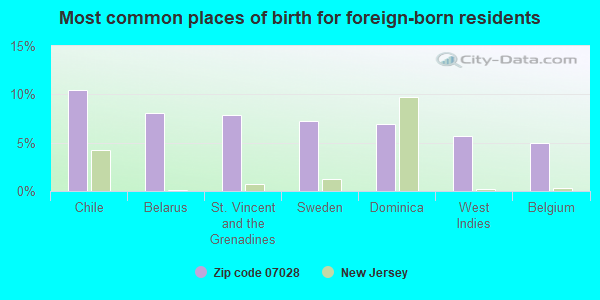
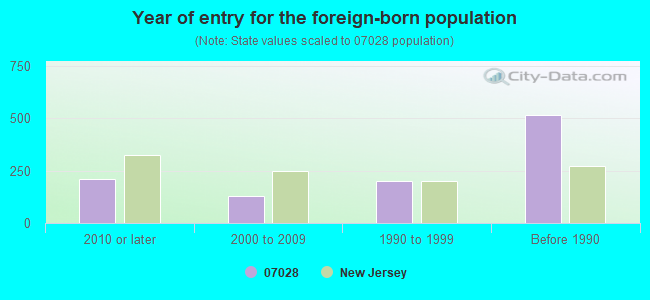
Foreign born population: 841 (10.5%) (76.9% of them are naturalized citizens)
This zip code:
10.5%
Whole state:
23.5%
10%Chile
8%Belarus
8%St. Vincent and the Grenadines
7%Sweden
7%Dominica
6%West Indies
5%Belgium
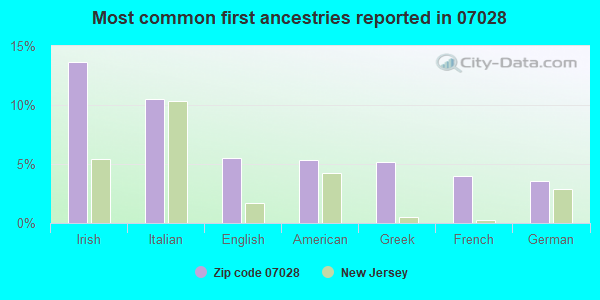
14%Irish
10%Italian
6%English
5%American
5%Greek
4%French
4%German
Year of entry for the foreign-born population
2102010 or later
1282000 to 2009
1981990 to 1999
515Before 1990
Facilities with environmental interests located in this zip code:
GLEN RIDGE BORO BD OF ED LINDEN AVENUE SCHOOL (205 LINDEN AVENUE in GLEN RIDGE, NJ)
COMPLIANCE ACTIVITY (Tracking inspections of insecticide, fungicide, and rodenticide, and toxic substances) (National Center for Education Statistics) - STATE ID-080 STATE MASTER (New Jersey environmental info) - NJEMS-021677, STATE CLEANUP SITE Alternative names: GLEN RIDGE BOARD OF ED, GLEN RIDGE BOARD OF EDUCATION, GLEN RIDGE BORO TWP BD OF ED LINDEN AVENUE SCHOOL
GLEN RIDGE BORO MUNICIPAL BUILDING (825 BLOOMFIELD AVE in GLEN RIDGE BORO TWP, NJ)
STATE MASTER (New Jersey environmental info) - NJEMS-127566, WASTEWATER FACILITY, NJEMS-197978, National Pollutant Discharge Elimination System Permit, NJEMS-H0612, AIR PROGRAM, NJEMS-002168, STATE CLEANUP SITE, NJEMS-0708-02-0002.2, LAND USE - COASTAL AND LAND USE, NJEMS-0708001, DRINKING WATER PROGRAM National Pollutant Discharge Elimination System NON-MAJOR (Tracking pollutant discharge elimination systems) - permit Business SIC classification: GENERAL GOVERNMENT Organizations: GLEN RIDGE BORO COLLECTION SYSTEM, GLEN RIDGE BORO COLLECTION SYS (CONTACT/OWNER)
GLEN RIDGE BORO BD OF ED FOREST AVENUE SCHOOL (287 FOREST AVE in GLEN RIDGE, NJ)
(Geographic Names Information System) COMPLIANCE ACTIVITY (Tracking inspections of insecticide, fungicide, and rodenticide, and toxic substances) STATE MASTER (New Jersey environmental info) - NJEMS-021680, STATE CLEANUP SITE Alternative names: FOREST AVENUE ELEMENTARY SCHOOL, FOREST AVE. SCHOOL, GLEN RIDGE BOARD OF ED, FOREST AVE SCHOO, GLEN RIDGE BORO TWP BD OF ED FOREST AVENUE SCHOOL
AIR MINOR (AIRS/AFS) STATE MASTER (New Jersey environmental info) - NJEMS-05905, AIR PROGRAM, NJEMS-PET11, REFUSE DISPOSAL Business SIC classification: ANIMAL SPECIALTIES; MEMBERSHIP ORGANIZATIONS Alternative names: BLOOMFIELD TOWN ANIMAL SHELTER
GLEN RIDGE BORO BD OF ED GLEN RIDGE MIDDLE SCHOOL (235 RIDGEWOOD AVE in GLEN RIDGE, NJ)
COMPLIANCE ACTIVITY (Tracking inspections of insecticide, fungicide, and rodenticide, and toxic substances) STATE MASTER (New Jersey environmental info) - NJEMS-014376, STATE CLEANUP SITE Alternative names: GLEN RIDGE BOARD OF ED, GLEN RIDGE BORO TWP BD OF ED GLEN RIDGE MIDDLE SCHOOL
GLEN RIDGE HIGH (200 RIDGEWOOD AVE in GLEN RIDGE, NJ)
(National Center for Education Statistics) - STATE ID-050 Organizations: GLEN RIDGE BORO (SCHOOL DISTRICT)
GLEN RIDGE BOROUGH OF (825 BLOOMFIELD AVE POLICE DEPT in GLEN RIDGE, NJ)
(Resource Conservation and Recovery Act (tracking hazardous waste))
GLEN RIDGE BOARD OF ED (23 RIDGEWOOD AVE in GLEN RIDGE, NJ)
COMPLIANCE ACTIVITY (Tracking inspections of insecticide, fungicide, and rodenticide, and toxic substances)
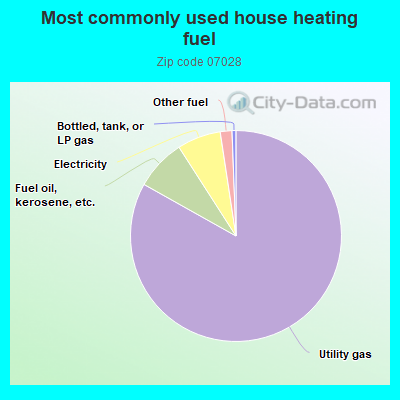
83.3%Utility gas
7.8%Fuel oil, kerosene, etc.
6.7%Electricity
1.8%Other fuel
0.6%Bottled, tank, or LP gas
Population in 1990: 7,751.
Place of birth for U.S.-born residents:
This state: 3,132
Northeast: 3,085
Midwest: 207
South: 285
West: 227
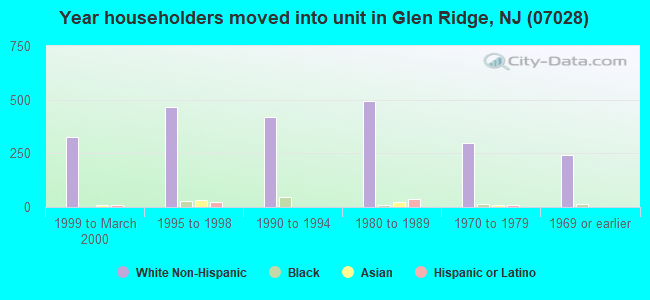
69% of the 07028 zip code residents lived in the same house 5 years ago. Out of people who lived in different houses, 49% lived in this county. Out of people who lived in different counties, 50% lived in New Jersey.
95% of the 07028 zip code residents lived in the same house 1 year ago. Out of people who lived in different houses, 18% moved from this county. Out of people who lived in different houses, 48% moved from different county within same state. Out of people who lived in different houses, 39% moved from different state.
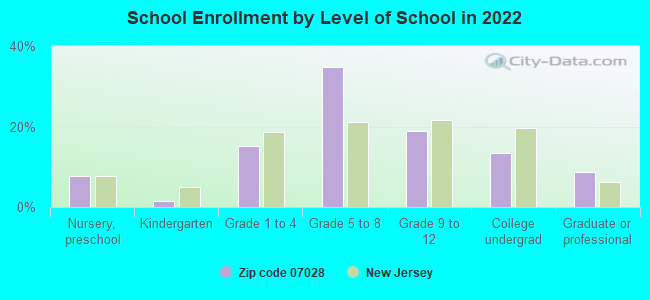
Private vs. public school enrollment:
Students in private schools in grades 1 to 8 (elementary and middle school):
Here:
0.0%
New Jersey:
12.3%
Students in private schools in grades 9 to 12 (high school): 81
Here:
17.4%
New Jersey:
13.1%
Students in private undergraduate colleges: 174
Here:
50.9%
New Jersey:
33.2%
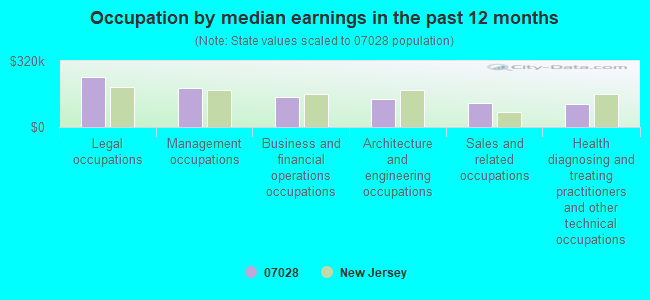
Occupation by median earnings in the past 12 months ($)
242,553Legal occupations
186,913Management occupations
146,682Business and financial operations occupations
134,200Architecture and engineering occupations
118,103Sales and related occupations
113,368Health diagnosing and treating practitioners and other technical occupations
Top industries in this zip code by the number of employees in 2005:
Health Care and Social Assistance: Offices of Physicians (except Mental Health Specialists) (20-49 employees: 1 establishment, 10-19 employees: 7 establishments, 5-9 employees: 4 establishments, 1-4 employees: 16 establishments)
Arts, Entertainment, and Recreation: Golf Courses and Country Clubs (50-99: 1)
Other Services (except Public Administration): Religious Organizations (20-49: 1, 10-19: 1, 1-4: 1)
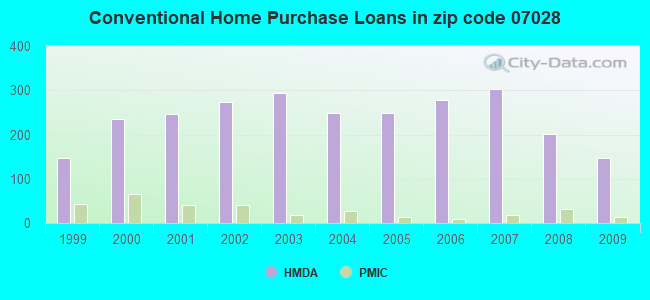
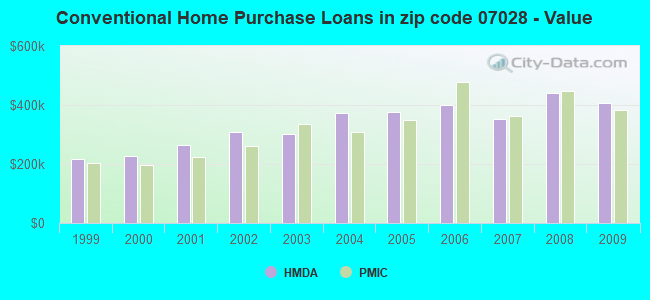
Detailed PMIC statistics for the following Tracts:0160.00
2003 - 2018 National Fire Incident Reporting System (NFIRS) incidents
Based on the data from the years 2003 - 2018 the average number of fire incidents per year is 14. The highest number of reported fires - 24 took place in 2006, and the least - 1 in 2003. The data has a growing trend.
When looking into fire subcategories, the most reports belonged to: Structure Fires (64.6%), and Outside Fires (27.4%).
Fire incident types reported to NFIRS in Zip Code 07028


 Nearest zip codes: 07042, 07003, 07017, 07043, 07109, 07107.


 Based on the data from the years 2003 - 2018 the average number of fire incidents per year is 14. The highest number of reported fires - 24 took place in 2006, and the least - 1 in 2003. The data has a growing trend.
 When looking into fire subcategories, the most reports belonged to: Structure Fires (64.6%), and Outside Fires (27.4%).