Estimated zip code population in 2022: 9,087 Zip code population in 2010: 8,990 Zip code population in 2000: 8,983
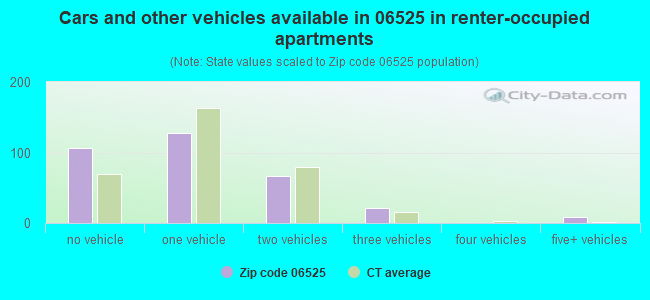
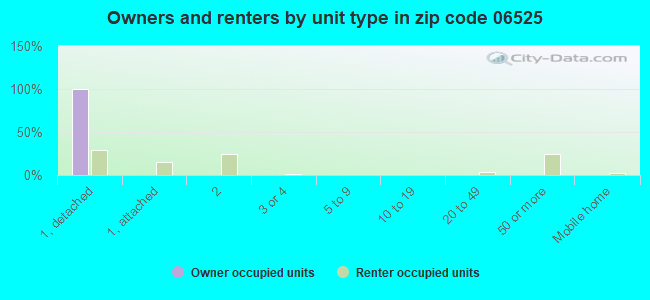
Houses and condos: 3,418 Renter-occupied apartments: 329
% of renters here:
10%
State:
34%
March 2022 cost of living index in zip code 06525: 127.4 (high, U.S. average is 100)
Land area: 18.8 sq. mi. Water area: 0.4 sq. mi.
Population density: 483 people per square mile
(low).
OSM Map
Google Map
MSN Map
OSM Map
General Map
Google Map
MSN Map
OSM Map
Google Map
MSN Map
OSM Map
Google Map
MSN Map
Please wait while loading the map...
Real estate property taxes paid for housing units in 2022:
This zip code:
1.8% ($9,545)
Connecticut:
1.8% ($6,189)
Median real estate property taxes paid for housing units with mortgages in 2022: $9,526 (1.8%) Median real estate property taxes paid for housing units with no mortgage in 2022: $9,598 (1.7%)
Business Search- 14 Million verified businesses
Males: 4,779
(52.6%)
Females: 4,308
(47.4%)
For population 25 years and over in 06525:
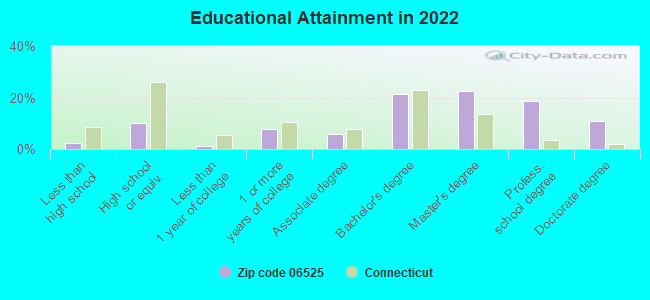
High school or higher: 98.6%
Bachelor's degree or higher: 73.9%
Graduate or professional degree: 52.2%
Unemployed: 5.4%
Mean travel time to work (commute): 25.0 minutes
For population 15 years and over in 06525:
Never married: 18.4%
Now married: 67.8%
Separated: 1.0%
Widowed: 5.4%
Divorced: 7.3%
Zip code 06525 compared to state average:
Median household income above state average.
Median house value above state average.
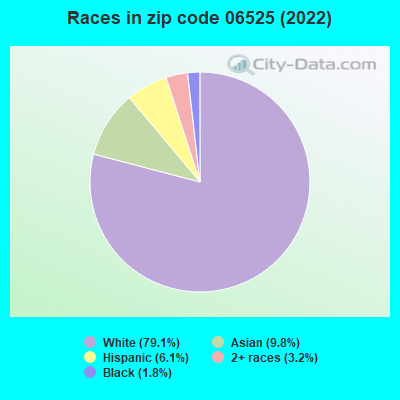
Black race population percentage significantly below state average.
Hispanic race population percentage below state average.
Median age above state average.
Renting percentage significantly below state average.
Length of stay since moving in above state average.
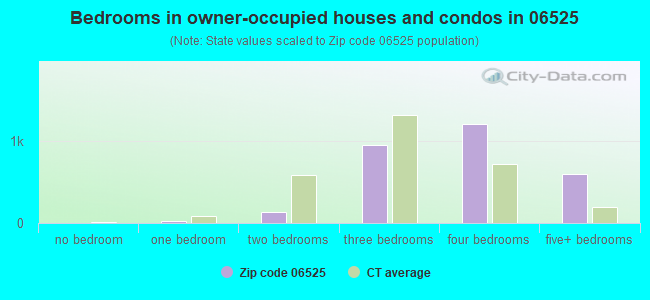
Number of rooms per house significantly above state average.
Number of college students below state average.
Percentage of population with a bachelor's degree or higher above state average.
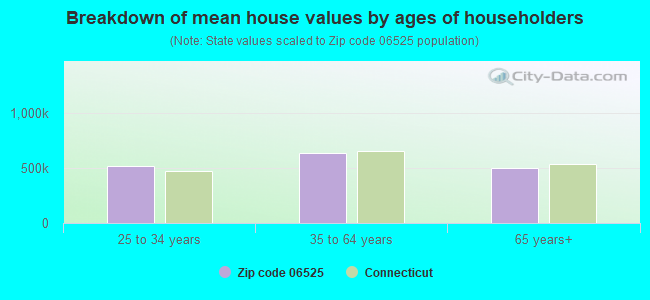
Estimated median house/condo value in 2022: $543,164
06525:
$543,164
Connecticut:
$347,200
According to our research of Connecticut and other state lists, there was 1 registered sex offender living in 06525 zip code as of May 25, 2024. The ratio of all residents to sex offenders in zip code 06525 is 9,053 to 1. The ratio of registered sex offenders to all residents in this zip code is much lower than the state average.
Median resident age:
This zip code:
46.2 years
Connecticut median age:
40.9 years
Average household size:
This zip code:
2.8 people
Connecticut:
2.5 people
Averages for the 2020 tax year for zip code 06525, filed in 2021:
Average Adjusted Gross Income (AGI) in 2020: $183,821 (Individual Income Tax Returns)
Here:
$183,821
State:
$105,931
Salary/wage: $139,819 (reported on 77.8% of returns)
Here:
$139,819
State:
$83,540
(% of AGI for various income ranges: 1096.4% for AGIs below $25k, 3492.6% for AGIs $25k-50k, 6519.6% for AGIs $50k-75k, 9392.3% for AGIs $75k-100k, 20689.0% for AGIs $100k-200k, 102881.3% for AGIs over 200k)
Taxable interest for individuals: $3,983 (reported on 56.1% of returns)
This zip code:
$3,983
Connecticut:
$3,402
(% of AGI for various income ranges: 40.7% for AGIs below $25k, 99.4% for AGIs $25k-50k, 133.3% for AGIs $50k-75k, 190.5% for AGIs $75k-100k, 318.2% for AGIs $100k-200k, 2225.5% for AGIs over 200k)
Ordinary dividends: $15,234 (reported on 49.4% of returns)
Here:
$15,234
State:
$12,683
(% of AGI for various income ranges: 107.8% for AGIs below $25k, 281.5% for AGIs $25k-50k, 279.3% for AGIs $50k-75k, 474.5% for AGIs $75k-100k, 1054.1% for AGIs $100k-200k, 7903.5% for AGIs over 200k)
Net capital gain/loss in AGI: +$47,929 (reported on 45.5% of returns)
Here:
+$47,929
State:
+$44,158
(% of AGI for various income ranges: 80.2% for AGIs below $25k, 275.6% for AGIs $25k-50k, 289.3% for AGIs $50k-75k, 374.1% for AGIs $75k-100k, 1172.0% for AGIs $100k-200k, 27978.4% for AGIs over 200k)
Profit/loss from business: +$51,155 (reported on 25.6% of returns)
Here:
+$51,155
State:
+$22,988
(% of AGI for various income ranges: 210.4% for AGIs below $25k, 470.0% for AGIs $25k-50k, 543.3% for AGIs $50k-75k, 897.3% for AGIs $75k-100k, 1395.5% for AGIs $100k-200k, 14345.2% for AGIs over 200k)
Taxable individual retirement arrangement distribution: $33,980 (reported on 13.7% of returns)
06525:
$33,980
Connecticut:
$22,031
(% of AGI for various income ranges: 71.8% for AGIs below $25k, 162.4% for AGIs $25k-50k, 313.0% for AGIs $50k-75k, 511.4% for AGIs $75k-100k, 1071.2% for AGIs $100k-200k, 3965.8% for AGIs over 200k)
Self-employed (Keogh) retirement plans: $35,675 (reported on 5.5% of returns)
06525:
$35,675
Connecticut:
$29,016
(% of AGI for various income ranges: 166.7% for AGIs $100k-200k, 2498.4% for AGIs over 200k)
Total itemized deductions: $36,650 (reported on 22.0% of returns)
Here:
$36,650
State:
$37,613
(% of AGI for various income ranges: 227.6% for AGIs below $25k, 429.4% for AGIs $25k-50k, 696.7% for AGIs $50k-75k, 1355.9% for AGIs $75k-100k, 1432.0% for AGIs $100k-200k, 6715.8% for AGIs over 200k)
Charity contributions: $12,295 (reported on 18.8% of returns)
Here:
$12,295
State:
$13,557
(% of AGI for various income ranges: 29.4% for AGIs $25k-50k, 73.0% for AGIs $50k-75k, 108.6% for AGIs $75k-100k, 236.1% for AGIs $100k-200k, 2706.1% for AGIs over 200k)
Taxes paid: $9,515 (reported on 22.0% of returns)
06525:
$9,515
State:
$9,096
(% of AGI for various income ranges: 52.4% for AGIs below $25k, 132.4% for AGIs $25k-50k, 226.3% for AGIs $50k-75k, 414.5% for AGIs $75k-100k, 481.2% for AGIs $100k-200k, 1473.2% for AGIs over 200k)
Earned income credit: $1,745 (reported on 4.6% of returns)
Here:
$1,745
State:
$2,059
(% of AGI for various income ranges: 54.2% for AGIs below $25k, 30.9% for AGIs $25k-50k)
Percentage of individuals using paid preparers for their 2020 taxes: 91.5%
Here:
92%
State:
93%
(% for various income ranges: 90.9% for AGIs below $25k, 90.6% for AGIs $25k-50k, 90.5% for AGIs $50k-75k, 91.9% for AGIs $75k-100k, 91.2% for AGIs $100k-200k, 93.0% for AGIs over 200k)
Averages for the 2012 tax year for zip code 06525, filed in 2013:
Average Adjusted Gross Income (AGI) in 2012: $179,944 (Individual Income Tax Returns)
Here:
$179,944
State:
$93,290
Salary/wage: $137,417 (reported on 76.7% of returns)
Here:
$137,417
State:
$73,117
(% of AGI for various income ranges: 63.0% for AGIs below $25k, 65.0% for AGIs $25k-50k, 67.9% for AGIs $50k-75k, 66.8% for AGIs $75k-100k, 68.6% for AGIs $100k-200k, 55.0% for AGIs over 200k)
Taxable interest for individuals: $3,618 (reported on 67.0% of returns)
This zip code:
$3,618
Connecticut:
$2,530
(% of AGI for various income ranges: 3.7% for AGIs below $25k, 1.7% for AGIs $25k-50k, 1.6% for AGIs $50k-75k, 1.5% for AGIs $75k-100k, 1.6% for AGIs $100k-200k, 1.2% for AGIs over 200k)
Ordinary dividends: $11,305 (reported on 53.2% of returns)
Here:
$11,305
State:
$10,909
(% of AGI for various income ranges: 9.2% for AGIs below $25k, 4.3% for AGIs $25k-50k, 3.0% for AGIs $50k-75k, 4.4% for AGIs $75k-100k, 3.4% for AGIs $100k-200k, 3.1% for AGIs over 200k)
Net capital gain/loss in AGI: +$48,291 (reported on 45.2% of returns)
Here:
+$48,291
State:
+$34,090
(% of AGI for various income ranges: 0.8% for AGIs below $25k, 0.6% for AGIs $25k-50k, 2.0% for AGIs $50k-75k, 1.1% for AGIs $75k-100k, 1.8% for AGIs $100k-200k, 16.3% for AGIs over 200k)
Profit/loss from business: +$49,359 (reported on 24.2% of returns)
Here:
+$49,359
State:
+$22,741
(% of AGI for various income ranges: 9.7% for AGIs below $25k, 8.7% for AGIs $25k-50k, 6.7% for AGIs $50k-75k, 6.9% for AGIs $75k-100k, 5.7% for AGIs $100k-200k, 6.7% for AGIs over 200k)
Taxable individual retirement arrangement distribution: $38,636 (reported on 16.6% of returns)
06525:
$38,636
Connecticut:
$19,976
(% of AGI for various income ranges: 5.3% for AGIs below $25k, 3.9% for AGIs $25k-50k, 4.1% for AGIs $50k-75k, 3.6% for AGIs $75k-100k, 4.3% for AGIs $100k-200k, 3.3% for AGIs over 200k)
Self-employment retirement plans: $26,130 (reported on 6.0% of returns)
06525:
$26,130
Connecticut:
$24,004
(% of AGI for various income ranges: 1.8% for AGIs $25k-50k, 0.5% for AGIs $100k-200k, 1.0% for AGIs over 200k)
Total itemized deductions: $46,680 (17% of AGI, reported on 62.5% of returns)
Here:
$46,680
State:
$33,239
Here:
17.2% of AGI
State:
18.9% of AGI
(% of AGI for various income ranges: 25.5% for AGIs below $25k, 23.3% for AGIs $25k-50k, 23.8% for AGIs $50k-75k, 23.4% for AGIs $75k-100k, 21.1% for AGIs $100k-200k, 13.9% for AGIs over 200k)
Charity contributions: $6,105 (reported on 55.7% of returns)
Here:
$6,105
State:
$4,947
(% of AGI for various income ranges: 1.1% for AGIs below $25k, 1.3% for AGIs $25k-50k, 1.7% for AGIs $50k-75k, 1.9% for AGIs $75k-100k, 1.8% for AGIs $100k-200k, 1.9% for AGIs over 200k)
Taxes paid: $28,287 (reported on 61.9% of returns)
06525:
$28,287
State:
$17,397
(% of AGI for various income ranges: 8.7% for AGIs below $25k, 9.9% for AGIs $25k-50k, 10.8% for AGIs $50k-75k, 11.9% for AGIs $75k-100k, 12.1% for AGIs $100k-200k, 9.0% for AGIs over 200k)
Earned income credit: $1,474 (reported on 4.2% of returns)
Here:
$1,474
State:
$2,053
(% of AGI for various income ranges: 1.8% for AGIs below $25k, 0.4% for AGIs $25k-50k)
Percentage of individuals using paid preparers for their 2012 taxes: 66.3%
Here:
66%
State:
55%
(% for various income ranges: 61.3% for AGIs below $25k, 63.2% for AGIs $25k-50k, 61.4% for AGIs $50k-75k, 64.1% for AGIs $75k-100k, 65.3% for AGIs $100k-200k, 78.4% for AGIs over 200k)
Averages for the 2004 tax year for zip code 06525, filed in 2005:
Average Adjusted Gross Income (AGI) in 2004: $137,478 (Individual Income Tax Returns)
Here:
$137,478
State:
$73,265
Salary/wage: $108,760 (reported on 74.0% of returns)
Here:
$108,760
State:
$62,030
(% of AGI for various income ranges: 57.8% for AGIs $10k-25k, 65.0% for AGIs $25k-50k, 68.4% for AGIs $50k-75k, 69.5% for AGIs $75k-100k, 56.2% for AGIs over 100k)
Taxable interest for individuals: $4,278 (reported on 76.5% of returns)
This zip code:
$4,278
Connecticut:
$2,287
(% of AGI for various income ranges: 6.3% for AGIs $10k-25k, 3.7% for AGIs $25k-50k, 3.2% for AGIs $50k-75k, 2.1% for AGIs $75k-100k, 2.1% for AGIs over 100k)
Taxable dividends: $7,175 (reported on 62.4% of returns)
Here:
$7,175
State:
$5,735
(% of AGI for various income ranges: 7.1% for AGIs $10k-25k, 4.3% for AGIs $25k-50k, 3.5% for AGIs $50k-75k, 4.5% for AGIs $75k-100k, 2.9% for AGIs over 100k)
Net capital gain/loss: +$22,668 (reported on 54.0% of returns)
Here:
+$22,668
State:
+$23,694
(% of AGI for various income ranges: 3.6% for AGIs $10k-25k, 1.7% for AGIs $25k-50k, 2.0% for AGIs $50k-75k, 1.8% for AGIs $75k-100k, 10.1% for AGIs over 100k)
Profit/loss from business: +$41,837 (reported on 22.6% of returns)
Here:
+$41,837
State:
+$20,783
(% of AGI for various income ranges: 6.8% for AGIs $10k-25k, 10.0% for AGIs $25k-50k, 6.5% for AGIs $50k-75k, 5.9% for AGIs $75k-100k, 6.9% for AGIs over 100k)
IRA payment deduction: $3,936 (reported on 4.6% of returns)
06525:
$3,936
Connecticut:
$3,216
(% of AGI for various income ranges: 0.8% for AGIs $10k-25k, 0.6% for AGIs $25k-50k, 0.5% for AGIs $50k-75k, 0.3% for AGIs $75k-100k, 0.1% for AGIs over 100k)
Self-employed pension: $20,256 (reported on 6.5% of returns)
Here:
$20,256
Connecticut:
$17,335
(% of AGI for various income ranges: 0.5% for AGIs $25k-50k, 0.5% for AGIs $50k-75k, 0.7% for AGIs $75k-100k, 1.0% for AGIs over 100k)
Total itemized deductions: $35,993 (16% of AGI, reported on 57.8% of returns)
Here:
$35,993
State:
$24,919
Here:
15.9% of AGI
State:
18.6% of AGI
(% of AGI for various income ranges: 26.9% for AGIs $10k-25k, 21.2% for AGIs $25k-50k, 22.3% for AGIs $50k-75k, 24.4% for AGIs $75k-100k, 13.6% for AGIs over 100k)
Charity contributions deductions: $6,329 (3% of AGI, reported on 54.4% of returns)
Here:
$6,329
State:
$3,762
Here:
2.7% of AGI
State:
2.7% of AGI
(% of AGI for various income ranges: 1.6% for AGIs $10k-25k, 1.7% for AGIs $25k-50k, 1.8% for AGIs $50k-75k, 2.4% for AGIs $75k-100k, 2.6% for AGIs over 100k)
Total tax: $36,028 (reported on 81.7% of returns)
06525:
$36,028
State:
$15,148
(% of AGI for various income ranges: 4.8% for AGIs $10k-25k, 8.6% for AGIs $25k-50k, 9.8% for AGIs $50k-75k, 10.4% for AGIs $75k-100k, 23.3% for AGIs over 100k)
Earned income credit: $1,222 (reported on 3.0% of returns)
Here:
$1,222
State:
$1,570
Percentage of individuals using paid preparers for their 2004 taxes: 70.4%
Here:
70%
State:
59%
(% for various income ranges: 69.8% for AGIs below $10k, 63.3% for AGIs $10k-25k, 65.1% for AGIs $25k-50k, 62.3% for AGIs $50k-75k, 66.3% for AGIs $75k-100k, 78.0% for AGIs over 100k)
Likely homosexual households (counted as self-reported same-sex unmarried-partner households)
Lesbian couples: 0.0% of all households
Gay men: 0.7% of all households
Household received Food Stamps/SNAP in the past 12 months: 47 Household did not receive Food Stamps/SNAP in the past 12 months: 3,168
Women who had a birth in the past 12 months: 111 (84 now married, 26 unmarried) Women who did not have a birth in the past 12 months: 1,538 (910 now married, 599 unmarried)
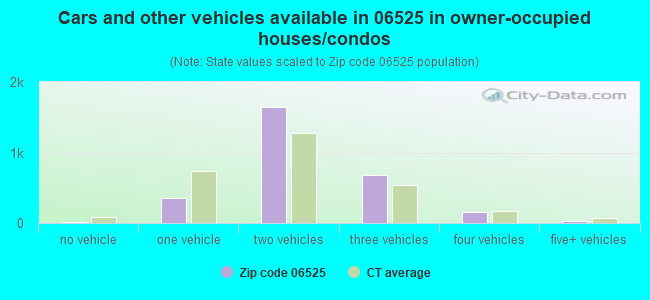
Housing units in zip code 06525 with a mortgage: 1,662 (151 second mortgage, 142 both second mortgage and home equity loan) Houses without a mortgage: 73
Median monthly owner costs for units with a mortgage: $3,412 Median monthly owner costs for units without a mortgage: $1,443
Residents with income below the poverty level in 2022:
This zip code:
1.2%
Whole state:
9.8%
Residents with income below 50% of the poverty level in 2022:
This zip code:
0.2%
Whole state:
4.8%
Median number of rooms in houses and condos:
Here:
8.5
State:
6.5
Median number of rooms in apartments:
Here:
4.5
State:
4.0
Notable locations in this zip code not listed on our city pages
Notable locations in zip code 06525: Woodbridge Country Club (A), Oak Lane Country Club (B), Jewish Community Center of Greater New Haven (C), Woodbridge Town Library (D), Woodbridge Fire Department (E). Display/hide their locations on the map
Churches in zip code 06525 include: New Apostolic Church (A), Our Lady of the Assumption Church (B), Trinity Evangelical Free Church (C), Congregation B'Nai Jacob (D), First Church of Christ (E). Display/hide their locations on the map
Lakes and reservoirs: Konolds Pond (A), Bishops Pond (B), Lake Watrous (C), Glen Lake (D), Shelton Reservoir (E), Lake Dawson (F), Lake Watrous (G). Display/hide their locations on the map
In group quarters: 108 (-1 institutionalized population)
Size of family households: 1,161 2-persons, 659 3-persons, 663 4-persons, 195 5-persons, 15 6-persons
Size of nonfamily households: 404 1-person, 57 2-persons, 11 4-persons
1,968 married couples with children.
352 single-parent households (158 men, 194 women).
82.3% of residents of 06525 zip code speak English at home.
2.8% of residents speak Spanish at home (87% very well, 13% not at all).
7.1% of residents speak other Indo-European language at home (78% very well, 18% well, 4% not well).
5.9% of residents speak Asian or Pacific Island language at home (49% very well, 34% well, 4% not well, 13% not at all).
2.0% of residents speak other language at home (92% very well, 8% well).
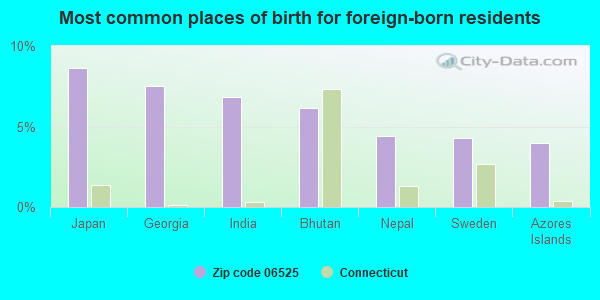
Foreign born population: 1,655 (18.2%) (70.3% of them are naturalized citizens)
This zip code:
18.2%
Whole state:
15.7%
9%Japan
8%Georgia
7%India
6%Bhutan
4%Nepal
4%Sweden
4%Azores Islands
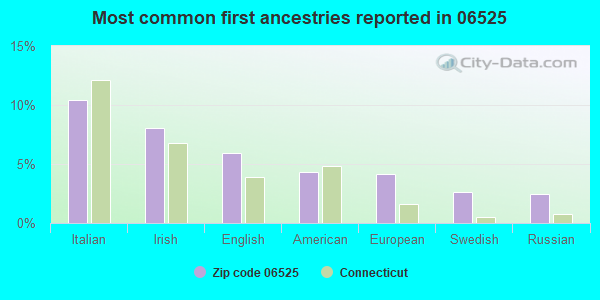
10%Italian
8%Irish
6%English
4%American
4%European
3%Swedish
2%Russian
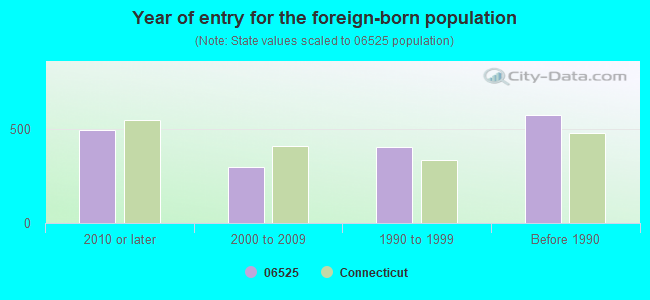
Year of entry for the foreign-born population
4932010 or later
2972000 to 2009
4071990 to 1999
575Before 1990
Facilities with environmental interests located in this zip code:
AMITY REGIONAL SENIOR HIGH SCHOOL (25 NEWTON ROAD in WOODBRIDGE, CT)
COMPLIANCE ACTIVITY (Tracking inspections of insecticide, fungicide, and rodenticide, and toxic substances) (National Center for Education Statistics) - STATE ID-61 Organizations: REGIONAL SCHOOL DISTRICT 05 (SCHOOL DISTRICT)
Alternative names: AMITY SENIOR HIGH
BEECHER ROAD SCHOOL (40 BEECHER ROAD in WOODBRIDGE, CT)
(Geographic Names Information System) (National Center for Education Statistics) - STATE ID-2 Organizations: WOODBRIDGE SCHOOL DISTRICT (SCHOOL DISTRICT)
HOMEBOUND (4 MEETINGHOUSE LANE in WOODBRIDGE, CT)
(National Center for Education Statistics) - STATE ID-88 Organizations: WOODBRIDGE SCHOOL DISTRICT (SCHOOL DISTRICT)
HOMEBOUND (25 NEWTON ROAD in WOODBRIDGE, CT)
(National Center for Education Statistics) - STATE ID-88 Organizations: REGIONAL SCHOOL DISTRICT 05 (SCHOOL DISTRICT)
GOLDEN TOUCH CLEANERS (1670 LITCHFIELD TURNPIKE in WOODBRIDGE, CT)
AIR MINOR (AIRS/AFS) (Resource Conservation and Recovery Act (tracking hazardous waste)) Business SIC classification: DRYCLEANING PLANTS, EXCEPT RUG CLEANING Organizations: CVC CORP (CONTACT/OWNER)
Alternative names: STATESIDE CLEANERS
AMITY MOTORS (220 AMITY RD in WOODBRIDGE, CT)
Small Quantity Generators, between 100 kg and 1000 kg of hazardous waste/month (Resource Conservation and Recovery Act (tracking hazardous waste)) - notification Organizations: SCOTT ALTSCHULER (CONTACT/OWNER)
AMITY VETERINARY HOSPITAL (565 AMITY RD in WOODBRIDGE, CT)
Conditionally Exempt Small Quantity Generators, less than 100 kg/month of hazardous waste (Resource Conservation and Recovery Act (tracking hazardous waste)) - notification Organizations: GEORGE PODGWAITE (CONTACT/OWNER)
CREST LINCOLN MERCURY (185 AMITY RD in WOODBRIDGE, CT)
Small Quantity Generators, between 100 kg and 1000 kg of hazardous waste/month (Resource Conservation and Recovery Act (tracking hazardous waste)) - notification Organizations: RICHARD H FITZPATRICK JR (CONTACT/OWNER)
Conditionally Exempt Small Quantity Generators, less than 100 kg/month of hazardous waste (Resource Conservation and Recovery Act (tracking hazardous waste)) - notification Organizations: EXXONMOBIL OIL CORPORATION (CONTACT/OWNER)
EZRA ACADEMY (75 RIMMON ROAD STE 2 in WOODBRIDGE, CT)
(Geographic Names Information System) COMPLIANCE ACTIVITY (Tracking inspections of insecticide, fungicide, and rodenticide, and toxic substances) Alternative names: B'NAI JACOB SCHOOL, B'NAIL JACOB SCHOOL
BEECHER RD (BEECHER RD in WOODBRIDGE, CT)
COMPLIANCE ACTIVITY (Tracking inspections of insecticide, fungicide, and rodenticide, and toxic substances)
Housing units lacking complete plumbing facilities: 0.2% Housing units lacking complete kitchen facilities: 1.2%
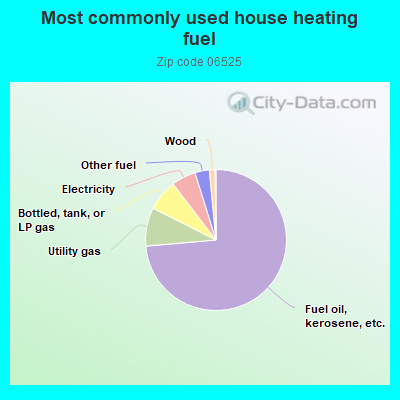
73.7%Fuel oil, kerosene, etc.
8.8%Utility gas
7.2%Bottled, tank, or LP gas
5.6%Electricity
3.3%Other fuel
1.3%Wood
Population in 1990: 7,802. Population change in the 1990s: +1,181 (+15.1%).
Place of birth for U.S.-born residents:
This state: 4,832
Northeast: 1,318
Midwest: 457
South: 441
West: 236
68% of the 06525 zip code residents lived in the same house 5 years ago. Out of people who lived in different houses, 78% lived in this county. Out of people who lived in different counties, 50% lived in Connecticut.
92% of the 06525 zip code residents lived in the same house 1 year ago. Out of people who lived in different houses, 42% moved from this county. Out of people who lived in different houses, 4% moved from different county within same state. Out of people who lived in different houses, 50% moved from different state. Out of people who lived in different houses, 11% moved from abroad.
Private vs. public school enrollment:
Students in private schools in grades 1 to 8 (elementary and middle school): 122
Here:
10.2%
Connecticut:
9.5%
Students in private schools in grades 9 to 12 (high school): 46
Here:
8.0%
Connecticut:
12.9%
Students in private undergraduate colleges: 45
Here:
34.9%
Connecticut:
35.5%
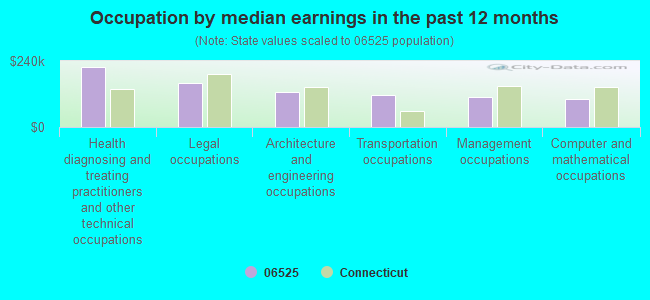
Occupation by median earnings in the past 12 months ($)
218,674Health diagnosing and treating practitioners and other technical occupations
158,197Legal occupations
126,323Architecture and engineering occupations
117,213Transportation occupations
110,032Management occupations
103,394Computer and mathematical occupations
Companies with federal contracts located in this zip code:
PAUL R. MCDANIEL (2711 NW 20TH STREET in WOODBRIDGE, CT; small business) : $403,225 in 4 contractsfrom 2002 to 2005
$160,000 with Offices, Boards and Divisions (includes Attorney General, Deputy Attorney General, etc.) for Expert Witness. Taking place in DC. Signed on 2005-09-06. Completion date: 2006-02-05.
$115,625 with Offices, Boards and Divisions (includes Attorney General, Deputy Attorney General, etc.) for Expert Witness. Taking place in MA. Signed on 2002-11-15. Completion date: 2003-03-15.
$65,000, same as above.Signed on 2003-01-15. Completion date: 2003-09-15.
$62,600 with Offices, Boards and Divisions (includes Attorney General, Deputy Attorney General, etc.) for Expert Witness. Taking place in DC. Signed on 2005-05-27. Completion date: 2007-01-31.
WASTE MANAGEMENT OF CONNECTICU (136 BRADLEY ROAD in WOODBRIDGE, CT) : $26,142 in 8 contractsfrom 2000 to 2004
Contracts for Trash/Garbage Collection Services - Including Portable Sanitation Services by Navy Signed by year:2000: $8,876; 2001: $0; 2002: $4,580; 2003: $4,609; 2004: $8,077; 2005: $0; 2006: $0.
Biggest contracts:
$4,609 with Navy for Trash/Garbage Collection Services - Including Portable Sanitation Services. Signed on 2004-06-15. Completion date: 2004-06-15.
$4,609, same as above.Signed on 2003-04-01. Completion date: 2001-09-30.
$4,580, same as above.Signed on 2002-03-02. Completion date: 2001-09-30.
$4,552, same as above.Signed on 2000-10-11. Completion date: 2000-09-30.
DIVERSIFIED SALES COMPANY INC (20 SPRING VALLEY RD in WOODBRIDGE, CT; small business)
$4,840 with Army for Maintenance, Repair or Alteration of Real Property -- Sewage and Waste Facilities. Taking place in PA. Signed on 2005-03-16. Completion date: 2005-03-16.
ROYAL REFUSE & RECYCLING (P O BOX 3843 in NEW HAVEN, CT; small business) : -$780 in 2 contractsin 2001
$0 with Navy for Maintenance, Repair or Alteration of Real Property -- Miscellaneous Buildings. Signed on 2001-03-21. Completion date: 1999-09-30.
-$780, same as above.Signed on 2001-03-21. Completion date: 1999-09-30.
COOPERATING SYSTEMS CORP (154 PECK HILL RD in NEW HAVEN, CT; small business) : -$95,450 in 2 contractsin 2000
$0 with Army for Other Defense -- Applied Research and Exploratory Development (R&D). Taking place in NH. Signed on 2000-03-13. Completion date: 2000-03-14.
-$95,450, same as above.Signed on 2000-03-13. Completion date: 2000-03-14.
Top industries in this zip code by the number of employees in 2005:
Health Care and Social Assistance: Residential Mental Retardation Facilities (100-249 employees: 1 establishment, 10-19 employees: 3 establishments, 5-9 employees: 1 establishment, 1-4 employees: 1 establishment)
Administrative and Support and Waste Management and Remediation Services: Janitorial Services (100-249: 1, 10-19: 1, 1-4: 2)
Health Care and Social Assistance: Nursing Care Facilities (100-249: 1)
Health Care and Social Assistance: Other Individual and Family Services (100-249: 1)
Management of Companies and Enterprises: Corporate, Subsidiary, and Regional Managing Offices (100-249: 1)
Arts, Entertainment, and Recreation: Golf Courses and Country Clubs (50-99: 2, 5-9: 1)
Health Care and Social Assistance: Homes for the Elderly (50-99: 2)
People in group quarters in 2010:
85 people in nursing facilities/skilled-nursing facilities
10 people in group homes intended for adults
People in group quarters in 2000:
151 people in nursing homes
11 people in homes for the mentally retarded
Fatal accident statistics in 2012:
Fatal accident count: 1
Vehicles involved in fatal accidents: 2
Fatal accidents caused by drunken drivers: 0
Fatalities: 1
Persons involved in fatal accidents: 2
Pedestrians involved in fatal accidents: 0
Fatal accident statistics in 2010:
Fatal accident count: 3
Vehicles involved in fatal accidents: 4
Fatal accidents caused by drunken drivers: 1
Fatalities: 3
Persons involved in fatal accidents: 6
Pedestrians involved in fatal accidents: 0
Home Mortgage Disclosure Act Aggregated Statistics For Year 2009 (Based on 4 full tracts)
A) FHA, FSA/RHS & VA Home Purchase Loans
B) Conventional Home Purchase Loans
C) Refinancings
D) Home Improvement Loans
F) Non-occupant Loans on < 5 Family Dwellings (A B C & D)
Number
Average Value
Number
Average Value
Number
Average Value
Number
Average Value
Number
Average Value
LOANS ORIGINATED
30
$308,080
146
$318,679
498
$299,297
18
$119,833
10
$229,011
APPLICATIONS APPROVED, NOT ACCEPTED
2
$345,550
14
$389,304
32
$334,798
2
$13,735
0
$0
APPLICATIONS DENIED
4
$460,742
18
$497,354
178
$323,688
12
$163,629
8
$162,478
APPLICATIONS WITHDRAWN
2
$269,650
18
$414,167
99
$317,726
4
$149,588
0
$0
FILES CLOSED FOR INCOMPLETENESS
2
$298,610
4
$441,895
26
$409,156
2
$19,620
0
$0
Aggregated Statistics For Year 2008 (Based on 4 full tracts)
A) FHA, FSA/RHS & VA Home Purchase Loans
B) Conventional Home Purchase Loans
C) Refinancings
D) Home Improvement Loans
F) Non-occupant Loans on < 5 Family Dwellings (A B C & D)
Number
Average Value
Number
Average Value
Number
Average Value
Number
Average Value
Number
Average Value
LOANS ORIGINATED
6
$296,305
144
$370,065
261
$285,559
30
$92,981
14
$371,229
APPLICATIONS APPROVED, NOT ACCEPTED
0
$0
41
$384,820
53
$281,141
10
$167,961
0
$0
APPLICATIONS DENIED
0
$0
22
$298,658
123
$353,073
30
$251,245
6
$352,470
APPLICATIONS WITHDRAWN
0
$0
34
$297,024
59
$365,093
10
$174,617
8
$358,764
FILES CLOSED FOR INCOMPLETENESS
0
$0
10
$338,626
16
$328,455
2
$99,870
0
$0
Aggregated Statistics For Year 2007 (Based on 4 full tracts)
A) FHA, FSA/RHS & VA Home Purchase Loans
B) Conventional Home Purchase Loans
C) Refinancings
D) Home Improvement Loans
F) Non-occupant Loans on < 5 Family Dwellings (A B C & D)
Number
Average Value
Number
Average Value
Number
Average Value
Number
Average Value
Number
Average Value
LOANS ORIGINATED
4
$226,588
225
$356,682
287
$309,615
71
$142,324
14
$279,864
APPLICATIONS APPROVED, NOT ACCEPTED
0
$0
30
$352,736
77
$322,062
8
$157,902
4
$318,585
APPLICATIONS DENIED
0
$0
26
$430,490
99
$371,009
32
$105,639
4
$228,060
APPLICATIONS WITHDRAWN
0
$0
12
$455,693
49
$338,760
10
$242,079
2
$318,585
FILES CLOSED FOR INCOMPLETENESS
0
$0
12
$457,962
26
$333,180
0
$0
2
$520,860
Aggregated Statistics For Year 2006 (Based on 4 full tracts)
A) FHA, FSA/RHS & VA Home Purchase Loans
B) Conventional Home Purchase Loans
C) Refinancings
D) Home Improvement Loans
F) Non-occupant Loans on < 5 Family Dwellings (A B C & D)
Number
Average Value
Number
Average Value
Number
Average Value
Number
Average Value
Number
Average Value
LOANS ORIGINATED
2
$161,790
287
$311,788
269
$283,339
93
$125,370
24
$256,743
APPLICATIONS APPROVED, NOT ACCEPTED
0
$0
49
$344,254
65
$352,942
14
$90,458
2
$73,565
APPLICATIONS DENIED
0
$0
45
$376,819
144
$448,606
22
$56,702
8
$134,384
APPLICATIONS WITHDRAWN
0
$0
24
$465,834
115
$379,797
4
$287,130
4
$943,772
FILES CLOSED FOR INCOMPLETENESS
0
$0
18
$226,527
40
$293,391
0
$0
4
$219,722
Aggregated Statistics For Year 2005 (Based on 4 full tracts)
B) Conventional Home Purchase Loans
C) Refinancings
D) Home Improvement Loans
F) Non-occupant Loans on < 5 Family Dwellings (A B C & D)
Number
Average Value
Number
Average Value
Number
Average Value
Number
Average Value
LOANS ORIGINATED
295
$345,443
308
$292,910
81
$169,811
10
$231,227
APPLICATIONS APPROVED, NOT ACCEPTED
45
$474,898
69
$253,432
24
$193,605
4
$219,715
APPLICATIONS DENIED
51
$470,741
140
$367,508
40
$140,363
2
$318,585
APPLICATIONS WITHDRAWN
43
$319,946
119
$295,158
10
$85,124
4
$169,998
FILES CLOSED FOR INCOMPLETENESS
8
$258,957
36
$254,937
2
$249,675
2
$219,720
Aggregated Statistics For Year 2004 (Based on 4 full tracts)
A) FHA, FSA/RHS & VA Home Purchase Loans
B) Conventional Home Purchase Loans
C) Refinancings
D) Home Improvement Loans
F) Non-occupant Loans on < 5 Family Dwellings (A B C & D)
Number
Average Value
Number
Average Value
Number
Average Value
Number
Average Value
Number
Average Value
LOANS ORIGINATED
2
$262,880
253
$318,513
461
$281,969
55
$114,578
16
$257,065
APPLICATIONS APPROVED, NOT ACCEPTED
0
$0
34
$357,081
89
$239,869
14
$203,288
14
$154,702
APPLICATIONS DENIED
0
$0
36
$277,714
126
$260,137
22
$99,125
6
$213,143
APPLICATIONS WITHDRAWN
0
$0
32
$297,785
93
$267,704
16
$139,996
2
$49,935
FILES CLOSED FOR INCOMPLETENESS
0
$0
14
$333,188
55
$301,281
2
$39,950
0
$0
Aggregated Statistics For Year 2003 (Based on 4 full tracts)
A) FHA, FSA/RHS & VA Home Purchase Loans
B) Conventional Home Purchase Loans
C) Refinancings
D) Home Improvement Loans
F) Non-occupant Loans on < 5 Family Dwellings (A B C & D)
Number
Average Value
Number
Average Value
Number
Average Value
Number
Average Value
Number
Average Value
LOANS ORIGINATED
4
$142,720
312
$327,458
1,539
$245,744
41
$118,737
30
$298,073
APPLICATIONS APPROVED, NOT ACCEPTED
0
$0
39
$306,318
170
$234,168
10
$45,784
0
$0
APPLICATIONS DENIED
0
$0
31
$285,295
174
$254,063
14
$101,034
12
$142,333
APPLICATIONS WITHDRAWN
0
$0
26
$230,132
142
$249,593
2
$14,715
0
$0
FILES CLOSED FOR INCOMPLETENESS
0
$0
10
$308,294
34
$293,221
0
$0
0
$0
Aggregated Statistics For Year 2002 (Based on 4 full tracts)
A) FHA, FSA/RHS & VA Home Purchase Loans
B) Conventional Home Purchase Loans
C) Refinancings
D) Home Improvement Loans
F) Non-occupant Loans on < 5 Family Dwellings (A B C & D)
Number
Average Value
Number
Average Value
Number
Average Value
Number
Average Value
Number
Average Value
LOANS ORIGINATED
6
$156,290
318
$287,262
926
$243,579
34
$74,763
10
$151,059
APPLICATIONS APPROVED, NOT ACCEPTED
0
$0
34
$272,007
115
$257,068
14
$32,510
2
$132,825
APPLICATIONS DENIED
0
$0
24
$317,112
112
$237,670
24
$51,709
6
$190,622
APPLICATIONS WITHDRAWN
0
$0
41
$287,363
119
$276,301
4
$20,840
4
$237,378
FILES CLOSED FOR INCOMPLETENESS
0
$0
16
$306,311
32
$233,124
0
$0
0
$0
Aggregated Statistics For Year 2001 (Based on 4 full tracts)
A) FHA, FSA/RHS & VA Home Purchase Loans
B) Conventional Home Purchase Loans
C) Refinancings
D) Home Improvement Loans
E) Loans on Dwellings For 5+ Families
F) Non-occupant Loans on < 5 Family Dwellings (A B C & D)
Number
Average Value
Number
Average Value
Number
Average Value
Number
Average Value
Number
Average Value
Number
Average Value
LOANS ORIGINATED
8
$144,682
268
$252,161
575
$225,320
59
$59,584
0
$0
8
$162,358
APPLICATIONS APPROVED, NOT ACCEPTED
0
$0
28
$252,303
83
$193,302
8
$44,729
0
$0
0
$0
APPLICATIONS DENIED
0
$0
40
$213,980
111
$210,877
30
$67,309
0
$0
10
$121,287
APPLICATIONS WITHDRAWN
0
$0
24
$265,701
65
$216,772
10
$93,186
8
$54,195
0
$0
FILES CLOSED FOR INCOMPLETENESS
0
$0
8
$170,186
16
$229,049
2
$49,045
0
$0
0
$0
Aggregated Statistics For Year 2000 (Based on 4 full tracts)
A) FHA, FSA/RHS & VA Home Purchase Loans
B) Conventional Home Purchase Loans
C) Refinancings
D) Home Improvement Loans
E) Loans on Dwellings For 5+ Families
F) Non-occupant Loans on < 5 Family Dwellings (A B C & D)
Number
Average Value
Number
Average Value
Number
Average Value
Number
Average Value
Number
Average Value
Number
Average Value
LOANS ORIGINATED
4
$138,308
221
$257,239
132
$200,389
49
$42,769
2
$60,815
2
$311,925
APPLICATIONS APPROVED, NOT ACCEPTED
0
$0
22
$263,171
49
$189,239
8
$58,769
0
$0
0
$0
APPLICATIONS DENIED
0
$0
40
$193,414
71
$139,954
20
$52,613
0
$0
2
$98,090
APPLICATIONS WITHDRAWN
2
$150,080
20
$298,484
36
$169,942
12
$67,108
0
$0
4
$134,820
FILES CLOSED FOR INCOMPLETENESS
0
$0
10
$309,672
10
$140,000
0
$0
0
$0
0
$0
Aggregated Statistics For Year 1999 (Based on 2 full tracts)
A) FHA, FSA/RHS & VA Home Purchase Loans
B) Conventional Home Purchase Loans
C) Refinancings
D) Home Improvement Loans
F) Non-occupant Loans on < 5 Family Dwellings (A B C & D)
Detailed PMIC statistics for the following Tracts:1601.00
, 1602.00
2002 - 2018 National Fire Incident Reporting System (NFIRS) incidents
According to the data from the years 2002 - 2018 the average number of fires per year is 22. The highest number of fires - 52 took place in 2016, and the least - 0 in 2003. The data has a growing trend.
When looking into fire subcategories, the most reports belonged to: Outside Fires (49.2%), and Structure Fires (30.9%).
Fire incident types reported to NFIRS in Zip Code 06525


 Nearest zip codes: 06515, 06524, 06514, 06401, 06477, 06483.


 According to the data from the years 2002 - 2018 the average number of fires per year is 22. The highest number of fires - 52 took place in 2016, and the least - 0 in 2003. The data has a growing trend.
 When looking into fire subcategories, the most reports belonged to: Outside Fires (49.2%), and Structure Fires (30.9%).