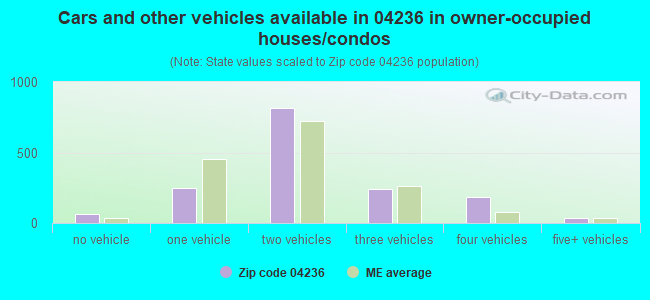
Estimated zip code population in 2022: 4,435 Zip code population in 2010: 4,350 Zip code population in 2000: 4,096
Houses and condos: 1,906 Renter-occupied apartments: 167
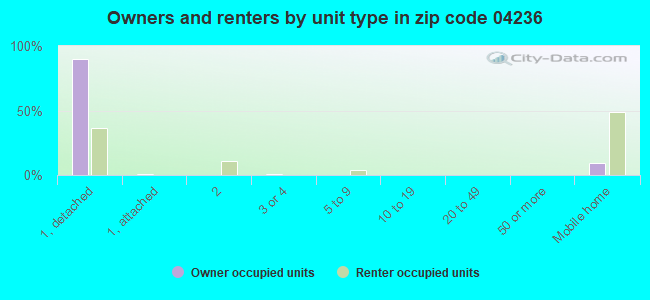
% of renters here:
9%
State:
26%
March 2022 cost of living index in zip code 04236: 86.7 (less than average, U.S. average is 100)
Land area: 32.3 sq. mi. Water area: 2.9 sq. mi.
Population density: 137 people per square mile
(very low).
OSM Map
Google Map
MSN Map
OSM Map
General Map
Google Map
MSN Map
OSM Map
Google Map
MSN Map
OSM Map
Google Map
MSN Map
Please wait while loading the map...
Real estate property taxes paid for housing units in 2022:
This zip code:
0.9% ($2,626)
Maine:
1.0% ($2,785)
Median real estate property taxes paid for housing units with mortgages in 2022: $2,652 (0.9%) Median real estate property taxes paid for housing units with no mortgage in 2022: $2,551 (0.9%)
Business Search- 14 Million verified businesses
Males: 2,315
(52.2%)
Females: 2,120
(47.8%)
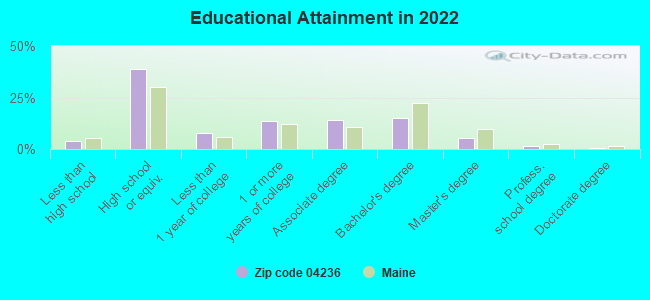
For population 25 years and over in 04236:
High school or higher: 95.9%
Bachelor's degree or higher: 22.1%
Graduate or professional degree: 7.0%
Unemployed: 0.4%
Mean travel time to work (commute): 27.4 minutes
For population 15 years and over in 04236:
Never married: 19.1%
Now married: 65.5%
Separated: 0.0%
Widowed: 3.5%
Divorced: 11.9%
Zip code 04236 compared to state average:
Unemployed percentage significantly below state average.
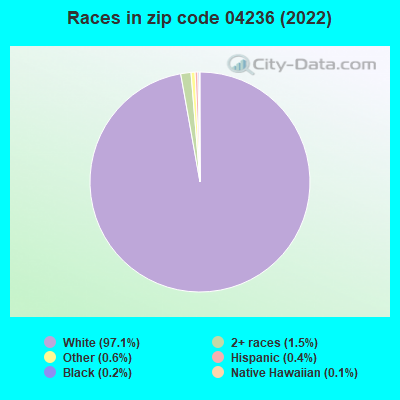
Black race population percentage significantly below state average.
Hispanic race population percentage significantly below state average.
Renting percentage significantly below state average.
Length of stay since moving in significantly above state average.
Percentage of population with a bachelor's degree or higher below state average.
Averages for the 2020 tax year for zip code 04236, filed in 2021:
Average Adjusted Gross Income (AGI) in 2020: $61,027 (Individual Income Tax Returns)
Here:
$61,027
State:
$68,227
Salary/wage: $52,870 (reported on 84.1% of returns)
Here:
$52,870
State:
$55,127
(% of AGI for various income ranges: 1133.0% for AGIs below $25k, 3599.8% for AGIs $25k-50k, 7142.5% for AGIs $50k-75k, 10381.9% for AGIs $75k-100k, 16800.0% for AGIs $100k-200k)
Taxable interest for individuals: $1,107 (reported on 37.2% of returns)
This zip code:
$1,107
Maine:
$1,162
(% of AGI for various income ranges: 18.0% for AGIs below $25k, 10.0% for AGIs $25k-50k, 84.2% for AGIs $50k-75k, 50.6% for AGIs $75k-100k, 159.5% for AGIs $100k-200k)
Ordinary dividends: $3,381 (reported on 13.7% of returns)
Here:
$3,381
State:
$7,695
(% of AGI for various income ranges: 12.3% for AGIs below $25k, 17.8% for AGIs $25k-50k, 57.1% for AGIs $50k-75k, 55.6% for AGIs $75k-100k, 245.5% for AGIs $100k-200k)
Net capital gain/loss in AGI: +$11,411 (reported on 11.9% of returns)
Here:
+$11,411
State:
+$22,201
(% of AGI for various income ranges: 5.7% for AGIs below $25k, 32.0% for AGIs $25k-50k, 116.7% for AGIs $50k-75k, 114.4% for AGIs $75k-100k, 550.0% for AGIs $100k-200k)
Profit/loss from business: +$10,689 (reported on 12.4% of returns)
Here:
+$10,689
State:
+$15,095
(% of AGI for various income ranges: 96.6% for AGIs below $25k, 164.4% for AGIs $25k-50k, 181.7% for AGIs $50k-75k, 153.1% for AGIs $75k-100k, 532.5% for AGIs $100k-200k)
Taxable individual retirement arrangement distribution: $14,285 (reported on 8.8% of returns)
04236:
$14,285
Maine:
$18,314
(% of AGI for various income ranges: 96.1% for AGIs below $25k, 88.8% for AGIs $25k-50k, 249.2% for AGIs $50k-75k, 328.1% for AGIs $75k-100k, 433.5% for AGIs $100k-200k)
Total itemized deductions: $25,044 (reported on 4.0% of returns)
Here:
$25,044
State:
$31,197
(% of AGI for various income ranges: 289.6% for AGIs $50k-75k, 309.4% for AGIs $75k-100k, 532.0% for AGIs $100k-200k)
Charity contributions: $4,467 (reported on 2.7% of returns)
Here:
$4,467
State:
$9,863
(% of AGI for various income ranges: 21.7% for AGIs $50k-75k, 108.0% for AGIs $100k-200k)
Taxes paid: $8,067 (reported on 4.0% of returns)
04236:
$8,067
State:
$8,241
(% of AGI for various income ranges: 95.8% for AGIs $50k-75k, 104.4% for AGIs $75k-100k, 164.5% for AGIs $100k-200k)
Earned income credit: $2,056 (reported on 14.2% of returns)
Here:
$2,056
State:
$1,960
(% of AGI for various income ranges: 71.1% for AGIs below $25k, 69.0% for AGIs $25k-50k)
Percentage of individuals using paid preparers for their 2020 taxes: 91.2%
Here:
91%
State:
92%
(% for various income ranges: 91.9% for AGIs below $25k, 90.9% for AGIs $25k-50k, 89.2% for AGIs $50k-75k, 87.5% for AGIs $75k-100k, 93.8% for AGIs $100k-200k, 100.0% for AGIs over 200k)
Averages for the 2012 tax year for zip code 04236, filed in 2013:
Average Adjusted Gross Income (AGI) in 2012: $49,105 (Individual Income Tax Returns)
Here:
$49,105
State:
$52,375
Salary/wage: $44,904 (reported on 87.7% of returns)
Here:
$44,904
State:
$43,415
(% of AGI for various income ranges: 74.8% for AGIs below $25k, 83.2% for AGIs $25k-50k, 82.9% for AGIs $50k-75k, 82.9% for AGIs $75k-100k, 75.9% for AGIs $100k-200k)
Taxable interest for individuals: $794 (reported on 30.5% of returns)
This zip code:
$794
Maine:
$1,221
(% of AGI for various income ranges: 1.1% for AGIs below $25k, 0.6% for AGIs $25k-50k, 0.3% for AGIs $50k-75k, 0.6% for AGIs $75k-100k, 0.3% for AGIs $100k-200k)
Ordinary dividends: $1,931 (reported on 15.8% of returns)
Here:
$1,931
State:
$5,812
(% of AGI for various income ranges: 0.8% for AGIs below $25k, 0.7% for AGIs $25k-50k, 0.3% for AGIs $50k-75k, 0.9% for AGIs $75k-100k, 0.6% for AGIs $100k-200k)
Net capital gain/loss in AGI: +$2,204 (reported on 11.3% of returns)
Here:
+$2,204
State:
+$11,897
(% of AGI for various income ranges: 0.2% for AGIs below $25k, 0.5% for AGIs $25k-50k, 0.8% for AGIs $50k-75k, 0.5% for AGIs $75k-100k, 0.4% for AGIs $100k-200k)
Profit/loss from business: +$7,267 (reported on 16.3% of returns)
Here:
+$7,267
State:
+$12,144
(% of AGI for various income ranges: 6.2% for AGIs below $25k, 2.1% for AGIs $25k-50k, 1.7% for AGIs $50k-75k, 1.7% for AGIs $75k-100k, 2.4% for AGIs $100k-200k)
Taxable individual retirement arrangement distribution: $10,145 (reported on 9.9% of returns)
04236:
$10,145
Maine:
$13,385
(% of AGI for various income ranges: 4.5% for AGIs below $25k, 2.6% for AGIs $25k-50k, 1.6% for AGIs $50k-75k, 2.2% for AGIs $75k-100k, 1.1% for AGIs $100k-200k)
Total itemized deductions: $17,835 (23% of AGI, reported on 32.5% of returns)
Here:
$17,835
State:
$21,859
Here:
22.6% of AGI
State:
20.9% of AGI
(% of AGI for various income ranges: 8.0% for AGIs below $25k, 9.4% for AGIs $25k-50k, 12.4% for AGIs $50k-75k, 12.7% for AGIs $75k-100k, 13.7% for AGIs $100k-200k)
Charity contributions: $1,690 (reported on 23.6% of returns)
Here:
$1,690
State:
$2,741
(% of AGI for various income ranges: 0.6% for AGIs below $25k, 0.6% for AGIs $25k-50k, 0.5% for AGIs $50k-75k, 0.8% for AGIs $75k-100k, 1.2% for AGIs $100k-200k)
Taxes paid: $7,556 (reported on 32.5% of returns)
04236:
$7,556
State:
$9,996
(% of AGI for various income ranges: 2.0% for AGIs below $25k, 2.9% for AGIs $25k-50k, 4.2% for AGIs $50k-75k, 5.6% for AGIs $75k-100k, 7.7% for AGIs $100k-200k)
Earned income credit: $2,073 (reported on 16.3% of returns)
Here:
$2,073
State:
$1,959
(% of AGI for various income ranges: 5.4% for AGIs below $25k, 0.9% for AGIs $25k-50k)
Percentage of individuals using paid preparers for their 2012 taxes: 48.3%
Here:
48%
State:
48%
(% for various income ranges: 41.4% for AGIs below $25k, 44.6% for AGIs $25k-50k, 52.8% for AGIs $50k-75k, 56.5% for AGIs $75k-100k, 66.7% for AGIs $100k-200k)
Averages for the 2004 tax year for zip code 04236, filed in 2005:
Average Adjusted Gross Income (AGI) in 2004: $40,736 (Individual Income Tax Returns)
Here:
$40,736
State:
$42,606
Salary/wage: $38,063 (reported on 90.6% of returns)
Here:
$38,063
State:
$36,376
(% of AGI for various income ranges: 106.9% for AGIs below $10k, 83.7% for AGIs $10k-25k, 87.2% for AGIs $25k-50k, 88.6% for AGIs $50k-75k, 86.5% for AGIs $75k-100k, 73.8% for AGIs over 100k)
Taxable interest for individuals: $689 (reported on 48.9% of returns)
This zip code:
$689
Maine:
$1,367
(% of AGI for various income ranges: 3.7% for AGIs below $10k, 1.5% for AGIs $10k-25k, 1.0% for AGIs $25k-50k, 0.6% for AGIs $50k-75k, 0.8% for AGIs $75k-100k, 0.5% for AGIs over 100k)
Taxable dividends: $1,607 (reported on 18.7% of returns)
Here:
$1,607
State:
$3,533
(% of AGI for various income ranges: 2.9% for AGIs below $10k, 0.7% for AGIs $10k-25k, 0.5% for AGIs $25k-50k, 0.5% for AGIs $50k-75k, 1.0% for AGIs $75k-100k, 1.0% for AGIs over 100k)
Net capital gain/loss: +$5,091 (reported on 13.7% of returns)
Here:
+$5,091
State:
+$11,433
(% of AGI for various income ranges: -1.3% for AGIs below $10k, -0.3% for AGIs $10k-25k, 1.0% for AGIs $25k-50k, 0.8% for AGIs $50k-75k, 3.3% for AGIs $75k-100k, 4.0% for AGIs over 100k)
Profit/loss from business: +$9,363 (reported on 16.8% of returns)
Here:
+$9,363
State:
+$10,755
(% of AGI for various income ranges: 13.5% for AGIs below $10k, 5.2% for AGIs $10k-25k, 3.4% for AGIs $25k-50k, 2.9% for AGIs $50k-75k, 1.0% for AGIs $75k-100k, 6.1% for AGIs over 100k)
IRA payment deduction: $3,512 (reported on 4.1% of returns)
04236:
$3,512
Maine:
$3,014
(% of AGI for various income ranges: 0.5% for AGIs $10k-25k, 0.7% for AGIs $25k-50k, 0.2% for AGIs $50k-75k, 0.6% for AGIs $75k-100k)
Total itemized deductions: $14,539 (21% of AGI, reported on 36.1% of returns)
Here:
$14,539
State:
$18,231
Here:
21.0% of AGI
State:
21.7% of AGI
(% of AGI for various income ranges: 5.9% for AGIs below $10k, 7.9% for AGIs $10k-25k, 11.4% for AGIs $25k-50k, 14.4% for AGIs $50k-75k, 15.7% for AGIs $75k-100k, 13.5% for AGIs over 100k)
Charity contributions deductions: $1,397 (2% of AGI, reported on 31.9% of returns)
Here:
$1,397
State:
$2,466
Here:
1.9% of AGI
State:
2.8% of AGI
(% of AGI for various income ranges: 0.5% for AGIs $10k-25k, 1.0% for AGIs $25k-50k, 1.1% for AGIs $50k-75k, 1.3% for AGIs $75k-100k, 1.5% for AGIs over 100k)
Total tax: $5,061 (reported on 76.7% of returns)
04236:
$5,061
State:
$6,047
(% of AGI for various income ranges: 4.1% for AGIs below $10k, 4.6% for AGIs $10k-25k, 6.6% for AGIs $25k-50k, 7.9% for AGIs $50k-75k, 9.6% for AGIs $75k-100k, 17.7% for AGIs over 100k)
Earned income credit: $1,674 (reported on 12.4% of returns)
Here:
$1,674
State:
$1,520
Percentage of individuals using paid preparers for their 2004 taxes: 53.1%
Here:
53%
State:
53%
(% for various income ranges: 41.4% for AGIs below $10k, 47.7% for AGIs $10k-25k, 53.4% for AGIs $25k-50k, 61.9% for AGIs $50k-75k, 66.4% for AGIs $75k-100k, 69.3% for AGIs over 100k)
Likely homosexual households (counted as self-reported same-sex unmarried-partner households)
Lesbian couples: 1.1% of all households
Gay men: 0.0% of all households
Household received Food Stamps/SNAP in the past 12 months: 107 Household did not receive Food Stamps/SNAP in the past 12 months: 1,670
Women who had a birth in the past 12 months: 54 (53 now married, 0 unmarried) Women who did not have a birth in the past 12 months: 951 (536 now married, 414 unmarried)
Housing units in zip code 04236 with a mortgage: 1,209 (104 second mortgage, 105 both second mortgage and home equity loan) Houses without a mortgage: 237
Median monthly owner costs for units with a mortgage: $1,457 Median monthly owner costs for units without a mortgage: $648
Residents with income below the poverty level in 2022:
This zip code:
8.5%
Whole state:
10.8%
Residents with income below 50% of the poverty level in 2022:
This zip code:
3.5%
Whole state:
5.8%
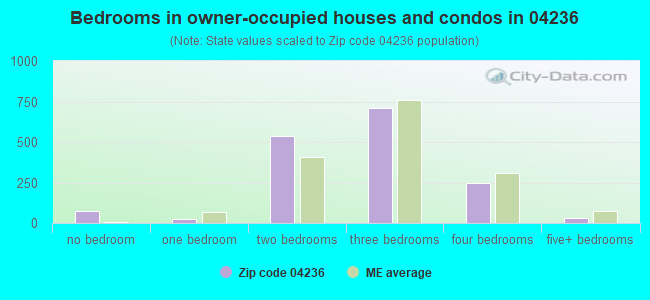
Median number of rooms in houses and condos:
Here:
6.1
State:
6.1
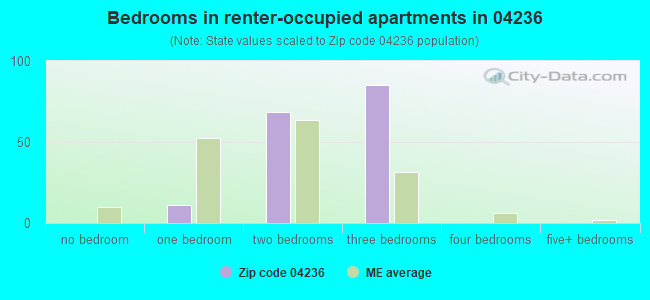
Median number of rooms in apartments:
Here:
5.2
State:
4.0
Notable locations in this zip code not listed on our city pages
Churches in zip code 04236 include: Greene Baptist Church (A), Sawyer Memorial Church (B), Saint Francis Catholic Church (C). Display/hide their locations on the map
Cemeteries: Valley Cemetery (1), Sylvester Cemetery (2), River Road Cemetery (3), Rose Cemetery (4), Moss Cemetery (5), Peare Cemetery (6), Greenwood Cemetery (7). Display/hide their locations on the map
In group quarters: 8 (-1 institutionalized population)
Size of family households: 702 2-persons, 340 3-persons, 178 4-persons, 119 5-persons
Size of nonfamily households: 271 1-person, 147 2-persons, 14 3-persons
548 married couples with children.
213 single-parent households (78 men, 135 women).
95.7% of residents of 04236 zip code speak English at home.
3.9% of residents speak other Indo-European language at home (87% very well, 4% well, 10% not well).
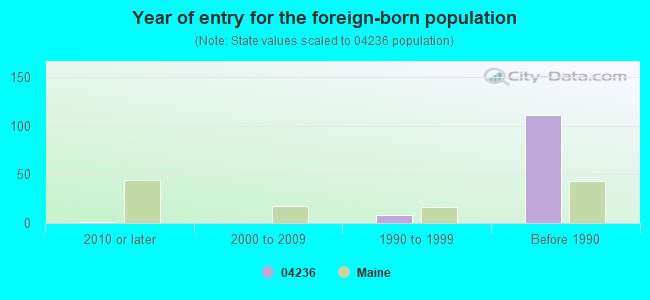
Foreign born population: 125 (2.8%) (37.3% of them are naturalized citizens)
This zip code:
2.8%
Whole state:
4.1%
8%Belgium
1%Zimbabwe
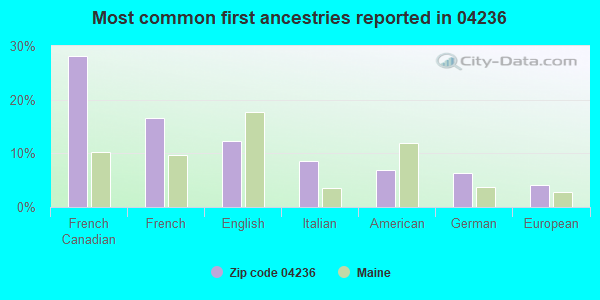
28%French Canadian
17%French
12%English
9%Italian
7%American
6%German
4%European
Year of entry for the foreign-born population
12010 or later
02000 to 2009
81990 to 1999
111Before 1990
Facilities with environmental interests located in this zip code:
GREENE ME DPW MUNICIPAL VEHICLE MAINTENANCE FACILITY (ADDRESS NOT IN ICIS in GREENE, ME)
ENFORCEMENT/COMPLIANCE ACTIVITY (Integrated Compliance Information System) - ICIS-01-2002-0082, FORMAL ENFORCEMENT ACTION (Integrated Compliance Information System) - ICIS-01-2002-0082, FORMAL ENFORCEMENT ACTION
GREENE CENTRAL SCHOOL (41 MAIN STREET in GREENE, ME)
(Geographic Names Information System) (National Center for Education Statistics) - STATE ID-17801 Organizations: MSAD 52 TURNER (SCHOOL DISTRICT)
MAINE POLY INCORPORATED (933 ROUTE 202 in GREENE, ME)
AIR SYNTHETIC MINOR (AIRS/AFS) CRITERIA AND HAZARDOUS AIR POLLUTANT INVENTORY (Inventory of air pollution sources) HAZARDOUS WASTE BIENNIAL REPORTER (Resource Conservation and Recovery Act (tracking hazardous waste)) Small Quantity Generators, between 100 kg and 1000 kg of hazardous waste/month (Resource Conservation and Recovery Act (tracking hazardous waste)) Business SIC classification: UNSUPPORTED PLASTICS PROFILE SHAPES; LAMINATED PLASTICS PLATE, SHEET, AND PROFILE SHAPES; PLASTICS PRODUCTS Business NAICS classification: COMMERCIAL FLEXOGRAPHIC PRINTING.; UNSUPPORTED PLASTICS BAG MANUFACTURING.; UNLAMINATED PLASTICS PROFILE SHAPE MANUFACTURING. Organizations: MPAC (CONTACT/OPERATOR)
, IPAC (CONTACT/OWNER)
Alternative names: ME POLY ACQUISITION CORP
MORGANS MOBIL (ROUTE 202 in GREENE, ME)
(Integrated Compliance Information System) - ICIS-01-1997-0083, FORMAL ENFORCEMENT ACTION
Housing units lacking complete plumbing facilities: 2.4% Housing units lacking complete kitchen facilities: 2.0%
71.9%Fuel oil, kerosene, etc.
13.3%Wood
8.2%Bottled, tank, or LP gas
3.1%Other fuel
2.1%No fuel used
1.4%Electricity
Population in 1990: 3,661. Population change in the 1990s: +435 (+11.9%).
Place of birth for U.S.-born residents:
This state: 3,426
Northeast: 593
Midwest: 60
South: 113
West: 35
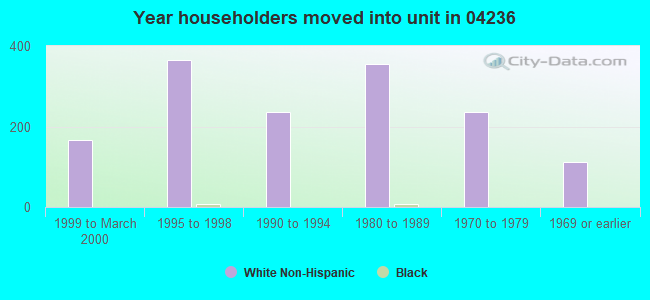
65% of the 04236 zip code residents lived in the same house 5 years ago. Out of people who lived in different houses, 76% lived in this county. Out of people who lived in different counties, 50% lived in Maine.
97% of the 04236 zip code residents lived in the same house 1 year ago. Out of people who lived in different houses, 77% moved from this county. Out of people who lived in different houses, 41% moved from different county within same state.
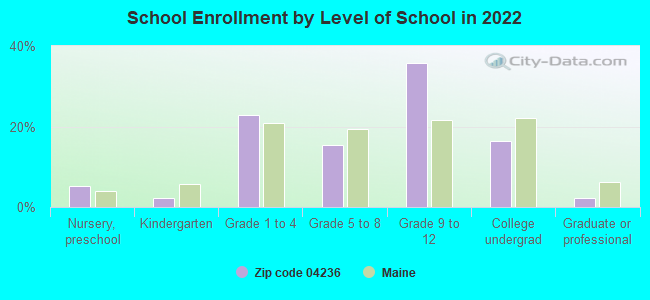
Private vs. public school enrollment:
Students in private schools in grades 1 to 8 (elementary and middle school): 12
Here:
3.9%
Maine:
12.7%
Students in private schools in grades 9 to 12 (high school): 2
Here:
0.9%
Maine:
12.6%
Students in private undergraduate colleges: 23
Here:
17.7%
Maine:
34.5%
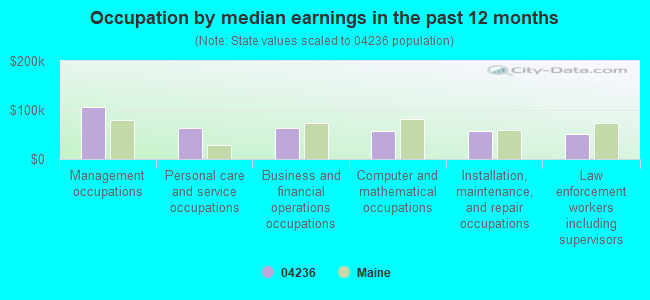
Occupation by median earnings in the past 12 months ($)
105,831Management occupations
63,063Personal care and service occupations
62,596Business and financial operations occupations
57,731Computer and mathematical occupations
56,299Installation, maintenance, and repair occupations
51,245Law enforcement workers including supervisors
Companies with federal contracts located in this zip code:
AUBURN ENTERPRISES LLC (57 LABRIE LANE in GREENE, ME; small business) : $0 in 2 contractsfrom 2003 to 2004
$118,265 with Army for Pollution Control and Abatement -- Applied Research and Exploratory Development (R&D). Signed on 2003-12-17. Completion date: 2004-09-16.
-$118,265, same as above.Signed on 2004-09-24. Completion date: 2004-09-16.
Top industries in this zip code by the number of employees in 2005:
Administrative and Support and Waste Management and Remediation Services: Janitorial Services (20-49 employees: 1 establishment, 10-19 employees: 1 establishment, 5-9 employees: 1 establishment)
Construction: Plumbing, Heating, and Air-Conditioning Contractors (20-49: 1, 1-4: 2)
Wholesale Trade: General Line Grocery Merchant Wholesalers (20-49: 1)
Construction: New Single-Family Housing Construction (except Operative Builders) (1-4: 11)
Health Care and Social Assistance: Child Day Care Services (10-19: 1, 5-9: 1)
Other Services (except Public Administration): General Automotive Repair (10-19: 1, 1-4: 1)
Accommodation and Food Services: Limited-Service Restaurants (5-9: 2, 1-4: 1)
People in group quarters in 2010:
6 people in group homes intended for adults
People in group quarters in 2000:
14 people in other group homes
6 people in homes for the mentally ill
4 people in homes for the mentally retarded
Fatal accident statistics in 2014:
Fatal accident count: 1
Vehicles involved in fatal accidents: 1
Fatal accidents caused by drunken drivers: 1
Fatalities: 1
Persons involved in fatal accidents: 1
Pedestrians involved in fatal accidents: 0
Fatal accident statistics in 2012:
Fatal accident count: 1
Vehicles involved in fatal accidents: 2
Fatal accidents caused by drunken drivers: 0
Fatalities: 1
Persons involved in fatal accidents: 2
Pedestrians involved in fatal accidents: 0
Home Mortgage Disclosure Act Aggregated Statistics For Year 2009 (Based on 2 partial tracts)
A) FHA, FSA/RHS & VA Home Purchase Loans
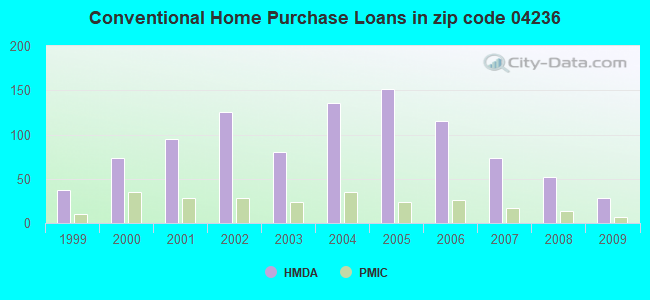
B) Conventional Home Purchase Loans
C) Refinancings
D) Home Improvement Loans
F) Non-occupant Loans on < 5 Family Dwellings (A B C & D)
G) Loans On Manufactured Home Dwelling (A B C & D)
Number
Average Value
Number
Average Value
Number
Average Value
Number
Average Value
Number
Average Value
Number
Average Value
LOANS ORIGINATED
30
$143,902
28
$140,502
219
$150,918
43
$56,814
13
$135,149
13
$57,492
APPLICATIONS APPROVED, NOT ACCEPTED
0
$0
4
$204,512
35
$150,064
4
$92,960
2
$185,920
2
$88,310
APPLICATIONS DENIED
2
$195,215
13
$118,417
99
$145,224
22
$36,255
4
$36,255
17
$69,337
APPLICATIONS WITHDRAWN
2
$171,975
0
$0
22
$153,553
4
$132,002
0
$0
0
$0
FILES CLOSED FOR INCOMPLETENESS
2
$132,005
2
$65,070
4
$161,285
0
$0
2
$145,945
0
$0
Aggregated Statistics For Year 2008 (Based on 2 partial tracts)
A) FHA, FSA/RHS & VA Home Purchase Loans
B) Conventional Home Purchase Loans
C) Refinancings
D) Home Improvement Loans
E) Loans on Dwellings For 5+ Families
F) Non-occupant Loans on < 5 Family Dwellings (A B C & D)
G) Loans On Manufactured Home Dwelling (A B C & D)
Number
Average Value
Number
Average Value
Number
Average Value
Number
Average Value
Number
Average Value
Number
Average Value
Number
Average Value
LOANS ORIGINATED
13
$127,141
52
$142,586
177
$150,469
56
$46,613
0
$0
19
$108,616
22
$87,467
APPLICATIONS APPROVED, NOT ACCEPTED
0
$0
13
$148,879
32
$124,741
13
$79,945
2
$178,485
6
$104,735
6
$27,578
APPLICATIONS DENIED
6
$148,427
22
$133,355
104
$159,480
15
$114,527
0
$0
11
$137,581
15
$93,951
APPLICATIONS WITHDRAWN
2
$76,225
2
$80,875
41
$136,447
4
$137,580
2
$198,005
0
$0
6
$115,270
FILES CLOSED FOR INCOMPLETENESS
0
$0
2
$185,920
0
$0
2
$181,270
0
$0
0
$0
0
$0
Aggregated Statistics For Year 2007 (Based on 2 partial tracts)
A) FHA, FSA/RHS & VA Home Purchase Loans
B) Conventional Home Purchase Loans
C) Refinancings
D) Home Improvement Loans
F) Non-occupant Loans on < 5 Family Dwellings (A B C & D)
G) Loans On Manufactured Home Dwelling (A B C & D)
Number
Average Value
Number
Average Value
Number
Average Value
Number
Average Value
Number
Average Value
Number
Average Value
LOANS ORIGINATED
13
$135,865
74
$137,731
186
$123,367
93
$50,838
13
$99,252
26
$68,576
APPLICATIONS APPROVED, NOT ACCEPTED
0
$0
15
$137,457
32
$110,797
9
$59,494
2
$98,540
0
$0
APPLICATIONS DENIED
2
$135,720
15
$152,331
119
$141,455
32
$66,873
6
$131,073
13
$77,943
APPLICATIONS WITHDRAWN
0
$0
7
$93,491
61
$135,783
11
$92,622
0
$0
0
$0
FILES CLOSED FOR INCOMPLETENESS
0
$0
0
$0
9
$158,239
4
$155,242
0
$0
0
$0
Aggregated Statistics For Year 2006 (Based on 2 partial tracts)
A) FHA, FSA/RHS & VA Home Purchase Loans
B) Conventional Home Purchase Loans
C) Refinancings
D) Home Improvement Loans
E) Loans on Dwellings For 5+ Families
F) Non-occupant Loans on < 5 Family Dwellings (A B C & D)
G) Loans On Manufactured Home Dwelling (A B C & D)
Number
Average Value
Number
Average Value
Number
Average Value
Number
Average Value
Number
Average Value
Number
Average Value
Number
Average Value
LOANS ORIGINATED
22
$155,328
115
$138,907
240
$122,947
63
$32,875
2
$65,070
17
$142,174
35
$55,404
APPLICATIONS APPROVED, NOT ACCEPTED
2
$85,525
24
$145,947
26
$108,620
11
$35,325
0
$0
7
$42,761
6
$62,903
APPLICATIONS DENIED
2
$76,225
48
$98,731
126
$115,551
30
$69,472
0
$0
4
$97,608
20
$69,441
APPLICATIONS WITHDRAWN
2
$150,595
15
$110,065
93
$129,964
6
$131,383
0
$0
0
$0
4
$81,340
FILES CLOSED FOR INCOMPLETENESS
0
$0
2
$30,675
17
$157,922
2
$20,450
0
$0
0
$0
0
$0
Aggregated Statistics For Year 2005 (Based on 2 partial tracts)
A) FHA, FSA/RHS & VA Home Purchase Loans
B) Conventional Home Purchase Loans
C) Refinancings
D) Home Improvement Loans
E) Loans on Dwellings For 5+ Families
F) Non-occupant Loans on < 5 Family Dwellings (A B C & D)
G) Loans On Manufactured Home Dwelling (A B C & D)
Number
Average Value
Number
Average Value
Number
Average Value
Number
Average Value
Number
Average Value
Number
Average Value
Number
Average Value
LOANS ORIGINATED
11
$130,144
151
$133,345
279
$120,128
67
$63,601
2
$187,780
30
$112,296
17
$64,744
APPLICATIONS APPROVED, NOT ACCEPTED
0
$0
22
$105,975
35
$112,349
6
$30,987
0
$0
6
$84,903
9
$51,231
APPLICATIONS DENIED
0
$0
33
$113,524
125
$115,657
32
$73,961
0
$0
11
$130,144
20
$74,740
APPLICATIONS WITHDRAWN
0
$0
4
$103,185
115
$118,601
11
$54,593
0
$0
0
$0
6
$90,792
FILES CLOSED FOR INCOMPLETENESS
0
$0
0
$0
9
$122,707
2
$13,945
0
$0
2
$118,990
0
$0
Aggregated Statistics For Year 2004 (Based on 2 partial tracts)
A) FHA, FSA/RHS & VA Home Purchase Loans
B) Conventional Home Purchase Loans
C) Refinancings
D) Home Improvement Loans
F) Non-occupant Loans on < 5 Family Dwellings (A B C & D)
G) Loans On Manufactured Home Dwelling (A B C & D)
Number
Average Value
Number
Average Value
Number
Average Value
Number
Average Value
Number
Average Value
Number
Average Value
LOANS ORIGINATED
19
$127,698
136
$119,905
260
$108,806
58
$75,426
24
$92,650
33
$62,537
APPLICATIONS APPROVED, NOT ACCEPTED
0
$0
20
$113,132
32
$106,672
9
$59,081
2
$32,535
9
$48,132
APPLICATIONS DENIED
0
$0
35
$78,033
108
$118,558
15
$27,021
6
$126,425
28
$72,907
APPLICATIONS WITHDRAWN
2
$102,255
15
$131,259
87
$125,806
2
$103,185
4
$174,300
4
$67,395
FILES CLOSED FOR INCOMPLETENESS
0
$0
2
$17,660
9
$147,497
2
$46,480
2
$162,680
0
$0
Aggregated Statistics For Year 2003 (Based on 2 partial tracts)
A) FHA, FSA/RHS & VA Home Purchase Loans
B) Conventional Home Purchase Loans
C) Refinancings
D) Home Improvement Loans
E) Loans on Dwellings For 5+ Families
F) Non-occupant Loans on < 5 Family Dwellings (A B C & D)
Number
Average Value
Number
Average Value
Number
Average Value
Number
Average Value
Number
Average Value
Number
Average Value
LOANS ORIGINATED
11
$115,608
80
$96,074
470
$96,109
26
$25,314
2
$220,315
15
$56,520
APPLICATIONS APPROVED, NOT ACCEPTED
0
$0
11
$79,438
50
$103,148
4
$24,635
0
$0
4
$83,200
APPLICATIONS DENIED
2
$109,695
13
$93,246
134
$98,343
15
$56,767
0
$0
6
$75,607
APPLICATIONS WITHDRAWN
0
$0
7
$178,483
74
$105,673
6
$25,100
2
$97,610
2
$204,510
FILES CLOSED FOR INCOMPLETENESS
0
$0
0
$0
6
$54,227
0
$0
0
$0
0
$0
Aggregated Statistics For Year 2002 (Based on 2 partial tracts)
A) FHA, FSA/RHS & VA Home Purchase Loans
B) Conventional Home Purchase Loans
C) Refinancings
D) Home Improvement Loans
F) Non-occupant Loans on < 5 Family Dwellings (A B C & D)
Number
Average Value
Number
Average Value
Number
Average Value
Number
Average Value
Number
Average Value
LOANS ORIGINATED
28
$105,178
125
$101,304
305
$94,966
41
$29,067
24
$99,080
APPLICATIONS APPROVED, NOT ACCEPTED
0
$0
17
$95,038
37
$84,719
2
$21,380
2
$106,905
APPLICATIONS DENIED
4
$67,860
19
$63,311
112
$100,978
15
$19,336
0
$0
APPLICATIONS WITHDRAWN
0
$0
2
$323,500
52
$104,866
13
$39,329
0
$0
FILES CLOSED FOR INCOMPLETENESS
0
$0
4
$85,988
2
$44,620
0
$0
0
$0
Aggregated Statistics For Year 2001 (Based on 2 partial tracts)
A) FHA, FSA/RHS & VA Home Purchase Loans
B) Conventional Home Purchase Loans
C) Refinancings
D) Home Improvement Loans
F) Non-occupant Loans on < 5 Family Dwellings (A B C & D)
Number
Average Value
Number
Average Value
Number
Average Value
Number
Average Value
Number
Average Value
LOANS ORIGINATED
22
$90,340
95
$97,109
225
$79,309
26
$13,372
11
$33,465
APPLICATIONS APPROVED, NOT ACCEPTED
0
$0
11
$102,425
15
$81,185
7
$17,530
2
$132,005
APPLICATIONS DENIED
2
$74,370
35
$70,065
89
$76,645
22
$20,113
0
$0
APPLICATIONS WITHDRAWN
2
$121,780
11
$127,778
69
$101,124
4
$39,042
2
$25,100
FILES CLOSED FOR INCOMPLETENESS
0
$0
0
$0
9
$110,932
2
$18,590
0
$0
Aggregated Statistics For Year 2000 (Based on 2 partial tracts)
A) FHA, FSA/RHS & VA Home Purchase Loans
B) Conventional Home Purchase Loans
C) Refinancings
D) Home Improvement Loans
F) Non-occupant Loans on < 5 Family Dwellings (A B C & D)
Number
Average Value
Number
Average Value
Number
Average Value
Number
Average Value
Number
Average Value
LOANS ORIGINATED
26
$87,740
74
$76,478
97
$48,128
26
$26,243
11
$51,044
APPLICATIONS APPROVED, NOT ACCEPTED
4
$78,550
9
$61,767
15
$66,931
11
$17,071
6
$46,790
APPLICATIONS DENIED
4
$59,495
33
$54,029
63
$51,261
19
$32,976
0
$0
APPLICATIONS WITHDRAWN
0
$0
0
$0
32
$74,194
4
$9,295
0
$0
FILES CLOSED FOR INCOMPLETENESS
0
$0
2
$65,070
13
$85,094
0
$0
0
$0
Aggregated Statistics For Year 1999 (Based on 1 partial tract)
A) FHA, FSA/RHS & VA Home Purchase Loans
B) Conventional Home Purchase Loans
C) Refinancings
D) Home Improvement Loans
F) Non-occupant Loans on < 5 Family Dwellings (A B C & D)
Detailed PMIC statistics for the following Tracts:0460.00
2003 - 2018 National Fire Incident Reporting System (NFIRS) incidents
According to the data from the years 2003 - 2018 the average number of fire incidents per year is 15. The highest number of reported fire incidents - 71 took place in 2018, and the least - 0 in 2005. The data has a growing trend.
When looking into fire subcategories, the most incidents belonged to: Structure Fires (64.4%), and Outside Fires (20.9%).
Fire incident types reported to NFIRS in Zip Code 04236


 Nearest zip codes: 04240, 04263, 04280, 04282, 04265, 04259.
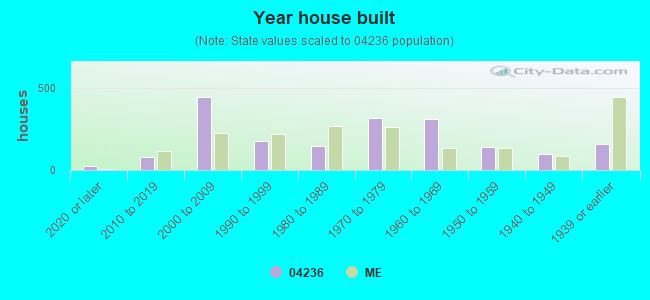


 According to the data from the years 2003 - 2018 the average number of fire incidents per year is 15. The highest number of reported fire incidents - 71 took place in 2018, and the least - 0 in 2005. The data has a growing trend.
 When looking into fire subcategories, the most incidents belonged to: Structure Fires (64.4%), and Outside Fires (20.9%).