Estimated zip code population in 2022: 8,536
Zip code population in 2010: 8,212
Zip code population in 2000: 8,793
Houses and condos: 6,484
Renter-occupied apartments: 1,407
% of renters here:
28%State:
26%
March 2022 cost of living index in zip code 04064: 111.8
(more than average, U.S. average is 100)
Land area: 6.8
sq. mi.
Water area: 0.7
sq. mi.
Population density: 1,262 people per square mile (low).
OSM Map
Google Map
MSN Map
OSM Map
General Map
Google Map
MSN Map
OSM Map
Google Map
MSN Map
OSM Map
Google Map
MSN Map
Please wait while loading the map...
Real estate property taxes paid for housing units in 2022:
This zip code:
0.9% ($3,197)Maine:
1.0% ($2,785)
Median real estate property taxes paid for housing units with mortgages in 2022: $3,121 (0.9%)
Median real estate property taxes paid for housing units with no mortgage in 2022: $3,334 (0.9%)
Profiles of local businesses
Business Search - 14 Million verified businesses
Males: 4,202 Females: 4,333
For population 25 years and over in 04064:
High school or higher: 96.7%Bachelor's degree or higher: 39.6%Graduate or professional degree: 15.6%Unemployed: 4.9%Mean travel time to work (commute): 24.7 minutes
For population 15 years and over in 04064:
Never married: 32.4%Now married: 40.4%Separated: 1.1%Widowed: 6.2%Divorced: 19.8%
Zip code 04064 compared to state average:
Black race population percentage significantly below state average. Median age significantly above state average. Foreign-born population percentage above state average. 7,910 92.7% White 298 3.5% Two or more races 170 2.0% Hispanic or Latino 84 1.0% American Indian 70 0.8% Asian 2 0.02% Black
Data:
Median household income ($)
Median household income (% change since 2000)
Household income diversity
Ratio of average income to average house value (%)
Ratio of average income to average rent
Median household income ($) - White
Median household income ($) - Black or African American
Median household income ($) - Asian
Median household income ($) - Hispanic or Latino
Median household income ($) - American Indian and Alaska Native
Median household income ($) - Multirace
Median household income ($) - Other Race
Median household income for houses/condos with a mortgage ($)
Median household income for apartments without a mortgage ($)
Races - White alone (%)
Races - White alone (% change since 2000)
Races - Black alone (%)
Races - Black alone (% change since 2000)
Races - American Indian alone (%)
Races - American Indian alone (% change since 2000)
Races - Asian alone (%)
Races - Asian alone (% change since 2000)
Races - Hispanic (%)
Races - Hispanic (% change since 2000)
Races - Native Hawaiian and Other Pacific Islander alone (%)
Races - Native Hawaiian and Other Pacific Islander alone (% change since 2000)
Races - Two or more races (%)
Races - Two or more races (% change since 2000)
Races - Other race alone (%)
Races - Other race alone (% change since 2000)
Racial diversity
Unemployment (%)
Unemployment (% change since 2000)
Unemployment (%) - White
Unemployment (%) - Black or African American
Unemployment (%) - Asian
Unemployment (%) - Hispanic or Latino
Unemployment (%) - American Indian and Alaska Native
Unemployment (%) - Multirace
Unemployment (%) - Other Race
Population density (people per square mile)
Population - Males (%)
Population - Females (%)
Population - Males (%) - White
Population - Males (%) - Black or African American
Population - Males (%) - Asian
Population - Males (%) - Hispanic or Latino
Population - Males (%) - American Indian and Alaska Native
Population - Males (%) - Multirace
Population - Males (%) - Other Race
Population - Females (%) - White
Population - Females (%) - Black or African American
Population - Females (%) - Asian
Population - Females (%) - Hispanic or Latino
Population - Females (%) - American Indian and Alaska Native
Population - Females (%) - Multirace
Population - Females (%) - Other Race
Coronavirus confirmed cases (May 09, 2024)
Deaths caused by coronavirus (May 09, 2024)
Coronavirus confirmed cases (per 100k population) (May 09, 2024)
Deaths caused by coronavirus (per 100k population) (May 09, 2024)
Daily increase in number of cases (May 09, 2024)
Weekly increase in number of cases (May 09, 2024)
Cases doubled (in days) (May 09, 2024)
Hospitalized patients (Apr 18, 2022)
Negative test results (Apr 18, 2022)
Total test results (Apr 18, 2022)
COVID Vaccine doses distributed (per 100k population) (Sep 19, 2023)
COVID Vaccine doses administered (per 100k population) (Sep 19, 2023)
COVID Vaccine doses distributed (Sep 19, 2023)
COVID Vaccine doses administered (Sep 19, 2023)
Likely homosexual households (%)
Likely homosexual households (% change since 2000)
Likely homosexual households - Lesbian couples (%)
Likely homosexual households - Lesbian couples (% change since 2000)
Likely homosexual households - Gay men (%)
Likely homosexual households - Gay men (% change since 2000)
Cost of living index
Median gross rent ($)
Median contract rent ($)
Median monthly housing costs ($)
Median house or condo value ($)
Median house or condo value ($ change since 2000)
Mean house or condo value by units in structure - 1, detached ($)
Mean house or condo value by units in structure - 1, attached ($)
Mean house or condo value by units in structure - 2 ($)
Mean house or condo value by units in structure by units in structure - 3 or 4 ($)
Mean house or condo value by units in structure - 5 or more ($)
Mean house or condo value by units in structure - Boat, RV, van, etc. ($)
Mean house or condo value by units in structure - Mobile home ($)
Median house or condo value ($) - White
Median house or condo value ($) - Black or African American
Median house or condo value ($) - Asian
Median house or condo value ($) - Hispanic or Latino
Median house or condo value ($) - American Indian and Alaska Native
Median house or condo value ($) - Multirace
Median house or condo value ($) - Other Race
Median resident age
Resident age diversity
Median resident age - Males
Median resident age - Females
Median resident age - White
Median resident age - Black or African American
Median resident age - Asian
Median resident age - Hispanic or Latino
Median resident age - American Indian and Alaska Native
Median resident age - Multirace
Median resident age - Other Race
Median resident age - Males - White
Median resident age - Males - Black or African American
Median resident age - Males - Asian
Median resident age - Males - Hispanic or Latino
Median resident age - Males - American Indian and Alaska Native
Median resident age - Males - Multirace
Median resident age - Males - Other Race
Median resident age - Females - White
Median resident age - Females - Black or African American
Median resident age - Females - Asian
Median resident age - Females - Hispanic or Latino
Median resident age - Females - American Indian and Alaska Native
Median resident age - Females - Multirace
Median resident age - Females - Other Race
Commute - mean travel time to work (minutes)
Travel time to work - Less than 5 minutes (%)
Travel time to work - Less than 5 minutes (% change since 2000)
Travel time to work - 5 to 9 minutes (%)
Travel time to work - 5 to 9 minutes (% change since 2000)
Travel time to work - 10 to 19 minutes (%)
Travel time to work - 10 to 19 minutes (% change since 2000)
Travel time to work - 20 to 29 minutes (%)
Travel time to work - 20 to 29 minutes (% change since 2000)
Travel time to work - 30 to 39 minutes (%)
Travel time to work - 30 to 39 minutes (% change since 2000)
Travel time to work - 40 to 59 minutes (%)
Travel time to work - 40 to 59 minutes (% change since 2000)
Travel time to work - 60 to 89 minutes (%)
Travel time to work - 60 to 89 minutes (% change since 2000)
Travel time to work - 90 or more minutes (%)
Travel time to work - 90 or more minutes (% change since 2000)
Marital status - Never married (%)
Marital status - Now married (%)
Marital status - Separated (%)
Marital status - Widowed (%)
Marital status - Divorced (%)
Median family income ($)
Median family income (% change since 2000)
Median non-family income ($)
Median non-family income (% change since 2000)
Median per capita income ($)
Median per capita income (% change since 2000)
Median family income ($) - White
Median family income ($) - Black or African American
Median family income ($) - Asian
Median family income ($) - Hispanic or Latino
Median family income ($) - American Indian and Alaska Native
Median family income ($) - Multirace
Median family income ($) - Other Race
Median year house/condo built
Median year apartment built
Year house built - Built 2005 or later (%)
Year house built - Built 2000 to 2004 (%)
Year house built - Built 1990 to 1999 (%)
Year house built - Built 1980 to 1989 (%)
Year house built - Built 1970 to 1979 (%)
Year house built - Built 1960 to 1969 (%)
Year house built - Built 1950 to 1959 (%)
Year house built - Built 1940 to 1949 (%)
Year house built - Built 1939 or earlier (%)
Average household size
Household density (households per square mile)
Average household size - White
Average household size - Black or African American
Average household size - Asian
Average household size - Hispanic or Latino
Average household size - American Indian and Alaska Native
Average household size - Multirace
Average household size - Other Race
Occupied housing units (%)
Vacant housing units (%)
Owner occupied housing units (%)
Renter occupied housing units (%)
Vacancy status - For rent (%)
Vacancy status - For sale only (%)
Vacancy status - Rented or sold, not occupied (%)
Vacancy status - For seasonal, recreational, or occasional use (%)
Vacancy status - For migrant workers (%)
Vacancy status - Other vacant (%)
Residents with income below the poverty level (%)
Residents with income below 50% of the poverty level (%)
Children below poverty level (%)
Poor families by family type - Married-couple family (%)
Poor families by family type - Male, no wife present (%)
Poor families by family type - Female, no husband present (%)
Poverty status for native-born residents (%)
Poverty status for foreign-born residents (%)
Poverty among high school graduates not in families (%)
Poverty among people who did not graduate high school not in families (%)
Residents with income below the poverty level (%) - White
Residents with income below the poverty level (%) - Black or African American
Residents with income below the poverty level (%) - Asian
Residents with income below the poverty level (%) - Hispanic or Latino
Residents with income below the poverty level (%) - American Indian and Alaska Native
Residents with income below the poverty level (%) - Multirace
Residents with income below the poverty level (%) - Other Race
Air pollution - Air Quality Index (AQI)
Air pollution - CO
Air pollution - NO2
Air pollution - SO2
Air pollution - Ozone
Air pollution - PM10
Air pollution - PM25
Air pollution - Pb
Crime - Murders per 100,000 population
Crime - Rapes per 100,000 population
Crime - Robberies per 100,000 population
Crime - Assaults per 100,000 population
Crime - Burglaries per 100,000 population
Crime - Thefts per 100,000 population
Crime - Auto thefts per 100,000 population
Crime - Arson per 100,000 population
Crime - City-data.com crime index
Crime - Violent crime index
Crime - Property crime index
Crime - Murders per 100,000 population (5 year average)
Crime - Rapes per 100,000 population (5 year average)
Crime - Robberies per 100,000 population (5 year average)
Crime - Assaults per 100,000 population (5 year average)
Crime - Burglaries per 100,000 population (5 year average)
Crime - Thefts per 100,000 population (5 year average)
Crime - Auto thefts per 100,000 population (5 year average)
Crime - Arson per 100,000 population (5 year average)
Crime - City-data.com crime index (5 year average)
Crime - Violent crime index (5 year average)
Crime - Property crime index (5 year average)
1996 Presidential Elections Results (%) - Democratic Party (Clinton)
1996 Presidential Elections Results (%) - Republican Party (Dole)
1996 Presidential Elections Results (%) - Other
2000 Presidential Elections Results (%) - Democratic Party (Gore)
2000 Presidential Elections Results (%) - Republican Party (Bush)
2000 Presidential Elections Results (%) - Other
2004 Presidential Elections Results (%) - Democratic Party (Kerry)
2004 Presidential Elections Results (%) - Republican Party (Bush)
2004 Presidential Elections Results (%) - Other
2008 Presidential Elections Results (%) - Democratic Party (Obama)
2008 Presidential Elections Results (%) - Republican Party (McCain)
2008 Presidential Elections Results (%) - Other
2012 Presidential Elections Results (%) - Democratic Party (Obama)
2012 Presidential Elections Results (%) - Republican Party (Romney)
2012 Presidential Elections Results (%) - Other
2016 Presidential Elections Results (%) - Democratic Party (Clinton)
2016 Presidential Elections Results (%) - Republican Party (Trump)
2016 Presidential Elections Results (%) - Other
2020 Presidential Elections Results (%) - Democratic Party (Biden)
2020 Presidential Elections Results (%) - Republican Party (Trump)
2020 Presidential Elections Results (%) - Other
Ancestries Reported - Arab (%)
Ancestries Reported - Czech (%)
Ancestries Reported - Danish (%)
Ancestries Reported - Dutch (%)
Ancestries Reported - English (%)
Ancestries Reported - French (%)
Ancestries Reported - French Canadian (%)
Ancestries Reported - German (%)
Ancestries Reported - Greek (%)
Ancestries Reported - Hungarian (%)
Ancestries Reported - Irish (%)
Ancestries Reported - Italian (%)
Ancestries Reported - Lithuanian (%)
Ancestries Reported - Norwegian (%)
Ancestries Reported - Polish (%)
Ancestries Reported - Portuguese (%)
Ancestries Reported - Russian (%)
Ancestries Reported - Scotch-Irish (%)
Ancestries Reported - Scottish (%)
Ancestries Reported - Slovak (%)
Ancestries Reported - Subsaharan African (%)
Ancestries Reported - Swedish (%)
Ancestries Reported - Swiss (%)
Ancestries Reported - Ukrainian (%)
Ancestries Reported - United States (%)
Ancestries Reported - Welsh (%)
Ancestries Reported - West Indian (%)
Ancestries Reported - Other (%)
Educational Attainment - No schooling completed (%)
Educational Attainment - Less than high school (%)
Educational Attainment - High school or equivalent (%)
Educational Attainment - Less than 1 year of college (%)
Educational Attainment - 1 or more years of college (%)
Educational Attainment - Associate degree (%)
Educational Attainment - Bachelor's degree (%)
Educational Attainment - Master's degree (%)
Educational Attainment - Professional school degree (%)
Educational Attainment - Doctorate degree (%)
School Enrollment - Nursery, preschool (%)
School Enrollment - Kindergarten (%)
School Enrollment - Grade 1 to 4 (%)
School Enrollment - Grade 5 to 8 (%)
School Enrollment - Grade 9 to 12 (%)
School Enrollment - College undergrad (%)
School Enrollment - Graduate or professional (%)
School Enrollment - Not enrolled in school (%)
School enrollment - Public schools (%)
School enrollment - Private schools (%)
School enrollment - Not enrolled (%)
Median number of rooms in houses and condos
Median number of rooms in apartments
Housing units lacking complete plumbing facilities (%)
Housing units lacking complete kitchen facilities (%)
Density of houses
Urban houses (%)
Rural houses (%)
Households with people 60 years and over (%)
Households with people 65 years and over (%)
Households with people 75 years and over (%)
Households with one or more nonrelatives (%)
Households with no nonrelatives (%)
Population in households (%)
Family households (%)
Nonfamily households (%)
Population in families (%)
Family households with own children (%)
Median number of bedrooms in owner occupied houses
Mean number of bedrooms in owner occupied houses
Median number of bedrooms in renter occupied houses
Mean number of bedrooms in renter occupied houses
Median number of vehichles in owner occupied houses
Mean number of vehichles in owner occupied houses
Median number of vehichles in renter occupied houses
Mean number of vehichles in renter occupied houses
Mortgage status - with mortgage (%)
Mortgage status - with second mortgage (%)
Mortgage status - with home equity loan (%)
Mortgage status - with both second mortgage and home equity loan (%)
Mortgage status - without a mortgage (%)
Average family size
Average family size - White
Average family size - Black or African American
Average family size - Asian
Average family size - Hispanic or Latino
Average family size - American Indian and Alaska Native
Average family size - Multirace
Average family size - Other Race
Geographical mobility - Same house 1 year ago (%)
Geographical mobility - Moved within same county (%)
Geographical mobility - Moved from different county within same state (%)
Geographical mobility - Moved from different state (%)
Geographical mobility - Moved from abroad (%)
Place of birth - Born in state of residence (%)
Place of birth - Born in other state (%)
Place of birth - Native, outside of US (%)
Place of birth - Foreign born (%)
Housing units in structures - 1, detached (%)
Housing units in structures - 1, attached (%)
Housing units in structures - 2 (%)
Housing units in structures - 3 or 4 (%)
Housing units in structures - 5 to 9 (%)
Housing units in structures - 10 to 19 (%)
Housing units in structures - 20 to 49 (%)
Housing units in structures - 50 or more (%)
Housing units in structures - Mobile home (%)
Housing units in structures - Boat, RV, van, etc. (%)
House/condo owner moved in on average (years ago)
Renter moved in on average (years ago)
Year householder moved into unit - Moved in 1999 to March 2000 (%)
Year householder moved into unit - Moved in 1995 to 1998 (%)
Year householder moved into unit - Moved in 1990 to 1994 (%)
Year householder moved into unit - Moved in 1980 to 1989 (%)
Year householder moved into unit - Moved in 1970 to 1979 (%)
Year householder moved into unit - Moved in 1969 or earlier (%)
Means of transportation to work - Drove car alone (%)
Means of transportation to work - Carpooled (%)
Means of transportation to work - Public transportation (%)
Means of transportation to work - Bus or trolley bus (%)
Means of transportation to work - Streetcar or trolley car (%)
Means of transportation to work - Subway or elevated (%)
Means of transportation to work - Railroad (%)
Means of transportation to work - Ferryboat (%)
Means of transportation to work - Taxicab (%)
Means of transportation to work - Motorcycle (%)
Means of transportation to work - Bicycle (%)
Means of transportation to work - Walked (%)
Means of transportation to work - Other means (%)
Working at home (%)
Industry diversity
Most Common Industries - Agriculture, forestry, fishing and hunting, and mining (%)
Most Common Industries - Agriculture, forestry, fishing and hunting (%)
Most Common Industries - Mining, quarrying, and oil and gas extraction (%)
Most Common Industries - Construction (%)
Most Common Industries - Manufacturing (%)
Most Common Industries - Wholesale trade (%)
Most Common Industries - Retail trade (%)
Most Common Industries - Transportation and warehousing, and utilities (%)
Most Common Industries - Transportation and warehousing (%)
Most Common Industries - Utilities (%)
Most Common Industries - Information (%)
Most Common Industries - Finance and insurance, and real estate and rental and leasing (%)
Most Common Industries - Finance and insurance (%)
Most Common Industries - Real estate and rental and leasing (%)
Most Common Industries - Professional, scientific, and management, and administrative and waste management services (%)
Most Common Industries - Professional, scientific, and technical services (%)
Most Common Industries - Management of companies and enterprises (%)
Most Common Industries - Administrative and support and waste management services (%)
Most Common Industries - Educational services, and health care and social assistance (%)
Most Common Industries - Educational services (%)
Most Common Industries - Health care and social assistance (%)
Most Common Industries - Arts, entertainment, and recreation, and accommodation and food services (%)
Most Common Industries - Arts, entertainment, and recreation (%)
Most Common Industries - Accommodation and food services (%)
Most Common Industries - Other services, except public administration (%)
Most Common Industries - Public administration (%)
Occupation diversity
Most Common Occupations - Management, business, science, and arts occupations (%)
Most Common Occupations - Management, business, and financial occupations (%)
Most Common Occupations - Management occupations (%)
Most Common Occupations - Business and financial operations occupations (%)
Most Common Occupations - Computer, engineering, and science occupations (%)
Most Common Occupations - Computer and mathematical occupations (%)
Most Common Occupations - Architecture and engineering occupations (%)
Most Common Occupations - Life, physical, and social science occupations (%)
Most Common Occupations - Education, legal, community service, arts, and media occupations (%)
Most Common Occupations - Community and social service occupations (%)
Most Common Occupations - Legal occupations (%)
Most Common Occupations - Education, training, and library occupations (%)
Most Common Occupations - Arts, design, entertainment, sports, and media occupations (%)
Most Common Occupations - Healthcare practitioners and technical occupations (%)
Most Common Occupations - Health diagnosing and treating practitioners and other technical occupations (%)
Most Common Occupations - Health technologists and technicians (%)
Most Common Occupations - Service occupations (%)
Most Common Occupations - Healthcare support occupations (%)
Most Common Occupations - Protective service occupations (%)
Most Common Occupations - Fire fighting and prevention, and other protective service workers including supervisors (%)
Most Common Occupations - Law enforcement workers including supervisors (%)
Most Common Occupations - Food preparation and serving related occupations (%)
Most Common Occupations - Building and grounds cleaning and maintenance occupations (%)
Most Common Occupations - Personal care and service occupations (%)
Most Common Occupations - Sales and office occupations (%)
Most Common Occupations - Sales and related occupations (%)
Most Common Occupations - Office and administrative support occupations (%)
Most Common Occupations - Natural resources, construction, and maintenance occupations (%)
Most Common Occupations - Farming, fishing, and forestry occupations (%)
Most Common Occupations - Construction and extraction occupations (%)
Most Common Occupations - Installation, maintenance, and repair occupations (%)
Most Common Occupations - Production, transportation, and material moving occupations (%)
Most Common Occupations - Production occupations (%)
Most Common Occupations - Transportation occupations (%)
Most Common Occupations - Material moving occupations (%)
People in Group quarters - Institutionalized population (%)
People in Group quarters - Correctional institutions (%)
People in Group quarters - Federal prisons and detention centers (%)
People in Group quarters - Halfway houses (%)
People in Group quarters - Local jails and other confinement facilities (including police lockups) (%)
People in Group quarters - Military disciplinary barracks (%)
People in Group quarters - State prisons (%)
People in Group quarters - Other types of correctional institutions (%)
People in Group quarters - Nursing homes (%)
People in Group quarters - Hospitals/wards, hospices, and schools for the handicapped (%)
People in Group quarters - Hospitals/wards and hospices for chronically ill (%)
People in Group quarters - Hospices or homes for chronically ill (%)
People in Group quarters - Military hospitals or wards for chronically ill (%)
People in Group quarters - Other hospitals or wards for chronically ill (%)
People in Group quarters - Hospitals or wards for drug/alcohol abuse (%)
People in Group quarters - Mental (Psychiatric) hospitals or wards (%)
People in Group quarters - Schools, hospitals, or wards for the mentally retarded (%)
People in Group quarters - Schools, hospitals, or wards for the physically handicapped (%)
People in Group quarters - Institutions for the deaf (%)
People in Group quarters - Institutions for the blind (%)
People in Group quarters - Orthopedic wards and institutions for the physically handicapped (%)
People in Group quarters - Wards in general hospitals for patients who have no usual home elsewhere (%)
People in Group quarters - Wards in military hospitals for patients who have no usual home elsewhere (%)
People in Group quarters - Juvenile institutions (%)
People in Group quarters - Long-term care (%)
People in Group quarters - Homes for abused, dependent, and neglected children (%)
People in Group quarters - Residential treatment centers for emotionally disturbed children (%)
People in Group quarters - Training schools for juvenile delinquents (%)
People in Group quarters - Short-term care, detention or diagnostic centers for delinquent children (%)
People in Group quarters - Type of juvenile institution unknown (%)
People in Group quarters - Noninstitutionalized population (%)
People in Group quarters - College dormitories (includes college quarters off campus) (%)
People in Group quarters - Military quarters (%)
People in Group quarters - On base (%)
People in Group quarters - Barracks, unaccompanied personnel housing (UPH), (Enlisted/Officer), ;and similar group living quarters for military personnel (%)
People in Group quarters - Transient quarters for temporary residents (%)
People in Group quarters - Military ships (%)
People in Group quarters - Group homes (%)
People in Group quarters - Homes or halfway houses for drug/alcohol abuse (%)
People in Group quarters - Homes for the mentally ill (%)
People in Group quarters - Homes for the mentally retarded (%)
People in Group quarters - Homes for the physically handicapped (%)
People in Group quarters - Other group homes (%)
People in Group quarters - Religious group quarters (%)
People in Group quarters - Dormitories (%)
People in Group quarters - Agriculture workers' dormitories on farms (%)
People in Group quarters - Job Corps and vocational training facilities (%)
People in Group quarters - Other workers' dormitories (%)
People in Group quarters - Crews of maritime vessels (%)
People in Group quarters - Other nonhousehold living situations (%)
People in Group quarters - Other noninstitutional group quarters (%)
Residents speaking English at home (%)
Residents speaking English at home - Born in the United States (%)
Residents speaking English at home - Native, born elsewhere (%)
Residents speaking English at home - Foreign born (%)
Residents speaking Spanish at home (%)
Residents speaking Spanish at home - Born in the United States (%)
Residents speaking Spanish at home - Native, born elsewhere (%)
Residents speaking Spanish at home - Foreign born (%)
Residents speaking other language at home (%)
Residents speaking other language at home - Born in the United States (%)
Residents speaking other language at home - Native, born elsewhere (%)
Residents speaking other language at home - Foreign born (%)
Class of Workers - Employee of private company (%)
Class of Workers - Self-employed in own incorporated business (%)
Class of Workers - Private not-for-profit wage and salary workers (%)
Class of Workers - Local government workers (%)
Class of Workers - State government workers (%)
Class of Workers - Federal government workers (%)
Class of Workers - Self-employed workers in own not incorporated business and Unpaid family workers (%)
House heating fuel used in houses and condos - Utility gas (%)
House heating fuel used in houses and condos - Bottled, tank, or LP gas (%)
House heating fuel used in houses and condos - Electricity (%)
House heating fuel used in houses and condos - Fuel oil, kerosene, etc. (%)
House heating fuel used in houses and condos - Coal or coke (%)
House heating fuel used in houses and condos - Wood (%)
House heating fuel used in houses and condos - Solar energy (%)
House heating fuel used in houses and condos - Other fuel (%)
House heating fuel used in houses and condos - No fuel used (%)
House heating fuel used in apartments - Utility gas (%)
House heating fuel used in apartments - Bottled, tank, or LP gas (%)
House heating fuel used in apartments - Electricity (%)
House heating fuel used in apartments - Fuel oil, kerosene, etc. (%)
House heating fuel used in apartments - Coal or coke (%)
House heating fuel used in apartments - Wood (%)
House heating fuel used in apartments - Solar energy (%)
House heating fuel used in apartments - Other fuel (%)
House heating fuel used in apartments - No fuel used (%)
Armed forces status - In Armed Forces (%)
Armed forces status - Civilian (%)
Armed forces status - Civilian - Veteran (%)
Armed forces status - Civilian - Nonveteran (%)
Fatal accidents locations in years 2005-2021
Fatal accidents locations in 2005
Fatal accidents locations in 2006
Fatal accidents locations in 2007
Fatal accidents locations in 2008
Fatal accidents locations in 2009
Fatal accidents locations in 2010
Fatal accidents locations in 2011
Fatal accidents locations in 2012
Fatal accidents locations in 2013
Fatal accidents locations in 2014
Fatal accidents locations in 2015
Fatal accidents locations in 2016
Fatal accidents locations in 2017
Fatal accidents locations in 2018
Fatal accidents locations in 2019
Fatal accidents locations in 2020
Fatal accidents locations in 2021
Alcohol use - People drinking some alcohol every month (%)
Alcohol use - People not drinking at all (%)
Alcohol use - Average days/month drinking alcohol
Alcohol use - Average drinks/week
Alcohol use - Average days/year people drink much
Audiometry - Average condition of hearing (%)
Audiometry - People that can hear a whisper from across a quiet room (%)
Audiometry - People that can hear normal voice from across a quiet room (%)
Audiometry - Ears ringing, roaring, buzzing (%)
Audiometry - Had a job exposure to loud noise (%)
Audiometry - Had off-work exposure to loud noise (%)
Blood Pressure & Cholesterol - Has high blood pressure (%)
Blood Pressure & Cholesterol - Checking blood pressure at home (%)
Blood Pressure & Cholesterol - Frequently checking blood cholesterol (%)
Blood Pressure & Cholesterol - Has high cholesterol level (%)
Consumer Behavior - Money monthly spent on food at supermarket/grocery store
Consumer Behavior - Money monthly spent on food at other stores
Consumer Behavior - Money monthly spent on eating out
Consumer Behavior - Money monthly spent on carryout/delivered foods
Consumer Behavior - Income spent on food at supermarket/grocery store (%)
Consumer Behavior - Income spent on food at other stores (%)
Consumer Behavior - Income spent on eating out (%)
Consumer Behavior - Income spent on carryout/delivered foods (%)
Current Health Status - General health condition (%)
Current Health Status - Blood donors (%)
Current Health Status - Has blood ever tested for HIV virus (%)
Current Health Status - Left-handed people (%)
Dermatology - People using sunscreen (%)
Diabetes - Diabetics (%)
Diabetes - Had a blood test for high blood sugar (%)
Diabetes - People taking insulin (%)
Diet Behavior & Nutrition - Diet health (%)
Diet Behavior & Nutrition - Milk product consumption (# of products/month)
Diet Behavior & Nutrition - Meals not home prepared (#/week)
Diet Behavior & Nutrition - Meals from fast food or pizza place (#/week)
Diet Behavior & Nutrition - Ready-to-eat foods (#/month)
Diet Behavior & Nutrition - Frozen meals/pizza (#/month)
Drug Use - People that ever used marijuana or hashish (%)
Drug Use - Ever used hard drugs (%)
Drug Use - Ever used any form of cocaine (%)
Drug Use - Ever used heroin (%)
Drug Use - Ever used methamphetamine (%)
Health Insurance - People covered by health insurance (%)
Kidney Conditions-Urology - Avg. # of times urinating at night
Medical Conditions - People with asthma (%)
Medical Conditions - People with anemia (%)
Medical Conditions - People with psoriasis (%)
Medical Conditions - People with overweight (%)
Medical Conditions - Elderly people having difficulties in thinking or remembering (%)
Medical Conditions - People who ever received blood transfusion (%)
Medical Conditions - People having trouble seeing even with glass/contacts (%)
Medical Conditions - People with arthritis (%)
Medical Conditions - People with gout (%)
Medical Conditions - People with congestive heart failure (%)
Medical Conditions - People with coronary heart disease (%)
Medical Conditions - People with angina pectoris (%)
Medical Conditions - People who ever had heart attack (%)
Medical Conditions - People who ever had stroke (%)
Medical Conditions - People with emphysema (%)
Medical Conditions - People with thyroid problem (%)
Medical Conditions - People with chronic bronchitis (%)
Medical Conditions - People with any liver condition (%)
Medical Conditions - People who ever had cancer or malignancy (%)
Mental Health - People who have little interest in doing things (%)
Mental Health - People feeling down, depressed, or hopeless (%)
Mental Health - People who have trouble sleeping or sleeping too much (%)
Mental Health - People feeling tired or having little energy (%)
Mental Health - People with poor appetite or overeating (%)
Mental Health - People feeling bad about themself (%)
Mental Health - People who have trouble concentrating on things (%)
Mental Health - People moving or speaking slowly or too fast (%)
Mental Health - People having thoughts they would be better off dead (%)
Oral Health - Average years since last visit a dentist
Oral Health - People embarrassed because of mouth (%)
Oral Health - People with gum disease (%)
Oral Health - General health of teeth and gums (%)
Oral Health - Average days a week using dental floss/device
Oral Health - Average days a week using mouthwash for dental problem
Oral Health - Average number of teeth
Pesticide Use - Households using pesticides to control insects (%)
Pesticide Use - Households using pesticides to kill weeds (%)
Physical Activity - People doing vigorous-intensity work activities (%)
Physical Activity - People doing moderate-intensity work activities (%)
Physical Activity - People walking or bicycling (%)
Physical Activity - People doing vigorous-intensity recreational activities (%)
Physical Activity - People doing moderate-intensity recreational activities (%)
Physical Activity - Average hours a day doing sedentary activities
Physical Activity - Average hours a day watching TV or videos
Physical Activity - Average hours a day using computer
Physical Functioning - People having limitations keeping them from working (%)
Physical Functioning - People limited in amount of work they can do (%)
Physical Functioning - People that need special equipment to walk (%)
Physical Functioning - People experiencing confusion/memory problems (%)
Physical Functioning - People requiring special healthcare equipment (%)
Prescription Medications - Average number of prescription medicines taking
Preventive Aspirin Use - Adults 40+ taking low-dose aspirin (%)
Reproductive Health - Vaginal deliveries (%)
Reproductive Health - Cesarean deliveries (%)
Reproductive Health - Deliveries resulted in a live birth (%)
Reproductive Health - Pregnancies resulted in a delivery (%)
Reproductive Health - Women breastfeeding newborns (%)
Reproductive Health - Women that had a hysterectomy (%)
Reproductive Health - Women that had both ovaries removed (%)
Reproductive Health - Women that have ever taken birth control pills (%)
Reproductive Health - Women taking birth control pills (%)
Reproductive Health - Women that have ever used Depo-Provera or injectables (%)
Reproductive Health - Women that have ever used female hormones (%)
Sexual Behavior - People 18+ that ever had sex (vaginal, anal, or oral) (%)
Sexual Behavior - Males 18+ that ever had vaginal sex with a woman (%)
Sexual Behavior - Males 18+ that ever performed oral sex on a woman (%)
Sexual Behavior - Males 18+ that ever had anal sex with a woman (%)
Sexual Behavior - Males 18+ that ever had any sex with a man (%)
Sexual Behavior - Females 18+ that ever had vaginal sex with a man (%)
Sexual Behavior - Females 18+ that ever performed oral sex on a man (%)
Sexual Behavior - Females 18+ that ever had anal sex with a man (%)
Sexual Behavior - Females 18+ that ever had any kind of sex with a woman (%)
Sexual Behavior - Average age people first had sex
Sexual Behavior - Average number of female sex partners in lifetime (males 18+)
Sexual Behavior - Average number of female vaginal sex partners in lifetime (males 18+)
Sexual Behavior - Average age people first performed oral sex on a woman (18+)
Sexual Behavior - Average number of woman performed oral sex on in lifetime (18+)
Sexual Behavior - Average number of male sex partners in lifetime (males 18+)
Sexual Behavior - Average number of male anal sex partners in lifetime (males 18+)
Sexual Behavior - Average age people first performed oral sex on a man (18+)
Sexual Behavior - Average number of male oral sex partners in lifetime (18+)
Sexual Behavior - People using protection when performing oral sex (%)
Sexual Behavior - Average number of times people have vaginal or anal sex a year
Sexual Behavior - People having sex without condom (%)
Sexual Behavior - Average number of male sex partners in lifetime (females 18+)
Sexual Behavior - Average number of male vaginal sex partners in lifetime (females 18+)
Sexual Behavior - Average number of female sex partners in lifetime (females 18+)
Sexual Behavior - Circumcised males 18+ (%)
Sleep Disorders - Average hours sleeping at night
Sleep Disorders - People that has trouble sleeping (%)
Smoking-Cigarette Use - People smoking cigarettes (%)
Taste & Smell - People 40+ having problems with smell (%)
Taste & Smell - People 40+ having problems with taste (%)
Taste & Smell - People 40+ that ever had wisdom teeth removed (%)
Taste & Smell - People 40+ that ever had tonsils teeth removed (%)
Taste & Smell - People 40+ that ever had a loss of consciousness because of a head injury (%)
Taste & Smell - People 40+ that ever had a broken nose or other serious injury to face or skull (%)
Taste & Smell - People 40+ that ever had two or more sinus infections (%)
Weight - Average height (inches)
Weight - Average weight (pounds)
Weight - Average BMI
Weight - People that are obese (%)
Weight - People that ever were obese (%)
Weight - People trying to lose weight (%)
Urban population: 8,520
Rural population: 15
Estimated median house/condo value in 2022: $346,156
04064:
$346,156Maine:
$290,600
According to our research of Maine and other state lists, there were 19 registered sex offenders living in 04064 zip code as of May 09, 2024 . The ratio of all residents to sex offenders in zip code 04064 is 442 to 1.The ratio of registered sex offenders to all residents in this zip code is near the state average.
Median resident age: This zip code:
56.2 yearsMaine median age:
45.1 years
Average household size: This zip code:
1.7 peopleMaine:
2.2 people
Averages for the 2020 tax year for zip code 04064, filed in 2021:
Average Adjusted Gross Income (AGI) in 2020: $63,014 (Individual Income Tax Returns) Here:
$63,014State:
$68,227
Salary/wage: $53,419 (reported on 79.5% of returns )Here:
$53,419State:
$55,127
(% of AGI for various income ranges: 1101.0% for AGIs below $25k , 3800.2% for AGIs $25k-50k , 6411.0% for AGIs $50k-75k , 9133.3% for AGIs $75k-100k , 17857.8% for AGIs $100k-200k , 97012.5% for AGIs over 200k ) Taxable interest for individuals: $1,001 (reported on 41.0% of returns )This zip code:
$1,001Maine:
$1,162
(% of AGI for various income ranges: 30.9% for AGIs below $25k , 30.8% for AGIs $25k-50k , 34.4% for AGIs $50k-75k , 56.4% for AGIs $75k-100k , 145.8% for AGIs $100k-200k , 1497.5% for AGIs over 200k ) Ordinary dividends: $4,023 (reported on 19.0% of returns )(% of AGI for various income ranges: 35.9% for AGIs below $25k , 36.8% for AGIs $25k-50k , 77.9% for AGIs $50k-75k , 190.9% for AGIs $75k-100k , 321.4% for AGIs $100k-200k , 2537.5% for AGIs over 200k ) Net capital gain/loss in AGI: +$16,731 (reported on 17.5% of returns )Here:
+$16,731State:
+$22,201
(% of AGI for various income ranges: 13.5% for AGIs below $25k , 31.8% for AGIs $25k-50k , 130.0% for AGIs $50k-75k , 327.6% for AGIs $75k-100k , 691.1% for AGIs $100k-200k , 26740.0% for AGIs over 200k ) Profit/loss from business: +$11,539 (reported on 13.3% of returns )Here:
+$11,539State:
+$15,095
(% of AGI for various income ranges: 96.3% for AGIs below $25k , 129.5% for AGIs $25k-50k , 135.5% for AGIs $50k-75k , 211.5% for AGIs $75k-100k , 592.5% for AGIs $100k-200k , 5247.5% for AGIs over 200k ) Taxable individual retirement arrangement distribution: $18,116 (reported on 12.6% of returns )04064:
$18,116Maine:
$18,314
(% of AGI for various income ranges: 109.1% for AGIs below $25k , 140.6% for AGIs $25k-50k , 279.0% for AGIs $50k-75k , 608.5% for AGIs $75k-100k , 1226.7% for AGIs $100k-200k , 3262.5% for AGIs over 200k ) Total itemized deductions: $24,726 (reported on 7.9% of returns )Here:
$24,726State:
$31,197
(% of AGI for various income ranges: 40.6% for AGIs below $25k , 90.5% for AGIs $25k-50k , 327.1% for AGIs $50k-75k , 614.5% for AGIs $75k-100k , 841.4% for AGIs $100k-200k , 4720.0% for AGIs over 200k ) Charity contributions: $4,347 (reported on 6.0% of returns )(% of AGI for various income ranges: 11.8% for AGIs $25k-50k , 29.0% for AGIs $50k-75k , 44.2% for AGIs $75k-100k , 147.8% for AGIs $100k-200k , 1010.0% for AGIs over 200k ) Taxes paid: $7,869 (reported on 7.9% of returns )(% of AGI for various income ranges: 9.6% for AGIs below $25k , 25.2% for AGIs $25k-50k , 107.4% for AGIs $50k-75k , 204.5% for AGIs $75k-100k , 308.6% for AGIs $100k-200k , 1192.5% for AGIs over 200k ) Earned income credit: $1,529 (reported on 9.2% of returns )(% of AGI for various income ranges: 45.0% for AGIs below $25k , 25.3% for AGIs $25k-50k ) Percentage of individuals using paid preparers for their 2020 taxes: 90.6%(% for various income ranges: 88.5% for AGIs below $25k , 91.3% for AGIs $25k-50k , 91.0% for AGIs $50k-75k , 92.5% for AGIs $75k-100k , 92.6% for AGIs $100k-200k , 87.5% for AGIs over 200k )
Averages for the 2012 tax year for zip code 04064, filed in 2013:
Average Adjusted Gross Income (AGI) in 2012: $47,265 (Individual Income Tax Returns) Here:
$47,265State:
$52,375
Salary/wage: $38,972 (reported on 83.9% of returns )Here:
$38,972State:
$43,415
(% of AGI for various income ranges: 72.0% for AGIs below $25k , 79.5% for AGIs $25k-50k , 77.0% for AGIs $50k-75k , 73.9% for AGIs $75k-100k , 73.4% for AGIs $100k-200k , 30.8% for AGIs over 200k ) Taxable interest for individuals: $1,333 (reported on 34.9% of returns )This zip code:
$1,333Maine:
$1,221
(% of AGI for various income ranges: 1.4% for AGIs below $25k , 0.6% for AGIs $25k-50k , 0.8% for AGIs $50k-75k , 0.8% for AGIs $75k-100k , 0.6% for AGIs $100k-200k , 2.1% for AGIs over 200k ) Ordinary dividends: $2,970 (reported on 17.8% of returns )(% of AGI for various income ranges: 1.7% for AGIs below $25k , 0.8% for AGIs $25k-50k , 1.3% for AGIs $50k-75k , 0.8% for AGIs $75k-100k , 1.0% for AGIs $100k-200k , 1.3% for AGIs over 200k ) Net capital gain/loss in AGI: +$26,322 (reported on 12.6% of returns )Here:
+$26,322State:
+$11,897
(% of AGI for various income ranges: 0.2% for AGIs $50k-75k , 0.2% for AGIs $75k-100k , 1.8% for AGIs $100k-200k , 46.0% for AGIs over 200k ) Profit/loss from business: +$12,258 (reported on 14.3% of returns )Here:
+$12,258State:
+$12,144
(% of AGI for various income ranges: 6.9% for AGIs below $25k , 2.5% for AGIs $25k-50k , 1.9% for AGIs $50k-75k , 2.5% for AGIs $75k-100k , 4.2% for AGIs $100k-200k , 6.2% for AGIs over 200k ) Taxable individual retirement arrangement distribution: $11,613 (reported on 11.3% of returns )04064:
$11,613Maine:
$13,385
(% of AGI for various income ranges: 4.4% for AGIs below $25k , 2.5% for AGIs $25k-50k , 2.4% for AGIs $50k-75k , 3.2% for AGIs $75k-100k , 4.4% for AGIs $100k-200k ) Total itemized deductions: $18,550 (21% of AGI, reported on 31.3% of returns )Here:
$18,550State:
$21,859
Here:
21.4% of AGIState:
20.9% of AGI
(% of AGI for various income ranges: 8.9% for AGIs below $25k , 10.7% for AGIs $25k-50k , 12.5% for AGIs $50k-75k , 13.7% for AGIs $75k-100k , 15.7% for AGIs $100k-200k , 10.7% for AGIs over 200k ) Charity contributions: $1,737 (reported on 24.4% of returns )(% of AGI for various income ranges: 0.5% for AGIs below $25k , 0.7% for AGIs $25k-50k , 0.9% for AGIs $50k-75k , 1.1% for AGIs $75k-100k , 1.3% for AGIs $100k-200k , 0.8% for AGIs over 200k ) Taxes paid: $7,979 (reported on 31.3% of returns )(% of AGI for various income ranges: 2.3% for AGIs below $25k , 3.4% for AGIs $25k-50k , 4.8% for AGIs $50k-75k , 6.2% for AGIs $75k-100k , 7.8% for AGIs $100k-200k , 6.5% for AGIs over 200k ) Earned income credit: $1,622 (reported on 14.8% of returns )(% of AGI for various income ranges: 3.8% for AGIs below $25k , 0.5% for AGIs $25k-50k ) Percentage of individuals using paid preparers for their 2012 taxes: 45.0%(% for various income ranges: 38.6% for AGIs below $25k , 41.4% for AGIs $25k-50k , 49.3% for AGIs $50k-75k , 58.8% for AGIs $75k-100k , 61.8% for AGIs $100k-200k , 85.7% for AGIs over 200k )
Averages for the 2004 tax year for zip code 04064, filed in 2005:
Average Adjusted Gross Income (AGI) in 2004: $37,656 (Individual Income Tax Returns) Here:
$37,656State:
$42,606
Salary/wage: $33,959 (reported on 85.9% of returns )Here:
$33,959State:
$36,376
(% of AGI for various income ranges: 104.2% for AGIs below $10k , 77.0% for AGIs $10k-25k , 85.7% for AGIs $25k-50k , 82.9% for AGIs $50k-75k , 80.6% for AGIs $75k-100k , 58.7% for AGIs over 100k ) Taxable interest for individuals: $1,312 (reported on 44.1% of returns )This zip code:
$1,312Maine:
$1,367
(% of AGI for various income ranges: 4.6% for AGIs below $10k , 1.8% for AGIs $10k-25k , 1.0% for AGIs $25k-50k , 1.0% for AGIs $50k-75k , 0.7% for AGIs $75k-100k , 2.7% for AGIs over 100k ) Taxable dividends: $1,753 (reported on 19.3% of returns )(% of AGI for various income ranges: 3.4% for AGIs below $10k , 0.9% for AGIs $10k-25k , 0.6% for AGIs $25k-50k , 0.8% for AGIs $50k-75k , 0.6% for AGIs $75k-100k , 1.3% for AGIs over 100k ) Net capital gain/loss: +$12,501 (reported on 15.5% of returns )Here:
+$12,501State:
+$11,433
(% of AGI for various income ranges: -1.7% for AGIs below $10k , 0.8% for AGIs $10k-25k , 0.8% for AGIs $25k-50k , 1.5% for AGIs $50k-75k , 2.3% for AGIs $75k-100k , 18.2% for AGIs over 100k ) Profit/loss from business: +$10,180 (reported on 15.1% of returns )Here:
+$10,180State:
+$10,755
(% of AGI for various income ranges: 4.8% for AGIs below $10k , 7.4% for AGIs $10k-25k , 4.0% for AGIs $25k-50k , 3.0% for AGIs $50k-75k , 2.5% for AGIs $75k-100k , 4.3% for AGIs over 100k ) IRA payment deduction: $3,109 (reported on 3.0% of returns )(% of AGI for various income ranges: 0.3% for AGIs $10k-25k , 0.3% for AGIs $25k-50k , 0.4% for AGIs $50k-75k , 0.2% for AGIs over 100k ) Self-employed pension: $5,000 (reported on 0.3% of returns )Total itemized deductions: $15,474 (24% of AGI, reported on 33.8% of returns )Here:
$15,474State:
$18,231
Here:
23.9% of AGIState:
21.7% of AGI
(% of AGI for various income ranges: 12.7% for AGIs below $10k , 10.4% for AGIs $10k-25k , 12.2% for AGIs $25k-50k , 15.2% for AGIs $50k-75k , 17.1% for AGIs $75k-100k , 15.1% for AGIs over 100k ) Charity contributions deductions: $1,523 (2% of AGI, reported on 29.1% of returns )Here:
2.2% of AGIState:
2.8% of AGI
(% of AGI for various income ranges: 0.4% for AGIs below $10k , 0.7% for AGIs $10k-25k , 0.9% for AGIs $25k-50k , 1.2% for AGIs $50k-75k , 1.3% for AGIs $75k-100k , 1.8% for AGIs over 100k ) Total tax: $4,975 (reported on 78.2% of returns )(% of AGI for various income ranges: 2.9% for AGIs below $10k , 5.3% for AGIs $10k-25k , 8.2% for AGIs $25k-50k , 9.7% for AGIs $50k-75k , 10.7% for AGIs $75k-100k , 16.6% for AGIs over 100k ) Earned income credit: $1,389 (reported on 12.1% of returns )Percentage of individuals using paid preparers for their 2004 taxes: 49.1%(% for various income ranges: 36.7% for AGIs below $10k , 51.0% for AGIs $10k-25k , 47.5% for AGIs $25k-50k , 55.3% for AGIs $50k-75k , 55.0% for AGIs $75k-100k , 73.4% for AGIs over 100k )
Estimated median household income in 2022: This zip code:
$64,356Maine:
$69,543
Nearest zip codes: 04063 ,
04074 ,
04072 ,
04006 ,
04005 ,
04046 .
Old Orchard Beach Zip Code Map
Percentage of family households: This zip code:
25.1%Maine:
40.0%
Percentage of households with unmarried partners: This zip code:
4.8%Maine:
48.4%
Likely homosexual households (counted as self-reported same-sex unmarried-partner households)
Lesbian couples: 0.3% of all households Gay men: 0.3% of all households
Household received Food Stamps/SNAP in the past 12 months: 551Household did not receive Food Stamps/SNAP in the past 12 months: 4,489
Women who had a birth in the past 12 months: 31 (31 now married , 0 unmarried) Women who did not have a birth in the past 12 months: 1,349 (446 now married , 902 unmarried)
Housing units in zip code 04064 with a mortgage: 2,083 (234
second mortgage , 217
both second mortgage and home equity loan )
Houses without a mortgage: 198
Median monthly owner costs for units with a mortgage: $1,694
Median monthly owner costs for units without a mortgage: $762
Residents with income below the poverty level in 2022:
This zip code:
12.7%Whole state:
10.8%
Residents with income below 50% of the poverty level in 2022:
This zip code:
5.6%Whole state:
5.8%
Median number of rooms in houses and condos: Median number of rooms in apartments: Notable locations in this zip code not listed on our city pages
Click to draw/clear zip code borders Notable locations in zip code 04064: (A) , Dunnegrass Golf Club (B) , Milestone Foundation Extended Care (C) , Edith Belle Libby Memorial Library (D) , Old Orchard Beach Fire Department (E) , Old Orchard Beach Historical Society Museum (F) . Display/hide their locations on the map
Churches in zip code 04064 include: (A) , Campground Tabernacle (B) , Saint Margaret Church (C) , Salvation Army Pavilion (D) , United Methodist Church (E) . Display/hide their locations on the map
Lake: (A) . Display/hide its location on the map
Streams, rivers, and creeks: (A) . Display/hide its location on the map
Parks in zip code 04064 include: (1) , Palace Playland (2) . Display/hide their locations on the map
Beaches: (A) , Surfside Beach (B) . Display/hide their locations on the map
Year house built (houses)
13 2020 or later489 2010 to 2019639 2000 to 2009633 1990 to 19991,482 1980 to 1989646 1970 to 1979504 1960 to 1969241 1950 to 1959317 1940 to 19491,459 1939 or earlier
Zip code 04064 household income distribution in 2022 304 Less than $10,000234 $10,000 to $14,999138 $15,000 to $19,999570 $20,000 to $24,999230 $25,000 to $29,999125 $30,000 to $34,999182 $35,000 to $39,999137 $40,000 to $44,999194 $45,000 to $49,999198 $50,000 to $59,999482 $60,000 to $74,999681 $75,000 to $99,999505 $100,000 to $124,999517 $125,000 to $149,999244 $150,000 to $199,999283 $200,000 or moreEstimate of home value of owner-occupied houses/condos in 2022 in zip code 04064 16 $10,000 to $14,99916 $20,000 to $24,99915 $25,000 to $29,999307 $30,000 to $34,99921 $35,000 to $39,99946 $50,000 to $59,9997 $70,000 to $79,9998 $80,000 to $89,99928 $90,000 to $99,999132 $100,000 to $124,99970 $125,000 to $149,99989 $150,000 to $174,99944 $175,000 to $199,999286 $200,000 to $249,999543 $250,000 to $299,999884 $300,000 to $399,999580 $400,000 to $499,999528 $500,000 to $749,999119 $750,000 to $999,99946 $1,000,000 to $1,499,99949 $2,000,000 or moreRent paid by renters in 2022 in zip code 04064 31 $250 to $29935 $300 to $34932 $450 to $49983 $500 to $5499 $550 to $59925 $600 to $64953 $650 to $69930 $700 to $74912 $750 to $799167 $800 to $899185 $900 to $999254 $1,000 to $1,249141 $1,250 to $1,499173 $1,500 to $1,9998 $2,000 to $2,499136 No cash rent
Median gross rent in 2022: $1,084.
Median price asked for vacant for-sale houses and condos in 2022: $397,360.
Estimated median house (or condo) value in 2022 for: White Non-Hispanic householders: $374,779Black or African American householders: $324,401Two or more races householders: $274,024Hispanic or Latino householders: $271,352Estimated median house or condo value in 2022: $346,156
04064:
$346,156Maine:
$290,600
Lower value quartile - upper value quartile: $209,396 - $485,993
Mean price in 2022: Detached houses: $457,566Here:
$457,566State:
$364,324
Townhouses or other attached units: $693,366Here:
$693,366State:
$496,775
In 2-unit structures: $483,448Here:
$483,448State:
$349,654
In 3-to-4-unit structures: $213,001Here:
$213,001State:
$366,418
In 5-or-more-unit structures: $350,535Here:
$350,535State:
$342,001
Mobile homes: $90,645Here:
$90,645State:
$142,980
Housing units in structures:
One, detached: 3,061One, attached: 580Two: 2793 or 4: 7075 to 9: 51910 to 19: 32920 to 49: 23250 or more: 141Mobile homes: 700Boats, RVs, vans, etc.: 15Unemployment : 4.9%
Means of transportation to work in zip code 04064 74.7% 3,548 Drove a car alone8.7% 412 Carpooled1.5% 70 Subway or elevated0.3% 13 Bicycle2.2% 104 Walked11.9% 564 Worked at homeTravel time to work (commute) in zip code 04064 152 Less than 5 minutes411 5 to 9 minutes442 10 to 14 minutes909 15 to 19 minutes868 20 to 24 minutes348 25 to 29 minutes336 30 to 34 minutes65 35 to 39 minutes146 40 to 44 minutes189 45 to 59 minutes94 60 to 89 minutes176 90 or more minutes
Percentage of zip code residents living and working in this county: 51.6%
Household type by relationship:
Households: 8,536
Male householders: 2,233 (993 living alone ), Female householders: 2,808 (1,432 living alone )1,528 spouses (1,511 opposite-sex spouses ), 436 unmarried partners , (398 opposite-sex unmarried partners ), 1,022 children (906 natural , 33 adopted , 81 stepchildren ), 61 grandchildren , 51 brothers or sisters , 90 parents , 0 foster children , 42 other relatives , 266 non-relatives In group quarters: 56 (-1 institutionalized population )
Size of family households: 1,408 2-persons , 411 3-persons , 300 4-persons , 15 5-persons , 20 6-persons
Size of nonfamily households: 2,430 1-person , 396 2-persons , 18 3-persons , 19 4-persons , 6 5-persons
367 married couples with children. single-parent households (52 men , 132 women ).
89.3% of residents of 04064 zip code speak English at home. of residents speak Spanish at home (76% very well, 24% well ).of residents speak other Indo-European language at home (76% very well, 23% well, 1% not well ).of residents speak other language at home (100% very well ).
Foreign born population: 552 (6.5%)
(53.1%
of them are naturalized citizens )
This zip code:
6.5%Whole state:
4.1%
14% Serbia 13% Sweden 9% Romania 4% Norway 3% Bolivia 0% Haiti 31% French Canadian 13% English 8% French 8% American 8% Irish 4% Scottish 3% Canadian
Year of entry for the foreign-born population
47 2010 or later 149 2000 to 2009 64 1990 to 1999 340 Before 1990
Facilities with environmental interests located in this zip code:
OLD ORCHARD BEACH ME MUNICIPAL PUBLIC WORKS (OLD ORCHARD BEACH in OLD ORCHARD BEACH, ME)
ENFORCEMENT/COMPLIANCE ACTIVITY (Integrated Compliance Information System) - ICIS-01-2003-9103, FORMAL ENFORCEMENT ACTION (Integrated Compliance Information System) - ICIS-01-2003-9103, FORMAL ENFORCEMENT ACTION
JAMESON ELEMENTARY SCHOOL (28 JAMESON HILL ROAD in OLD ORCHARD BCH, ME)
(Geographic Names Information System) (National Center for Education Statistics) - STATE ID-32002 Organizations: OLD ORCHARD BEACH SCHOOL DEPT (SCHOOL DISTRICT)
LORANGER MIDDLE SCHOOL (148 SACO AVENUE in OLD ORCHARD BCH, ME)
(Geographic Names Information System) (National Center for Education Statistics) - STATE ID-32004 Organizations: OLD ORCHARD BEACH SCHOOL DEPT (SCHOOL DISTRICT)
OLD ORCHARD BEACH HIGH SCHOOL (40 E EMERSON CUMMINGS BLVD in OLD ORCHARD BCH, ME)
(Geographic Names Information System) (National Center for Education Statistics) - STATE ID-32006 Organizations: OLD ORCHARD BEACH SCHOOL DEPT (SCHOOL DISTRICT)
7 ELEVEN 32542 (217 SACO AVE in OLD ORCHARD BEACH, ME)
AIR MINOR (AIRS/AFS) Conditionally Exempt Small Quantity Generators, less than 100 kg/month of hazardous waste (Resource Conservation and Recovery Act (tracking hazardous waste)) - notification Organizations: CHRISTYS MARKET INC (CONTACT/OWNER)
Alternative names: CHRISTY'S STORE # 317, CHRISTY'S STORE # 317
P & D WASTE TRANSFER (155 SACO AVE in OLD ORCHARD BEACH, ME)
(Resource Conservation and Recovery Act (tracking hazardous waste)) Organizations: OWNERNAME (CONTACT/OWNER)
MAINE DRY CLEANERS (34 WASHINGTON AVENUE in OLD ORCHARD BEA, ME)
AIR MINOR (AIRS/AFS) Business SIC classification: DRYCLEANING PLANTS, EXCEPT RUG CLEANING
OLD ORCHARD BEACH WASTEWATER TREATMENT FACILITY (MANOR STREET in OLD ORCHARD BEACH, ME)
National Pollutant Discharge Elimination System MAJOR (Tracking pollutant discharge elimination systems) - permit Business SIC classification: SEWERAGE SYSTEMSOrganizations: OLD ORCHARD BEACH, TOWN OF (CONTACT/OPERATOR)
Alternative names: OLD ORCHARD BEACH TOWN WPCF, TOWN OF OLD ORCHARD BEACH
ROSENTHORNE ASSOCIATES (BLOW BROS) (1 VALLE RD in OLD ORCHARD BEACH, ME)
ENFORCEMENT/COMPLIANCE ACTIVITY (Integrated Compliance Information System)
MACDONALDS SERVICE CENTER (MOBIL) (37 SACO AVE in OLD ORCHARD BEACH, ME)
ENFORCEMENT/COMPLIANCE ACTIVITY (Integrated Compliance Information System)
OLD ORCHARD BEACH SCHOOL DEPT (28 JAMESON HILL ROAD in OLD ORCHARD BEACH, ME)
COMPLIANCE ACTIVITY (Tracking inspections of insecticide, fungicide, and rodenticide, and toxic substances)
PATTERSONS GAS & GROCERY (FOUR CORNERS) (141 SACO AVE in OLD ORCHARD BEACH, ME)
ENFORCEMENT/COMPLIANCE ACTIVITY (Integrated Compliance Information System)
Housing units lacking complete plumbing facilities: 0.1%
Housing units lacking complete kitchen facilities: 1.1%
50.7% Fuel oil, kerosene, etc. 17.9% Electricity 12.9% Bottled, tank, or LP gas 12.6% Utility gas 3.3% Wood 2.6% Other fuel
Population in 1990: 8,451. Population change in the 1990s: +342 (+4.0%).
Place of birth for U.S.-born residents:
This state: 4,734Northeast: 2,385Midwest: 148South: 366West: 276
49% of the 04064 zip code residents lived in the same house 5 years ago.
Out of people who lived in different houses, 47% lived in this county.
Out of people who lived in different counties, 50% lived in Maine.
91% of the 04064 zip code residents lived in the same house 1 year ago.
Out of people who lived in different houses, 27% moved from this county.
Out of people who lived in different houses, 15% moved from different county within same state.
Out of people who lived in different houses, 62% moved from different state.
Out of people who lived in different houses, 6% moved from abroad.
Private vs. public school enrollment:
Students in private schools in grades 1 to 8 (elementary and middle school):
Students in private schools in grades 9 to 12 (high school): 30
Students in private undergraduate colleges: 60
Occupation by median earnings in the past 12 months ($)
92,583 Computer and mathematical occupations 90,963 Community and social service occupations 71,047 Management occupations 68,609 Health diagnosing and treating practitioners and other technical occupations 64,507 Installation, maintenance, and repair occupations 56,784 Health technologists and technicians
Companies with federal contracts located in this zip code:
BLOW BROTHERS (1 VALLEY LN in OLD ORCHARD BE, ME; small business)
$11,212 with Navy for Other Housekeeping Services. Signed on 2005-08-04. Completion date: 2005-09-14.
BLOW BROS INC (1 VALLEY LN in OLD ORCHARD BE, ME; small business)
$3,830 with Army for Lease or Rental of Equipment -- Toiletries. Signed on 2003-06-06. Completion date: 2003-06-26.
Top industries in this zip code by the number of employees in 2005:
Accommodation and Food Services: Full-Service Restaurants (50-99 employees: 1 establishment, 10-19 employees: 2 establishments, 5-9 employees: 2 establishments, 1-4 employees: 14 establishments)Accommodation and Food Services: Hotels (except Casino Hotels) and Motels (10-19: 1, 5-9: 5, 1-4: 42)Accommodation and Food Services: Limited-Service Restaurants (20-49: 1, 5-9: 1, 1-4: 19)Administrative and Support and Waste Management and Remediation Services: Solid Waste Collection (50-99: 1)Health Care and Social Assistance: Residential Mental Health and Substance Abuse Facilities (20-49: 1)Accommodation and Food Services: Caterers (20-49: 1)Finance and Insurance: Savings Institutions (20-49: 1)Accommodation and Food Services: Drinking Places (Alcoholic Beverages) (10-19: 1, 1-4: 7)Accommodation and Food Services: RV (Recreational Vehicle) Parks and Campgrounds (5-9: 2, 1-4: 6)
People in group quarters in 2010:
35 people in residential treatment centers for adults
6 people in workers' group living quarters and job corps centers
People in group quarters in 2000:
24 people in homes or halfway houses for drug/alcohol abuse
5 people in homes for the mentally retarded
4 people in other group homes
Fatal accident statistics in 2013:
Fatal accident count: 1Vehicles involved in fatal accidents: 2Fatal accidents caused by drunken drivers: 0Fatalities: 1Persons involved in fatal accidents: 2Pedestrians involved in fatal accidents: 0
Fatal accident statistics in 2010:
Fatal accident count: 1Vehicles involved in fatal accidents: 2Fatal accidents caused by drunken drivers: 0Fatalities: 1Persons involved in fatal accidents: 2Pedestrians involved in fatal accidents: 0
Home Mortgage Disclosure Act Aggregated Statistics For Year 2009(Based on 2 partial tracts) A) FHA, FSA/RHS & VA B) Conventional C) Refinancings D) Home Improvement Loans E) Loans on Dwellings For 5+ Families F) Non-occupant Loans on G) Loans On Manufactured Number Average Value Number Average Value Number Average Value Number Average Value Number Average Value Number Average Value Number Average Value
LOANS ORIGINATED 72 $160,605 191 $154,104 487 $173,610 61 $101,165 4 $242,960 238 $205,050 26 $32,375 APPLICATIONS APPROVED, NOT ACCEPTED 6 $156,088 11 $102,201 39 $132,075 4 $13,008 0 $0 15 $108,767 4 $37,165 APPLICATIONS DENIED 11 $200,685 63 $111,374 247 $190,116 19 $81,272 0 $0 85 $205,211 33 $36,488 APPLICATIONS WITHDRAWN 13 $162,950 20 $144,104 111 $206,796 4 $83,620 2 $167,240 30 $221,745 4 $31,125 FILES CLOSED FOR INCOMPLETENESS 4 $122,178 7 $201,747 22 $226,700 0 $0 0 $0 11 $253,897 2 $59,460
Aggregated Statistics For Year 2008(Based on 2 partial tracts) A) FHA, FSA/RHS & VA B) Conventional C) Refinancings D) Home Improvement Loans E) Loans on Dwellings For 5+ Families F) Non-occupant Loans on G) Loans On Manufactured Number Average Value Number Average Value Number Average Value Number Average Value Number Average Value Number Average Value Number Average Value
LOANS ORIGINATED 32 $142,791 229 $156,397 292 $175,912 72 $51,952 2 $185,820 195 $189,965 43 $36,775 APPLICATIONS APPROVED, NOT ACCEPTED 7 $213,161 32 $177,400 63 $177,886 4 $190,930 0 $0 35 $193,306 2 $31,590 APPLICATIONS DENIED 17 $151,279 72 $140,707 182 $213,713 33 $74,272 0 $0 69 $181,780 30 $27,687 APPLICATIONS WITHDRAWN 2 $155,160 19 $181,517 104 $180,228 9 $94,974 0 $0 22 $243,255 4 $27,872 FILES CLOSED FOR INCOMPLETENESS 0 $0 6 $100,652 13 $142,795 2 $198,825 0 $0 4 $277,338 4 $23,228
Aggregated Statistics For Year 2007(Based on 2 partial tracts) A) FHA, FSA/RHS & VA B) Conventional C) Refinancings D) Home Improvement Loans E) Loans on Dwellings For 5+ Families F) Non-occupant Loans on G) Loans On Manufactured Number Average Value Number Average Value Number Average Value Number Average Value Number Average Value Number Average Value Number Average Value
LOANS ORIGINATED 20 $215,086 407 $178,629 379 $165,605 102 $81,907 4 $212,765 258 $219,304 41 $35,895 APPLICATIONS APPROVED, NOT ACCEPTED 2 $209,045 80 $172,325 87 $198,101 9 $111,904 0 $0 39 $294,977 7 $69,550 APPLICATIONS DENIED 7 $178,121 134 $207,245 279 $188,517 50 $78,862 4 $95,698 111 $229,881 28 $36,434 APPLICATIONS WITHDRAWN 2 $164,450 54 $167,307 95 $178,368 13 $122,642 0 $0 45 $207,994 0 $0 FILES CLOSED FOR INCOMPLETENESS 0 $0 15 $142,214 37 $203,649 2 $51,100 2 $286,165 9 $180,659 2 $31,590
Aggregated Statistics For Year 2006(Based on 2 partial tracts) A) FHA, FSA/RHS & VA B) Conventional C) Refinancings D) Home Improvement Loans E) Loans on Dwellings For 5+ Families F) Non-occupant Loans on G) Loans On Manufactured Number Average Value Number Average Value Number Average Value Number Average Value Number Average Value Number Average Value Number Average Value
LOANS ORIGINATED 11 $209,639 517 $166,487 533 $162,371 175 $55,215 11 $219,605 336 $181,556 35 $40,933 APPLICATIONS APPROVED, NOT ACCEPTED 0 $0 95 $153,976 65 $171,126 17 $50,281 0 $0 50 $210,125 7 $50,967 APPLICATIONS DENIED 2 $97,555 128 $161,881 203 $171,989 46 $122,480 7 $379,604 78 $223,985 30 $40,571 APPLICATIONS WITHDRAWN 2 $134,720 41 $152,826 121 $148,549 13 $360,205 4 $22,298 32 $169,851 6 $34,377 FILES CLOSED FOR INCOMPLETENESS 0 $0 7 $166,707 72 $134,565 0 $0 0 $0 13 $177,244 7 $42,473
Aggregated Statistics For Year 2005(Based on 2 partial tracts) A) FHA, FSA/RHS & VA B) Conventional C) Refinancings D) Home Improvement Loans E) Loans on Dwellings For 5+ Families F) Non-occupant Loans on G) Loans On Manufactured Number Average Value Number Average Value Number Average Value Number Average Value Number Average Value Number Average Value Number Average Value
LOANS ORIGINATED 22 $174,417 712 $152,127 645 $152,571 152 $85,648 11 $490,227 383 $174,550 52 $36,985 APPLICATIONS APPROVED, NOT ACCEPTED 0 $0 106 $148,270 76 $201,639 13 $111,063 2 $209,045 56 $148,191 6 $31,590 APPLICATIONS DENIED 0 $0 195 $123,918 344 $168,356 74 $72,771 0 $0 82 $176,030 74 $44,948 APPLICATIONS WITHDRAWN 2 $131,005 91 $151,576 260 $155,617 20 $102,572 2 $139,365 37 $179,894 6 $55,127 FILES CLOSED FOR INCOMPLETENESS 0 $0 15 $117,562 58 $191,042 4 $78,510 0 $0 7 $275,279 2 $232,275
Aggregated Statistics For Year 2004(Based on 2 partial tracts) A) FHA, FSA/RHS & VA B) Conventional C) Refinancings D) Home Improvement Loans E) Loans on Dwellings For 5+ Families F) Non-occupant Loans on G) Loans On Manufactured Number Average Value Number Average Value Number Average Value Number Average Value Number Average Value Number Average Value Number Average Value
LOANS ORIGINATED 33 $160,594 615 $145,453 641 $135,956 143 $60,229 9 $210,802 379 $154,682 52 $35,342 APPLICATIONS APPROVED, NOT ACCEPTED 0 $0 74 $132,334 82 $129,575 7 $70,877 0 $0 37 $141,675 26 $45,955 APPLICATIONS DENIED 4 $134,720 123 $129,998 206 $147,583 48 $59,153 4 $313,108 61 $165,837 43 $39,195 APPLICATIONS WITHDRAWN 0 $0 80 $145,613 219 $150,675 28 $82,557 0 $0 48 $171,884 11 $49,834 FILES CLOSED FOR INCOMPLETENESS 0 $0 2 $142,150 45 $124,086 2 $18,580 0 $0 2 $150,515 0 $0
Aggregated Statistics For Year 2003(Based on 2 partial tracts) A) FHA, FSA/RHS & VA B) Conventional C) Refinancings D) Home Improvement Loans E) Loans on Dwellings For 5+ Families F) Non-occupant Loans on Number Average Value Number Average Value Number Average Value Number Average Value Number Average Value Number Average Value
LOANS ORIGINATED 17 $144,393 481 $138,036 1,165 $115,851 65 $57,004 13 $294,596 401 $138,105 APPLICATIONS APPROVED, NOT ACCEPTED 2 $55,745 52 $143,189 143 $141,184 6 $28,492 6 $458,357 35 $160,973 APPLICATIONS DENIED 4 $141,688 97 $120,227 286 $122,115 22 $43,668 0 $0 65 $154,288 APPLICATIONS WITHDRAWN 6 $132,862 46 $162,350 236 $135,554 6 $23,227 2 $538,880 32 $136,694 FILES CLOSED FOR INCOMPLETENESS 0 $0 7 $199,624 37 $118,222 4 $30,195 0 $0 7 $177,060
Aggregated Statistics For Year 2002(Based on 2 partial tracts) A) FHA, FSA/RHS & VA B) Conventional C) Refinancings D) Home Improvement Loans E) Loans on Dwellings For 5+ Families F) Non-occupant Loans on Number Average Value Number Average Value Number Average Value Number Average Value Number Average Value Number Average Value
LOANS ORIGINATED 82 $105,170 526 $125,718 792 $108,461 80 $45,247 20 $267,024 321 $130,352 APPLICATIONS APPROVED, NOT ACCEPTED 2 $136,580 78 $105,322 97 $101,990 6 $10,220 2 $75,255 43 $102,849 APPLICATIONS DENIED 11 $104,735 121 $88,410 195 $97,408 28 $50,769 0 $0 43 $93,040 APPLICATIONS WITHDRAWN 6 $105,298 22 $119,685 167 $105,917 11 $32,941 4 $812,032 19 $122,837 FILES CLOSED FOR INCOMPLETENESS 0 $0 2 $39,950 17 $105,918 2 $23,225 0 $0 2 $79,905
Aggregated Statistics For Year 2001(Based on 2 partial tracts) A) FHA, FSA/RHS & VA B) Conventional C) Refinancings D) Home Improvement Loans E) Loans on Dwellings For 5+ Families F) Non-occupant Loans on Number Average Value Number Average Value Number Average Value Number Average Value Number Average Value Number Average Value
LOANS ORIGINATED 95 $90,230 422 $98,502 505 $106,219 67 $38,190 6 $436,987 258 $105,824 APPLICATIONS APPROVED, NOT ACCEPTED 7 $127,684 45 $83,578 41 $109,407 13 $24,585 0 $0 9 $54,507 APPLICATIONS DENIED 11 $97,640 152 $56,724 203 $88,406 30 $18,892 2 $24,155 46 $88,668 APPLICATIONS WITHDRAWN 4 $101,738 22 $80,325 175 $90,786 9 $27,253 4 $135,648 17 $94,440 FILES CLOSED FOR INCOMPLETENESS 0 $0 4 $102,665 22 $71,710 0 $0 0 $0 2 $102,200
Aggregated Statistics For Year 2000(Based on 2 partial tracts) A) FHA, FSA/RHS & VA B) Conventional C) Refinancings D) Home Improvement Loans E) Loans on Dwellings For 5+ Families F) Non-occupant Loans on Number Average Value Number Average Value Number Average Value Number Average Value Number Average Value Number Average Value
LOANS ORIGINATED 97 $86,780 426 $83,615 136 $77,580 82 $17,630 2 $118,925 139 $89,367 APPLICATIONS APPROVED, NOT ACCEPTED 4 $86,870 41 $81,806 28 $96,892 20 $39,672 0 $0 7 $96,096 APPLICATIONS DENIED 15 $101,953 195 $58,691 171 $69,742 72 $23,821 0 $0 32 $101,911 APPLICATIONS WITHDRAWN 6 $91,982 33 $87,110 108 $84,927 0 $0 0 $0 20 $72,842 FILES CLOSED FOR INCOMPLETENESS 0 $0 6 $130,383 13 $97,913 2 $1,860 0 $0 2 $65,965
Aggregated Statistics For Year 1999(Based on 1 partial tract) A) FHA, FSA/RHS & VA B) Conventional C) Refinancings D) Home Improvement Loans E) Loans on Dwellings For 5+ Families F) Non-occupant Loans on Number Average Value Number Average Value Number Average Value Number Average Value Number Average Value Number Average Value
LOANS ORIGINATED 55 $83,719 222 $82,319 130 $75,864 25 $18,308 4 $72,630 58 $90,651 APPLICATIONS APPROVED, NOT ACCEPTED 1 $51,160 19 $69,482 16 $66,236 14 $26,494 0 $0 6 $75,677 APPLICATIONS DENIED 6 $103,237 62 $65,573 84 $84,160 27 $34,074 0 $0 24 $105,178 APPLICATIONS WITHDRAWN 4 $90,448 14 $101,997 46 $61,608 1 $22,840 0 $0 8 $88,848 FILES CLOSED FOR INCOMPLETENESS 1 $32,890 1 $51,160 10 $77,291 1 $13,700 0 $0 1 $57,560
Detailed HMDA statistics for the following Tracts:
0061.00
Private Mortgage Insurance Companies Aggregated Statistics For Year 2009(Based on 2 partial tracts) A) Conventional B) Refinancings C) Non-occupant Loans on Number Average Value Number Average Value Number Average Value
LOANS ORIGINATED 6 $127,597 9 $232,894 4 $220,660 APPLICATIONS APPROVED, NOT ACCEPTED 2 $113,350 4 $212,765 2 $113,350 APPLICATIONS DENIED 6 $198,208 2 $232,275 0 $0 APPLICATIONS WITHDRAWN 0 $0 0 $0 0 $0 FILES CLOSED FOR INCOMPLETENESS 2 $180,245 2 $246,210 0 $0
Aggregated Statistics For Year 2008(Based on 2 partial tracts) A) Conventional B) Refinancings C) Non-occupant Loans on Number Average Value Number Average Value Number Average Value
LOANS ORIGINATED 61 $178,174 19 $244,891 26 $173,098 APPLICATIONS APPROVED, NOT ACCEPTED 7 $227,763 9 $172,812 6 $169,407 APPLICATIONS DENIED 7 $178,919 7 $279,791 4 $248,070 APPLICATIONS WITHDRAWN 2 $120,785 4 $182,102 4 $134,720 FILES CLOSED FOR INCOMPLETENESS 2 $75,255 0 $0 0 $0
Aggregated Statistics For Year 2007(Based on 2 partial tracts) A) Conventional B) Refinancings C) Non-occupant Loans on D) Loans On Manufactured Number Average Value Number Average Value Number Average Value Number Average Value
LOANS ORIGINATED 97 $197,467 22 $223,744 30 $229,302 0 $0 APPLICATIONS APPROVED, NOT ACCEPTED 17 $209,321 11 $217,578 4 $222,985 0 $0 APPLICATIONS DENIED 2 $39,950 0 $0 0 $0 2 $39,950 APPLICATIONS WITHDRAWN 7 $358,633 2 $135,650 6 $355,227 0 $0 FILES CLOSED FOR INCOMPLETENESS 0 $0 0 $0 0 $0 0 $0
Aggregated Statistics For Year 2006(Based on 2 partial tracts) A) Conventional B) Refinancings C) Non-occupant Loans on Number Average Value Number Average Value Number Average Value
LOANS ORIGINATED 65 $158,033 17 $176,419 13 $182,246 APPLICATIONS APPROVED, NOT ACCEPTED 17 $172,594 7 $224,311 7 $251,919 APPLICATIONS DENIED 2 $125,430 0 $0 0 $0 APPLICATIONS WITHDRAWN 0 $0 2 $137,505 0 $0 FILES CLOSED FOR INCOMPLETENESS 0 $0 0 $0 0 $0
Aggregated Statistics For Year 2005(Based on 2 partial tracts) A) Conventional B) Refinancings C) Non-occupant Loans on Number Average Value Number Average Value Number Average Value
LOANS ORIGINATED 89 $175,819 26 $158,233 39 $188,584 APPLICATIONS APPROVED, NOT ACCEPTED 11 $172,137 11 $162,845 6 $148,657 APPLICATIONS DENIED 2 $84,550 2 $132,860 2 $84,550 APPLICATIONS WITHDRAWN 6 $142,152 2 $237,850 4 $133,790 FILES CLOSED FOR INCOMPLETENESS 0 $0 0 $0 0 $0
Aggregated Statistics For Year 2004(Based on 2 partial tracts) A) Conventional B) Refinancings C) Non-occupant Loans on Number Average Value Number Average Value Number Average Value
LOANS ORIGINATED 121 $157,624 32 $157,482 45 $178,924 APPLICATIONS APPROVED, NOT ACCEPTED 9 $167,444 9 $183,756 4 $225,308 APPLICATIONS DENIED 2 $108,705 0 $0 2 $108,705 APPLICATIONS WITHDRAWN 4 $100,808 0 $0 2 $126,360 FILES CLOSED FOR INCOMPLETENESS 0 $0 0 $0 0 $0
Aggregated Statistics For Year 2003(Based on 2 partial tracts) A) Conventional B) Refinancings C) Non-occupant Loans on Number Average Value Number Average Value Number Average Value
LOANS ORIGINATED 134 $131,738 56 $133,790 52 $162,235 APPLICATIONS APPROVED, NOT ACCEPTED 17 $137,179 11 $123,148 11 $158,454 APPLICATIONS DENIED 4 $144,010 0 $0 2 $187,680 APPLICATIONS WITHDRAWN 4 $149,585 11 $159,805 2 $166,310 FILES CLOSED FOR INCOMPLETENESS 0 $0 0 $0 0 $0
Aggregated Statistics For Year 2002(Based on 2 partial tracts) A) Conventional B) Refinancings C) Non-occupant Loans on Number Average Value Number Average Value Number Average Value
LOANS ORIGINATED 164 $126,165 46 $139,123 41 $128,986 APPLICATIONS APPROVED, NOT ACCEPTED 11 $143,757 9 $134,203 2 $160,735 APPLICATIONS DENIED 4 $87,800 0 $0 0 $0 APPLICATIONS WITHDRAWN 2 $157,945 0 $0 2 $157,945 FILES CLOSED FOR INCOMPLETENESS 0 $0 0 $0 0 $0
Aggregated Statistics For Year 2001(Based on 2 partial tracts) A) Conventional B) Refinancings C) Non-occupant Loans on Number Average Value Number Average Value Number Average Value
LOANS ORIGINATED 104 $110,277 33 $116,447 26 $107,490 APPLICATIONS APPROVED, NOT ACCEPTED 9 $111,492 7 $144,143 4 $109,170 APPLICATIONS DENIED 6 $120,783 0 $0 0 $0 APPLICATIONS WITHDRAWN 0 $0 2 $157,020 0 $0 FILES CLOSED FOR INCOMPLETENESS 0 $0 0 $0 0 $0
Aggregated Statistics For Year 2000(Based on 2 partial tracts) A) Conventional B) Refinancings C) Non-occupant Loans on Number Average Value Number Average Value Number Average Value
LOANS ORIGINATED 123 $100,690 9 $121,402 17 $94,549 APPLICATIONS APPROVED, NOT ACCEPTED 9 $95,181 2 $126,360 2 $68,755 APPLICATIONS DENIED 2 $74,330 0 $0 0 $0 APPLICATIONS WITHDRAWN 2 $65,965 0 $0 2 $65,965 FILES CLOSED FOR INCOMPLETENESS 0 $0 0 $0 0 $0
Aggregated Statistics For Year 1999(Based on 1 partial tract) A) Conventional B) Refinancings C) Non-occupant Loans on Number Average Value Number Average Value Number Average Value
LOANS ORIGINATED 48 $88,752 4 $112,600 13 $89,182 APPLICATIONS APPROVED, NOT ACCEPTED 7 $75,960 2 $68,065 3 $63,040 APPLICATIONS DENIED 3 $127,600 2 $102,325 1 $77,660 APPLICATIONS WITHDRAWN 0 $0 0 $0 0 $0 FILES CLOSED FOR INCOMPLETENESS 0 $0 0 $0 0 $0
Detailed PMIC statistics for the following Tracts:
0061.00
2003 - 2018 National Fire Incident Reporting System (NFIRS) incidents See full 2006 National Fire Incident Reporting System statistics for zip code 04064, Maine
Most common first names in zip code 04064 among deceased individuals Name Count Lived (average)
John 58 73.9 years Joseph 51 71.9 years Robert 46 65.8 years William 44 74.7 years George 36 75.1 years James 36 71.0 years Charles 33 74.4 years Marie 33 79.9 years Mary 32 80.6 years Paul 27 68.8 years
Most common last names in zip code 04064 among deceased individuals Last name Count Lived (average)
Smith 16 75.4 years Cote 12 75.3 years Murphy 11 74.4 years Bolduc 10 70.3 years Sullivan 9 83.0 years Thompson 9 78.2 years Davis 9 79.1 years Anderson 9 76.1 years Milliken 8 79.9 years Gagnon 8 75.0 years
Businesses in zip code 04064
Name Count Name Count
7-Eleven 1 Knights Inn 1 Dairy Queen 1 Rite Aid 1 FedEx 1 Subway 1 GNC 1


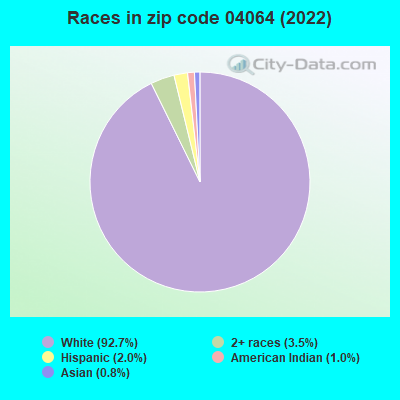


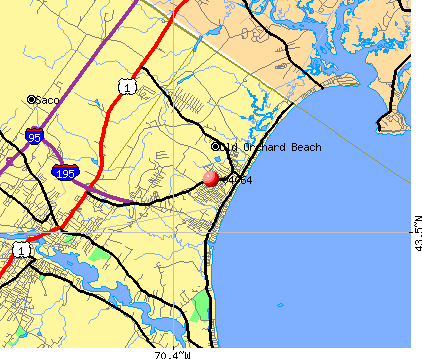 Nearest zip codes: 04063, 04074, 04072, 04006, 04005, 04046.
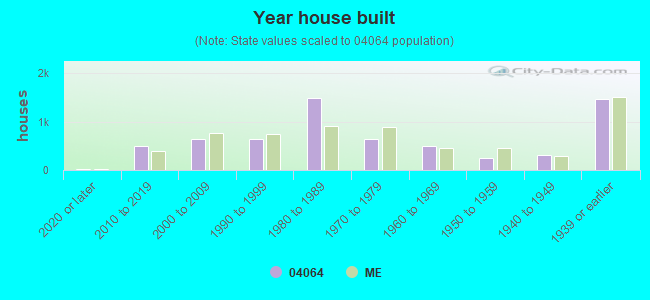

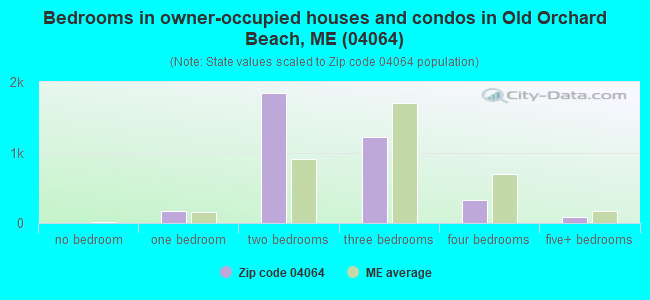
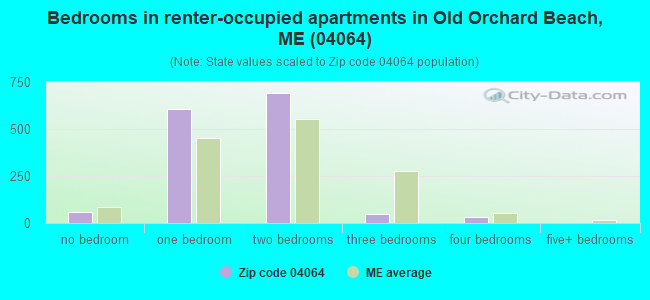
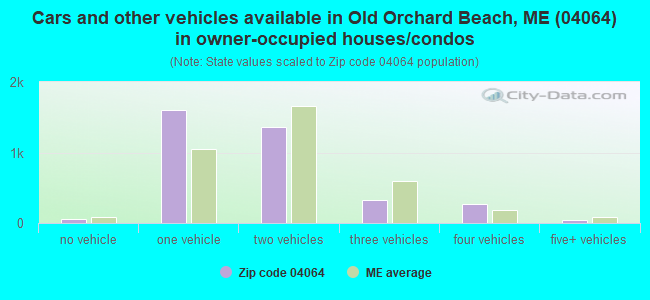
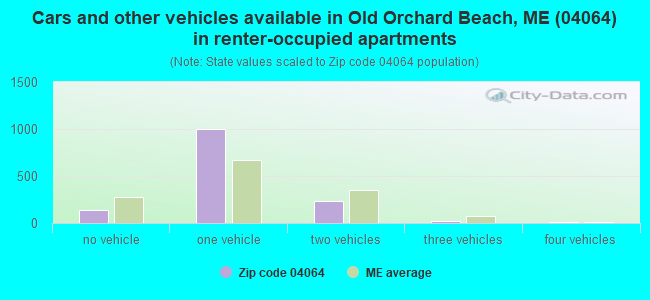


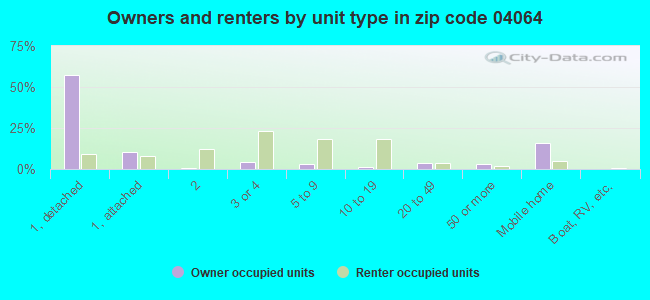
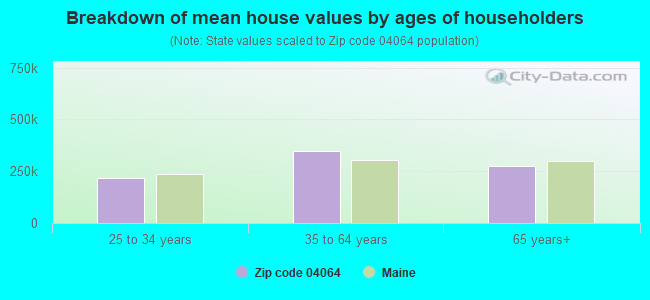


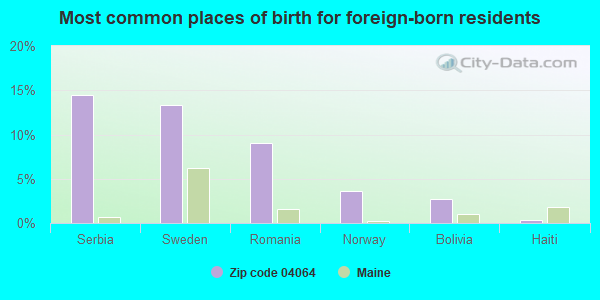
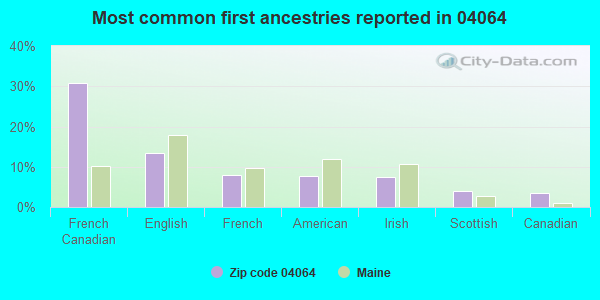
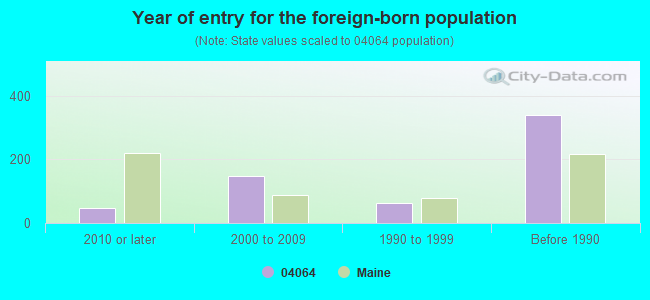


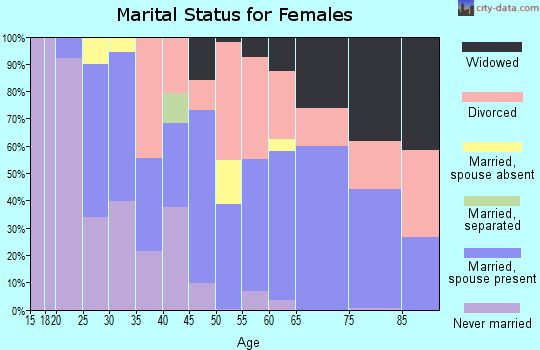
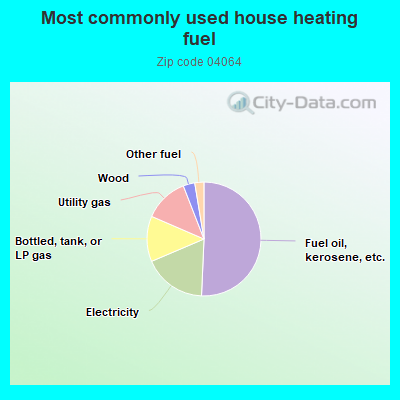
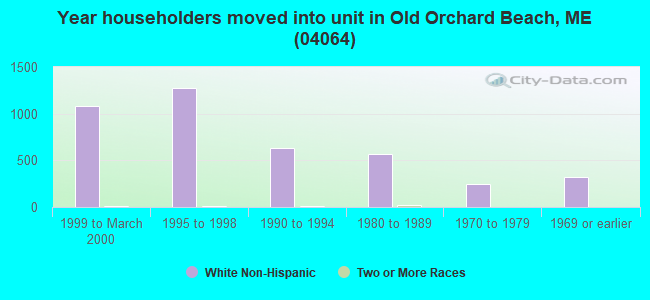
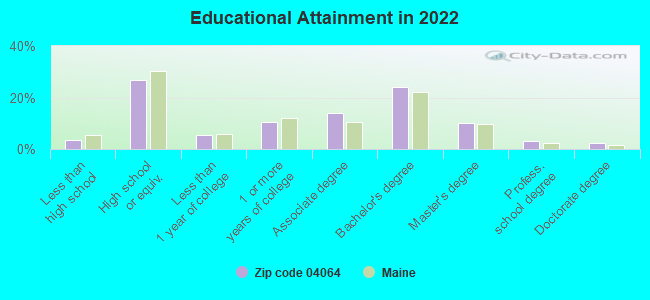
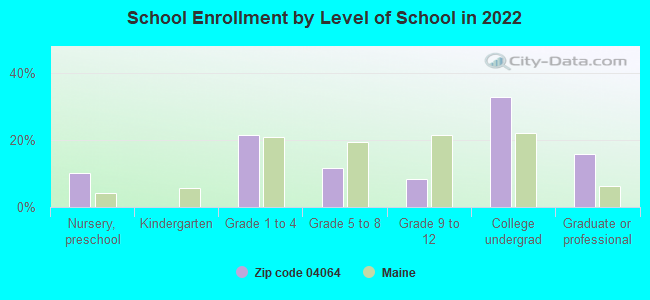
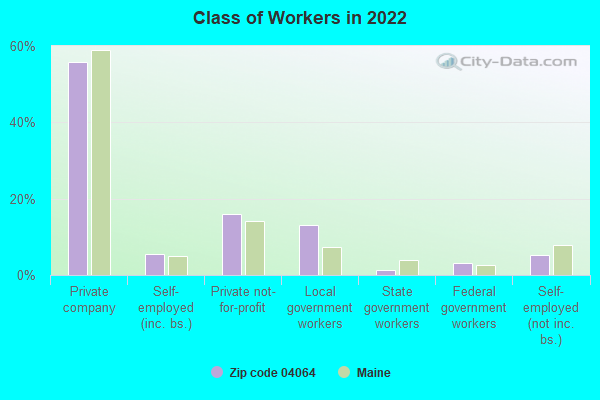
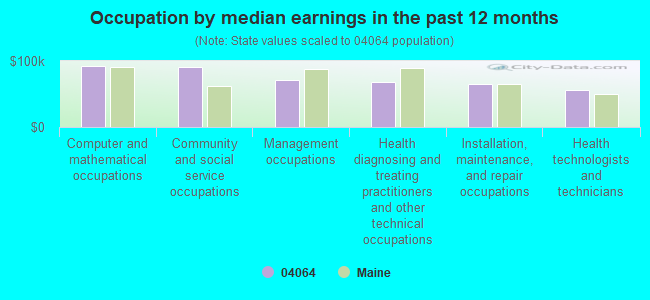
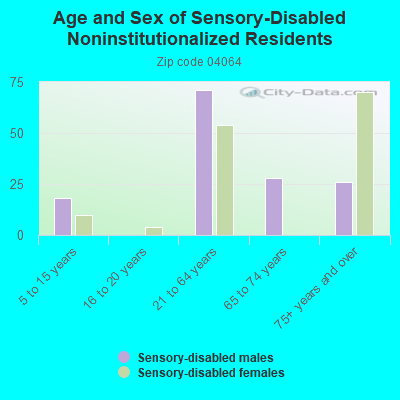
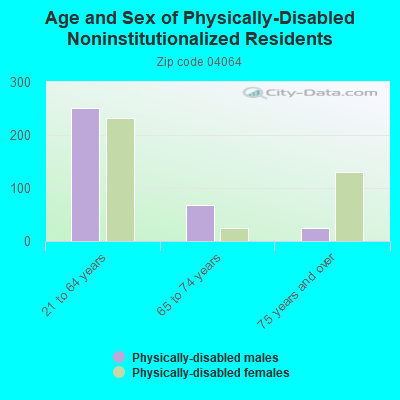
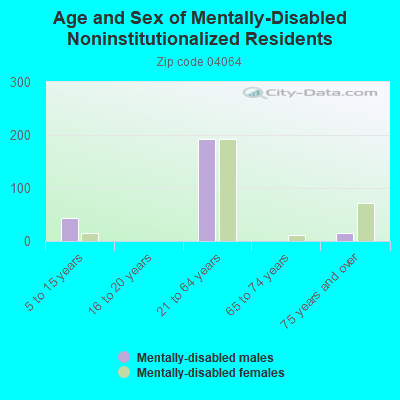
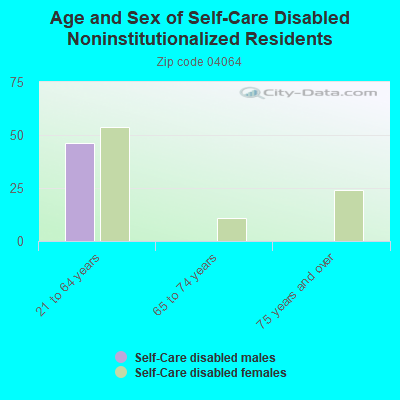
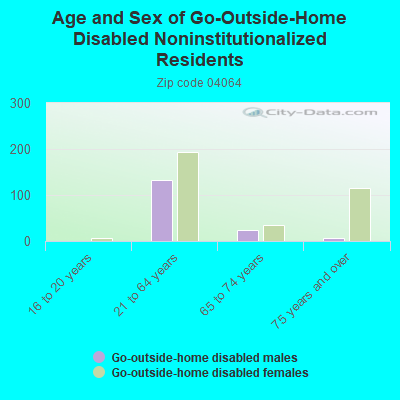
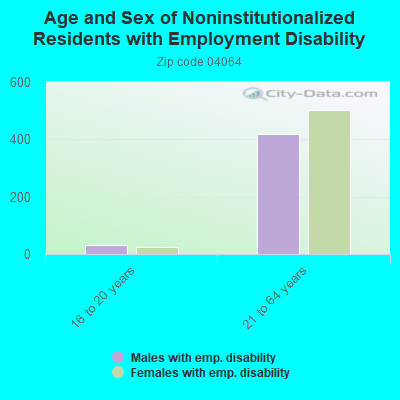
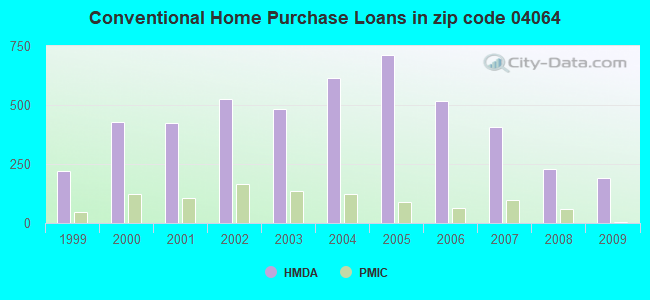
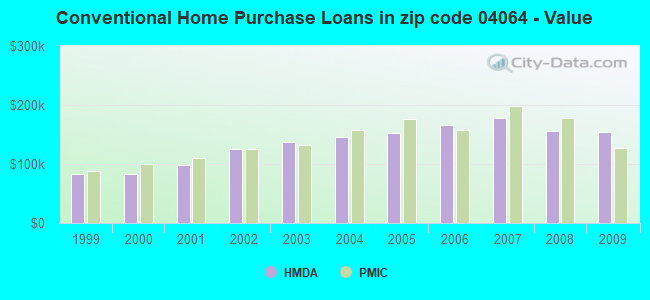
 Based on the data from the years 2003 - 2018 the average number of fire incidents per year is 22. The highest number of reported fires - 74 took place in 2004, and the least - 2 in 2010. The data has a growing trend.
 When looking into fire subcategories, the most reports belonged to: Structure Fires (64.2%), and Outside Fires (18.2%).