Estimated zip code population in 2022: 4,830 Zip code population in 2010: 4,281 Zip code population in 2000: 4,159
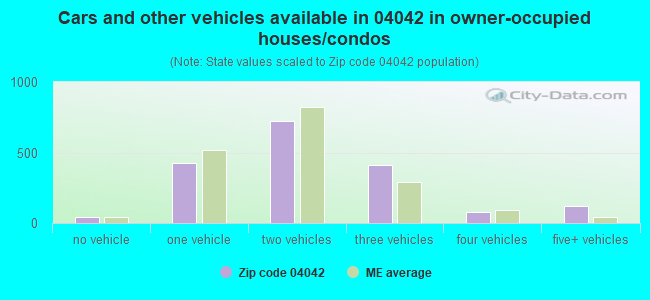
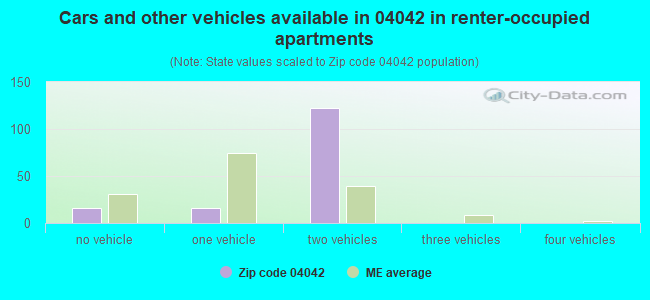
Houses and condos: 2,091 Renter-occupied apartments: 154
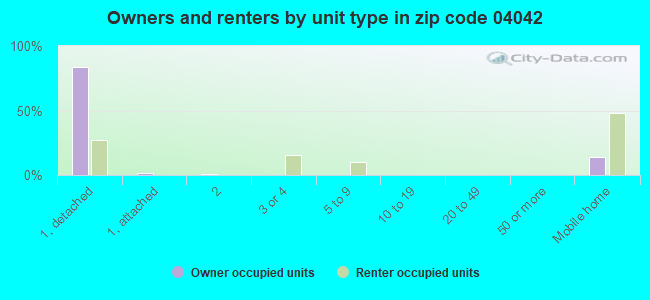
% of renters here:
8%
State:
26%
March 2022 cost of living index in zip code 04042: 99.3 (near average, U.S. average is 100)
Land area: 32.0 sq. mi. Water area: 1.0 sq. mi.
Population density: 151 people per square mile
(very low).
OSM Map
Google Map
MSN Map
OSM Map
General Map
Google Map
MSN Map
OSM Map
Google Map
MSN Map
OSM Map
Google Map
MSN Map
Please wait while loading the map...
Real estate property taxes paid for housing units in 2022:
This zip code:
0.8% ($2,422)
Maine:
1.0% ($2,785)
Median real estate property taxes paid for housing units with mortgages in 2022: $2,464 (0.7%) Median real estate property taxes paid for housing units with no mortgage in 2022: $2,369 (0.9%)
Business Search- 14 Million verified businesses
Males: 2,405
(49.8%)
Females: 2,424
(50.2%)
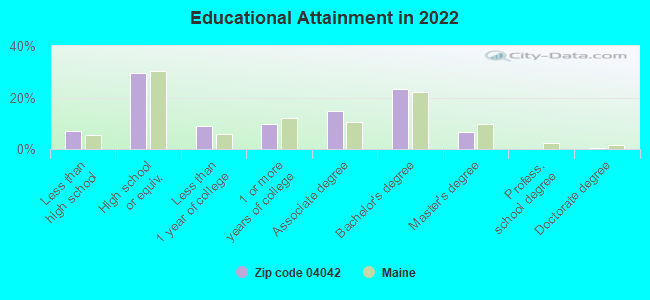
For population 25 years and over in 04042:
High school or higher: 92.3%
Bachelor's degree or higher: 30.0%
Graduate or professional degree: 7.1%
Unemployed: 1.8%
Mean travel time to work (commute): 26.9 minutes
For population 15 years and over in 04042:
Never married: 30.6%
Now married: 55.8%
Separated: 0.0%
Widowed: 4.0%
Divorced: 9.5%
Zip code 04042 compared to state average:
Unemployed percentage below state average.
Foreign-born population percentage below state average.
Renting percentage significantly below state average.
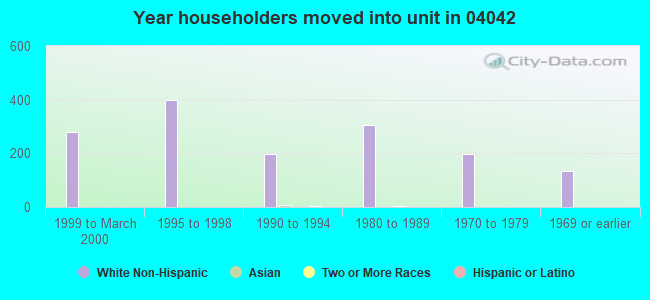
Length of stay since moving in significantly above state average.
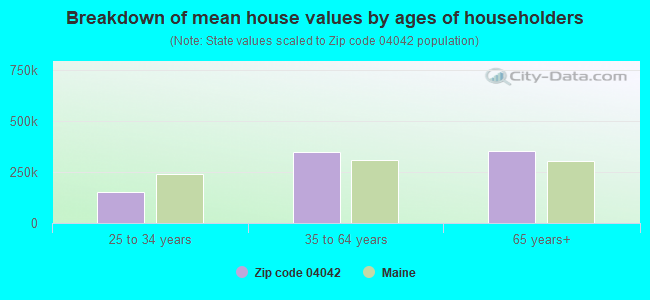
Estimated median house/condo value in 2022: $322,651
04042:
$322,651
Maine:
$290,600
According to our research of Maine and other state lists, there were 7 registered sex offenders living in 04042 zip code as of May 04, 2024. The ratio of all residents to sex offenders in zip code 04042 is 640 to 1. The ratio of registered sex offenders to all residents in this zip code is lower than the state average.
Median resident age:
This zip code:
47.1 years
Maine median age:
45.1 years
Average household size:
This zip code:
2.5 people
Maine:
2.2 people
Averages for the 2020 tax year for zip code 04042, filed in 2021:
Average Adjusted Gross Income (AGI) in 2020: $63,642 (Individual Income Tax Returns)
Here:
$63,642
State:
$68,227
Salary/wage: $57,708 (reported on 85.3% of returns)
Here:
$57,708
State:
$55,127
(% of AGI for various income ranges: 986.9% for AGIs below $25k, 3807.2% for AGIs $25k-50k, 6636.7% for AGIs $50k-75k, 9869.1% for AGIs $75k-100k, 16668.8% for AGIs $100k-200k)
Taxable interest for individuals: $645 (reported on 38.5% of returns)
This zip code:
$645
Maine:
$1,162
(% of AGI for various income ranges: 26.0% for AGIs below $25k, 14.3% for AGIs $25k-50k, 21.2% for AGIs $50k-75k, 30.0% for AGIs $75k-100k, 78.5% for AGIs $100k-200k)
Ordinary dividends: $3,261 (reported on 15.1% of returns)
Here:
$3,261
State:
$7,695
(% of AGI for various income ranges: 21.3% for AGIs below $25k, 41.5% for AGIs $25k-50k, 47.0% for AGIs $50k-75k, 96.8% for AGIs $75k-100k, 92.3% for AGIs $100k-200k)
Net capital gain/loss in AGI: +$9,745 (reported on 13.1% of returns)
Here:
+$9,745
State:
+$22,201
(% of AGI for various income ranges: 10.4% for AGIs below $25k, 34.0% for AGIs $25k-50k, 52.4% for AGIs $50k-75k, 152.7% for AGIs $75k-100k, 463.5% for AGIs $100k-200k)
Profit/loss from business: +$16,421 (reported on 13.1% of returns)
Here:
+$16,421
State:
+$15,095
(% of AGI for various income ranges: 171.3% for AGIs below $25k, 85.1% for AGIs $25k-50k, 246.4% for AGIs $50k-75k, 383.2% for AGIs $75k-100k, 977.3% for AGIs $100k-200k)
Taxable individual retirement arrangement distribution: $13,541 (reported on 8.7% of returns)
04042:
$13,541
Maine:
$18,314
(% of AGI for various income ranges: 73.3% for AGIs below $25k, 92.8% for AGIs $25k-50k, 148.5% for AGIs $50k-75k, 196.8% for AGIs $75k-100k, 474.6% for AGIs $100k-200k)
Total itemized deductions: $22,219 (reported on 6.3% of returns)
Here:
$22,219
State:
$31,197
(% of AGI for various income ranges: 129.6% for AGIs $25k-50k, 230.9% for AGIs $50k-75k, 301.4% for AGIs $75k-100k, 555.0% for AGIs $100k-200k)
Charity contributions: $3,033 (reported on 3.6% of returns)
Here:
$3,033
State:
$9,863
(% of AGI for various income ranges: 22.4% for AGIs $50k-75k, 76.5% for AGIs $100k-200k)
Taxes paid: $7,369 (reported on 6.3% of returns)
04042:
$7,369
State:
$8,241
(% of AGI for various income ranges: 29.6% for AGIs $25k-50k, 81.2% for AGIs $50k-75k, 106.4% for AGIs $75k-100k, 200.0% for AGIs $100k-200k)
Earned income credit: $1,886 (reported on 11.1% of returns)
Here:
$1,886
State:
$1,960
(% of AGI for various income ranges: 62.7% for AGIs below $25k, 46.4% for AGIs $25k-50k)
Percentage of individuals using paid preparers for their 2020 taxes: 93.7%
Here:
94%
State:
92%
(% for various income ranges: 90.6% for AGIs below $25k, 92.5% for AGIs $25k-50k, 93.2% for AGIs $50k-75k, 96.8% for AGIs $75k-100k, 97.5% for AGIs $100k-200k, 100.0% for AGIs over 200k)
Averages for the 2012 tax year for zip code 04042, filed in 2013:
Average Adjusted Gross Income (AGI) in 2012: $50,400 (Individual Income Tax Returns)
Here:
$50,400
State:
$52,375
Salary/wage: $47,485 (reported on 88.2% of returns)
Here:
$47,485
State:
$43,415
(% of AGI for various income ranges: 76.9% for AGIs below $25k, 82.9% for AGIs $25k-50k, 83.7% for AGIs $50k-75k, 86.3% for AGIs $75k-100k, 84.3% for AGIs $100k-200k, 75.1% for AGIs over 200k)
Taxable interest for individuals: $880 (reported on 31.3% of returns)
This zip code:
$880
Maine:
$1,221
(% of AGI for various income ranges: 0.8% for AGIs below $25k, 0.6% for AGIs $25k-50k, 0.5% for AGIs $50k-75k, 0.5% for AGIs $75k-100k, 0.7% for AGIs $100k-200k)
Ordinary dividends: $2,428 (reported on 15.2% of returns)
Here:
$2,428
State:
$5,812
(% of AGI for various income ranges: 1.0% for AGIs below $25k, 0.4% for AGIs $25k-50k, 0.4% for AGIs $50k-75k, 0.6% for AGIs $75k-100k, 1.4% for AGIs $100k-200k)
Net capital gain/loss in AGI: +$3,418 (reported on 10.4% of returns)
Here:
+$3,418
State:
+$11,897
(% of AGI for various income ranges: 0.1% for AGIs $25k-50k, 0.4% for AGIs $50k-75k, 0.5% for AGIs $75k-100k, 2.0% for AGIs $100k-200k)
Profit/loss from business: +$7,017 (reported on 14.2% of returns)
Here:
+$7,017
State:
+$12,144
(% of AGI for various income ranges: 6.4% for AGIs below $25k, 3.2% for AGIs $25k-50k, 1.9% for AGIs $50k-75k, 0.9% for AGIs $75k-100k, 0.9% for AGIs $100k-200k)
Taxable individual retirement arrangement distribution: $10,958 (reported on 9.0% of returns)
04042:
$10,958
Maine:
$13,385
(% of AGI for various income ranges: 2.8% for AGIs below $25k, 2.4% for AGIs $25k-50k, 3.4% for AGIs $50k-75k, 1.9% for AGIs $100k-200k)
Total itemized deductions: $17,949 (22% of AGI, reported on 36.5% of returns)
Here:
$17,949
State:
$21,859
Here:
21.7% of AGI
State:
20.9% of AGI
(% of AGI for various income ranges: 8.8% for AGIs below $25k, 9.8% for AGIs $25k-50k, 13.1% for AGIs $50k-75k, 13.8% for AGIs $75k-100k, 15.8% for AGIs $100k-200k, 14.2% for AGIs over 200k)
Charity contributions: $1,593 (reported on 26.5% of returns)
Here:
$1,593
State:
$2,741
(% of AGI for various income ranges: 0.4% for AGIs below $25k, 0.4% for AGIs $25k-50k, 0.8% for AGIs $50k-75k, 0.8% for AGIs $75k-100k, 1.6% for AGIs $100k-200k)
Taxes paid: $7,435 (reported on 36.5% of returns)
04042:
$7,435
State:
$9,996
(% of AGI for various income ranges: 1.8% for AGIs below $25k, 3.1% for AGIs $25k-50k, 4.6% for AGIs $50k-75k, 5.7% for AGIs $75k-100k, 7.9% for AGIs $100k-200k, 8.5% for AGIs over 200k)
Earned income credit: $1,991 (reported on 15.2% of returns)
Here:
$1,991
State:
$1,959
(% of AGI for various income ranges: 4.8% for AGIs below $25k, 1.0% for AGIs $25k-50k)
Percentage of individuals using paid preparers for their 2012 taxes: 43.6%
Here:
44%
State:
48%
(% for various income ranges: 34.3% for AGIs below $25k, 42.9% for AGIs $25k-50k, 48.7% for AGIs $50k-75k, 50.0% for AGIs $75k-100k, 63.6% for AGIs $100k-200k)
Averages for the 2004 tax year for zip code 04042, filed in 2005:
Average Adjusted Gross Income (AGI) in 2004: $44,019 (Individual Income Tax Returns)
Here:
$44,019
State:
$42,606
Salary/wage: $39,734 (reported on 90.3% of returns)
Here:
$39,734
State:
$36,376
(% of AGI for various income ranges: 98.9% for AGIs below $10k, 79.2% for AGIs $10k-25k, 85.2% for AGIs $25k-50k, 89.4% for AGIs $50k-75k, 88.8% for AGIs $75k-100k, 61.4% for AGIs over 100k)
Taxable interest for individuals: $755 (reported on 47.1% of returns)
This zip code:
$755
Maine:
$1,367
(% of AGI for various income ranges: 1.7% for AGIs below $10k, 2.3% for AGIs $10k-25k, 0.6% for AGIs $25k-50k, 0.6% for AGIs $50k-75k, 0.5% for AGIs $75k-100k, 0.9% for AGIs over 100k)
Taxable dividends: $1,451 (reported on 18.9% of returns)
Here:
$1,451
State:
$3,533
(% of AGI for various income ranges: 3.1% for AGIs below $10k, 0.8% for AGIs $10k-25k, 0.3% for AGIs $25k-50k, 0.6% for AGIs $50k-75k, 0.5% for AGIs $75k-100k, 0.9% for AGIs over 100k)
Net capital gain/loss: +$6,696 (reported on 14.1% of returns)
Here:
+$6,696
State:
+$11,433
(% of AGI for various income ranges: -1.1% for AGIs below $10k, 0.4% for AGIs $10k-25k, 1.1% for AGIs $25k-50k, 0.6% for AGIs $50k-75k, 1.2% for AGIs $75k-100k, 6.8% for AGIs over 100k)
Profit/loss from business: +$7,520 (reported on 16.6% of returns)
Here:
+$7,520
State:
+$10,755
(% of AGI for various income ranges: 12.5% for AGIs below $10k, 6.0% for AGIs $10k-25k, 4.3% for AGIs $25k-50k, 2.3% for AGIs $50k-75k, 1.5% for AGIs $75k-100k, 1.3% for AGIs over 100k)
IRA payment deduction: $2,735 (reported on 3.5% of returns)
04042:
$2,735
Maine:
$3,014
(% of AGI for various income ranges: 0.4% for AGIs $10k-25k, 0.4% for AGIs $25k-50k, 0.2% for AGIs $50k-75k, 0.3% for AGIs $75k-100k)
Total itemized deductions: $16,126 (22% of AGI, reported on 38.8% of returns)
Here:
$16,126
State:
$18,231
Here:
22.1% of AGI
State:
21.7% of AGI
(% of AGI for various income ranges: 7.3% for AGIs below $10k, 7.2% for AGIs $10k-25k, 12.9% for AGIs $25k-50k, 15.1% for AGIs $50k-75k, 18.0% for AGIs $75k-100k, 14.4% for AGIs over 100k)
Charity contributions deductions: $1,515 (2% of AGI, reported on 32.8% of returns)
Here:
$1,515
State:
$2,466
Here:
2.1% of AGI
State:
2.8% of AGI
(% of AGI for various income ranges: 0.6% for AGIs $10k-25k, 0.9% for AGIs $25k-50k, 1.2% for AGIs $50k-75k, 1.3% for AGIs $75k-100k, 1.4% for AGIs over 100k)
Total tax: $5,266 (reported on 80.8% of returns)
04042:
$5,266
State:
$6,047
(% of AGI for various income ranges: 3.3% for AGIs below $10k, 5.0% for AGIs $10k-25k, 7.0% for AGIs $25k-50k, 8.4% for AGIs $50k-75k, 9.9% for AGIs $75k-100k, 16.0% for AGIs over 100k)
Earned income credit: $1,449 (reported on 11.5% of returns)
Here:
$1,449
State:
$1,520
Percentage of individuals using paid preparers for their 2004 taxes: 48.8%
Here:
49%
State:
53%
(% for various income ranges: 38.9% for AGIs below $10k, 42.6% for AGIs $10k-25k, 53.9% for AGIs $25k-50k, 53.4% for AGIs $50k-75k, 48.2% for AGIs $75k-100k, 62.7% for AGIs over 100k)
Likely homosexual households (counted as self-reported same-sex unmarried-partner households)
Lesbian couples: 0.6% of all households
Gay men: 0.0% of all households
Household received Food Stamps/SNAP in the past 12 months: 130 Household did not receive Food Stamps/SNAP in the past 12 months: 1,822
Women who had a birth in the past 12 months: 14 (14 now married, 0 unmarried) Women who did not have a birth in the past 12 months: 874 (361 now married, 512 unmarried)
Housing units in zip code 04042 with a mortgage: 1,075 (157 second mortgage, 139 both second mortgage and home equity loan) Houses without a mortgage: 101
Median monthly owner costs for units with a mortgage: $1,694 Median monthly owner costs for units without a mortgage: $589
Residents with income below the poverty level in 2022:
This zip code:
5.4%
Whole state:
10.8%
Residents with income below 50% of the poverty level in 2022:
This zip code:
4.2%
Whole state:
5.8%
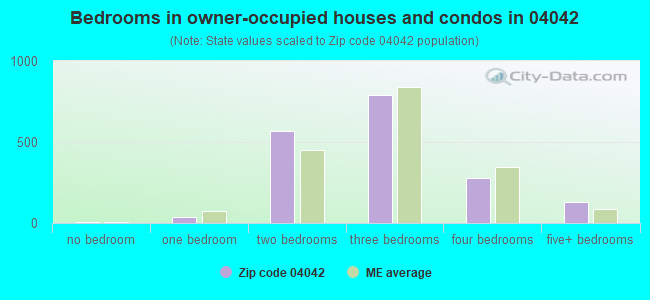
Median number of rooms in houses and condos:
Here:
5.8
State:
6.1
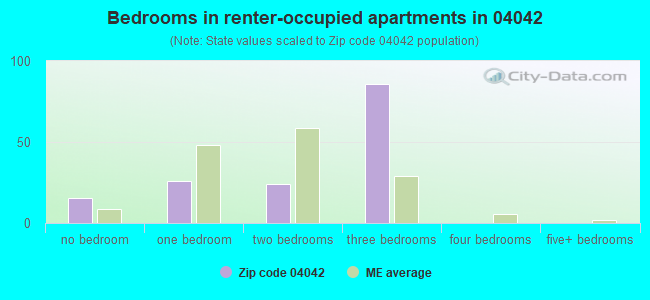
Median number of rooms in apartments:
Here:
3.6
State:
4.0
Notable locations in this zip code not listed on our city pages
Notable locations in zip code 04042: Salmon Falls Resort Golf Course (A), Hollis Fire Department Station 2 (B), Drug Rehabilitation Incorporated Day One Residence (C), Hollis Fire Department and Rescue Station 1 (D). Display/hide their locations on the map
Churches in zip code 04042 include: Pleasant Hill Church (A), Pleasant Hill Baptist Church (B), Bear Hill Church (C), Hollis Center Baptist Church (D). Display/hide their locations on the map
In group quarters: 7 (-1 institutionalized population)
Size of family households: 767 2-persons, 281 3-persons, 197 4-persons, 102 5-persons, 67 6-persons, 8 7-or-more-persons
Size of nonfamily households: 318 1-person, 191 2-persons, 21 3-persons
523 married couples with children.
167 single-parent households (101 men, 66 women).
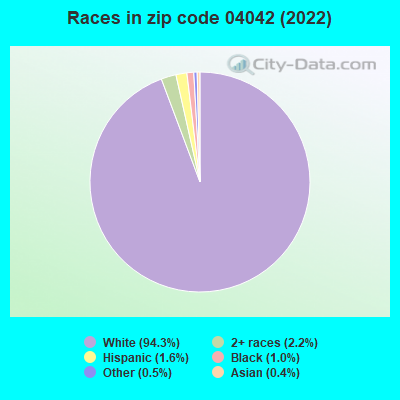
97.9% of residents of 04042 zip code speak English at home.
0.2% of residents speak Spanish at home (100% very well).
1.0% of residents speak other Indo-European language at home (100% very well).
0.5% of residents speak Asian or Pacific Island language at home (100% very well).
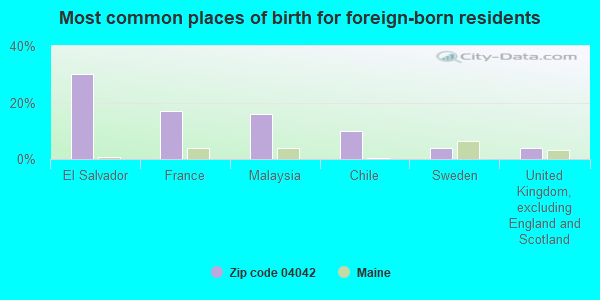
Foreign born population: 108 (2.3%) (77.8% of them are naturalized citizens)
This zip code:
2.3%
Whole state:
4.1%
30%El Salvador
17%France
16%Malaysia
10%Chile
4%Sweden
4%United Kingdom, excluding England and Scotland
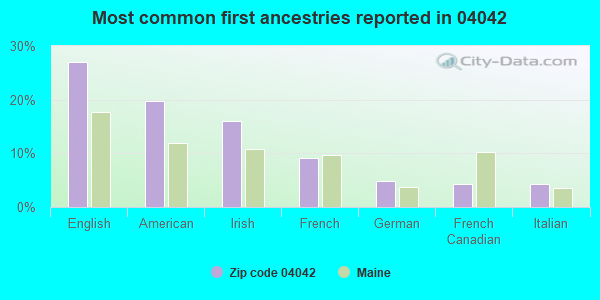
27%English
20%American
16%Irish
9%French
5%German
4%French Canadian
4%Italian
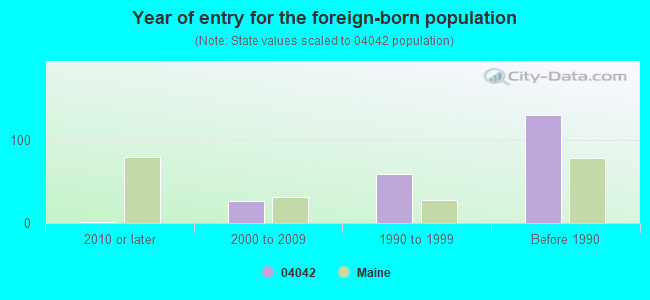
Year of entry for the foreign-born population
12010 or later
262000 to 2009
591990 to 1999
130Before 1990
Facilities with environmental interests located in this zip code:
HOLLIS ELEMENTARY SCHOOL (554 RIVER ROAD in HOLLIS CENTER, ME)
(Geographic Names Information System) (National Center for Education Statistics) - STATE ID-20302 (National Center for Education Statistics) - STATE ID-20301 Organizations: MSAD 06 BUXTON (SCHOOL DISTRICT)
Alternative names: HOLLIS CONSOLIDATED SCHOOL
GREAT SPRING WATERS OF AMER (400 KILLICK POND ROAD in HOLLIS CENTER, ME)
AIR MINOR (AIRS/AFS) STATE MASTER (Pennsylvania database) - PWSID-9996491, DRINKING WATER PROGRAM Alternative names: POLAND SPRING BOTTLING COMPANY
FPL ENERGY BAR MILLS HYDRO STATION (CANAL RD in HOLLIS, ME)
National Pollutant Discharge Elimination System NON-MAJOR (Tracking pollutant discharge elimination systems) - permit Business SIC classification: ELECTRIC SERVICES Organizations: PAUL WILLOUGHBY (CONTACT/OPERATOR)
, FPL ENERGY MAINE HYDRO BAR MIL (CONTACT/OWNER)
Alternative names: FPL ENERGY BAR MILLS STATION
DAYTON, TOWN OF (MUNICIPAL BLDG, RR2 in HOLLIS CENTER, ME)
AIR MINOR (AIRS/AFS) Business SIC classification: NONCLASSIFIABLE ESTABLISHMENTS
MAURICE S. COHEN (ROUTE 35 in HOLLIS CENTER, ME)
AIR MINOR (AIRS/AFS) Business SIC classification: CONCRETE PRODUCTS, EXCEPT BLOCK AND BRICK
N.E. GEN. CONTRACTORS INCORPORATED (HOLLIS in HOLLIS CENTER, ME)
AIR MINOR (AIRS/AFS) Business SIC classification: GENERAL CONTRACTORS-RESIDENTIAL BUILDINGS, OTHER THAN SINGLE-FAMILY
MID CAPE RESTORATION (335 CAPE ROAD in HOLLIS CENTER, ME)
Small Quantity Generators, between 100 kg and 1000 kg of hazardous waste/month (Resource Conservation and Recovery Act (tracking hazardous waste)) - notification Organizations: LLOYD BRADBURY (CONTACT/OWNER)
Housing units lacking complete plumbing facilities: 4.1% Housing units lacking complete kitchen facilities: 4.3%
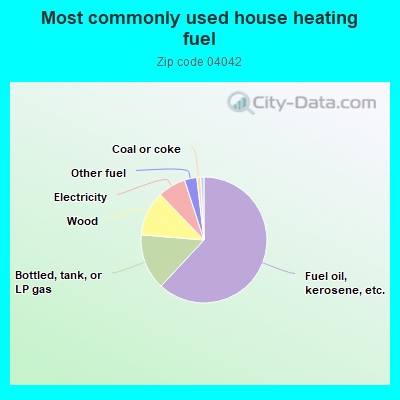
62.0%Fuel oil, kerosene, etc.
14.4%Bottled, tank, or LP gas
11.5%Wood
7.2%Electricity
3.2%Other fuel
1.0%Coal or coke
0.8%No fuel used
Population in 1990: 2,243. Population change in the 1990s: +1,916 (+85.4%).
Place of birth for U.S.-born residents:
This state: 3,319
Northeast: 754
Midwest: 174
South: 183
West: 117
59% of the 04042 zip code residents lived in the same house 5 years ago. Out of people who lived in different houses, 55% lived in this county. Out of people who lived in different counties, 50% lived in Maine.
97% of the 04042 zip code residents lived in the same house 1 year ago. Out of people who lived in different houses, 16% moved from this county. Out of people who lived in different houses, 56% moved from different county within same state. Out of people who lived in different houses, 70% moved from different state.
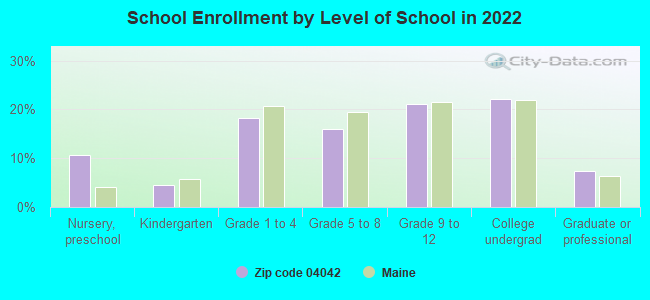
Private vs. public school enrollment:
Students in private schools in grades 1 to 8 (elementary and middle school): 39
Here:
12.6%
Maine:
12.7%
Students in private schools in grades 9 to 12 (high school):
Here:
0.0%
Maine:
12.6%
Students in private undergraduate colleges: 50
Here:
25.2%
Maine:
34.5%
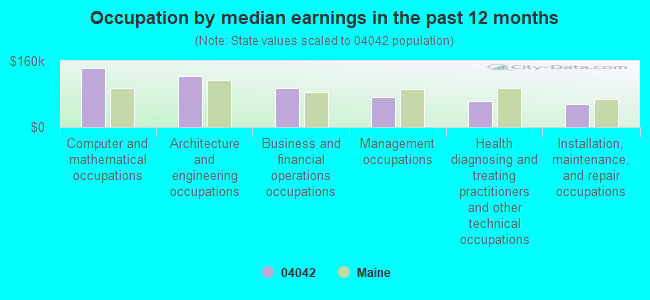
Occupation by median earnings in the past 12 months ($)
142,857Computer and mathematical occupations
123,802Architecture and engineering occupations
93,487Business and financial operations occupations
71,988Management occupations
61,827Health diagnosing and treating practitioners and other technical occupations
55,494Installation, maintenance, and repair occupations
Top industries in this zip code by the number of employees in 2005:
Health Care and Social Assistance: Child Day Care Services (10-19 employees: 1 establishment, 1-4 employees: 2 establishments)
Health Care and Social Assistance: Residential Mental Health and Substance Abuse Facilities (10-19: 1)
People in group quarters in 2010:
11 people in residential treatment centers for juveniles (non-correctional)
People in group quarters in 2000:
6 people in homes or halfway houses for drug/alcohol abuse
Fatal accident statistics in 2014:
Fatal accident count: 1
Vehicles involved in fatal accidents: 2
Fatal accidents caused by drunken drivers: 0
Fatalities: 2
Persons involved in fatal accidents: 5
Pedestrians involved in fatal accidents: 0
Fatal accident statistics in 2012:
Fatal accident count: 1
Vehicles involved in fatal accidents: 2
Fatal accidents caused by drunken drivers: 0
Fatalities: 1
Persons involved in fatal accidents: 1
Pedestrians involved in fatal accidents: 0
Home Mortgage Disclosure Act Aggregated Statistics For Year 2009 (Based on 4 partial tracts)
A) FHA, FSA/RHS & VA Home Purchase Loans
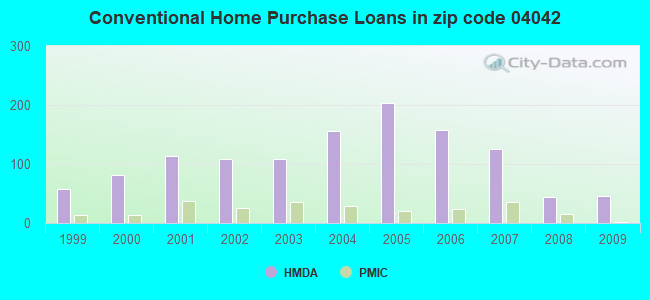
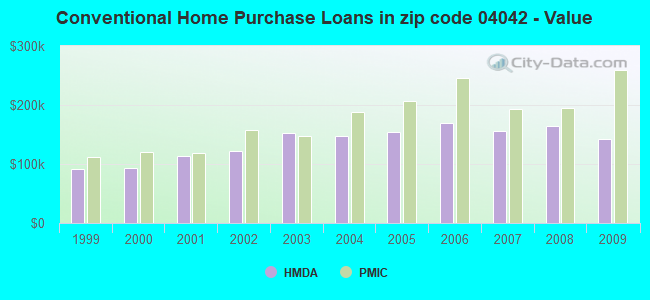
B) Conventional Home Purchase Loans
C) Refinancings
D) Home Improvement Loans
E) Loans on Dwellings For 5+ Families
F) Non-occupant Loans on < 5 Family Dwellings (A B C & D)
G) Loans On Manufactured Home Dwelling (A B C & D)
Number
Average Value
Number
Average Value
Number
Average Value
Number
Average Value
Number
Average Value
Number
Average Value
Number
Average Value
LOANS ORIGINATED
54
$187,559
46
$142,607
263
$158,597
44
$70,243
0
$0
12
$125,839
10
$46,856
APPLICATIONS APPROVED, NOT ACCEPTED
4
$205,105
5
$169,896
40
$175,046
2
$92,060
0
$0
1
$184,780
0
$0
APPLICATIONS DENIED
13
$175,335
22
$129,398
105
$191,319
12
$130,342
2
$1,680,000
6
$135,035
13
$52,931
APPLICATIONS WITHDRAWN
8
$173,280
6
$189,840
51
$190,298
1
$53,830
0
$0
0
$0
1
$162,010
FILES CLOSED FOR INCOMPLETENESS
2
$202,440
2
$154,560
8
$204,339
0
$0
0
$0
2
$170,630
0
$0
Aggregated Statistics For Year 2008 (Based on 4 partial tracts)
A) FHA, FSA/RHS & VA Home Purchase Loans
B) Conventional Home Purchase Loans
C) Refinancings
D) Home Improvement Loans
F) Non-occupant Loans on < 5 Family Dwellings (A B C & D)
G) Loans On Manufactured Home Dwelling (A B C & D)
Number
Average Value
Number
Average Value
Number
Average Value
Number
Average Value
Number
Average Value
Number
Average Value
LOANS ORIGINATED
22
$192,795
44
$165,249
157
$171,260
60
$62,680
9
$164,891
11
$70,696
APPLICATIONS APPROVED, NOT ACCEPTED
0
$0
6
$151,125
38
$167,090
2
$35,425
2
$177,415
4
$90,538
APPLICATIONS DENIED
4
$154,722
11
$162,063
125
$182,402
18
$38,851
3
$180,080
18
$80,361
APPLICATIONS WITHDRAWN
5
$256,564
1
$204,190
53
$211,005
2
$164,985
2
$118,530
0
$0
FILES CLOSED FOR INCOMPLETENESS
0
$0
1
$107,140
7
$172,314
0
$0
0
$0
0
$0
Aggregated Statistics For Year 2007 (Based on 4 partial tracts)
A) FHA, FSA/RHS & VA Home Purchase Loans
B) Conventional Home Purchase Loans
C) Refinancings
D) Home Improvement Loans
F) Non-occupant Loans on < 5 Family Dwellings (A B C & D)
G) Loans On Manufactured Home Dwelling (A B C & D)
Number
Average Value
Number
Average Value
Number
Average Value
Number
Average Value
Number
Average Value
Number
Average Value
LOANS ORIGINATED
14
$191,812
126
$155,475
215
$153,879
84
$60,151
14
$143,026
24
$87,966
APPLICATIONS APPROVED, NOT ACCEPTED
4
$198,355
17
$109,204
46
$181,834
5
$73,750
6
$109,442
7
$78,709
APPLICATIONS DENIED
0
$0
25
$157,828
129
$168,347
26
$88,985
5
$136,168
14
$66,113
APPLICATIONS WITHDRAWN
2
$171,360
1
$241,720
44
$159,958
6
$75,003
2
$92,690
2
$52,080
FILES CLOSED FOR INCOMPLETENESS
0
$0
0
$0
20
$201,644
1
$105,590
1
$97,570
1
$74,530
Aggregated Statistics For Year 2006 (Based on 4 partial tracts)
A) FHA, FSA/RHS & VA Home Purchase Loans
B) Conventional Home Purchase Loans
C) Refinancings
D) Home Improvement Loans
E) Loans on Dwellings For 5+ Families
F) Non-occupant Loans on < 5 Family Dwellings (A B C & D)
G) Loans On Manufactured Home Dwelling (A B C & D)
Number
Average Value
Number
Average Value
Number
Average Value
Number
Average Value
Number
Average Value
Number
Average Value
Number
Average Value
LOANS ORIGINATED
20
$203,984
158
$168,984
309
$143,359
102
$57,657
9
$287,969
23
$136,698
32
$70,713
APPLICATIONS APPROVED, NOT ACCEPTED
0
$0
32
$120,783
44
$146,942
6
$32,518
0
$0
9
$101,546
6
$57,738
APPLICATIONS DENIED
7
$224,353
43
$115,607
242
$158,406
43
$81,641
0
$0
9
$106,310
22
$79,034
APPLICATIONS WITHDRAWN
2
$94,920
11
$133,448
115
$130,983
13
$151,195
0
$0
1
$70,390
4
$62,035
FILES CLOSED FOR INCOMPLETENESS
0
$0
4
$107,098
48
$176,585
2
$21,000
0
$0
0
$0
0
$0
Aggregated Statistics For Year 2005 (Based on 4 partial tracts)
A) FHA, FSA/RHS & VA Home Purchase Loans
B) Conventional Home Purchase Loans
C) Refinancings
D) Home Improvement Loans
F) Non-occupant Loans on < 5 Family Dwellings (A B C & D)
G) Loans On Manufactured Home Dwelling (A B C & D)
Number
Average Value
Number
Average Value
Number
Average Value
Number
Average Value
Number
Average Value
Number
Average Value
LOANS ORIGINATED
7
$188,140
204
$154,796
386
$152,009
97
$62,777
23
$136,427
25
$72,928
APPLICATIONS APPROVED, NOT ACCEPTED
2
$150,360
27
$125,286
78
$146,774
7
$130,583
2
$58,840
10
$80,840
APPLICATIONS DENIED
0
$0
42
$153,571
164
$151,406
52
$46,615
10
$132,777
20
$83,338
APPLICATIONS WITHDRAWN
2
$157,320
15
$173,389
152
$160,722
10
$101,477
5
$213,448
7
$148,864
FILES CLOSED FOR INCOMPLETENESS
0
$0
9
$128,936
57
$172,874
2
$170,520
2
$126,000
2
$14,280
Aggregated Statistics For Year 2004 (Based on 4 partial tracts)
A) FHA, FSA/RHS & VA Home Purchase Loans
B) Conventional Home Purchase Loans
C) Refinancings
D) Home Improvement Loans
F) Non-occupant Loans on < 5 Family Dwellings (A B C & D)
G) Loans On Manufactured Home Dwelling (A B C & D)
Number
Average Value
Number
Average Value
Number
Average Value
Number
Average Value
Number
Average Value
Number
Average Value
LOANS ORIGINATED
9
$182,532
156
$146,814
367
$138,091
86
$63,312
23
$139,829
27
$77,419
APPLICATIONS APPROVED, NOT ACCEPTED
0
$0
11
$171,861
46
$116,179
7
$67,647
2
$67,200
1
$88,510
APPLICATIONS DENIED
4
$139,675
44
$122,143
173
$137,916
43
$61,147
6
$197,202
23
$59,971
APPLICATIONS WITHDRAWN
0
$0
15
$140,098
155
$134,321
15
$90,467
9
$145,472
8
$102,905
FILES CLOSED FOR INCOMPLETENESS
0
$0
2
$59,745
23
$148,759
2
$58,525
0
$0
0
$0
Aggregated Statistics For Year 2003 (Based on 2 partial tracts)
A) FHA, FSA/RHS & VA Home Purchase Loans
B) Conventional Home Purchase Loans
C) Refinancings
D) Home Improvement Loans
E) Loans on Dwellings For 5+ Families
F) Non-occupant Loans on < 5 Family Dwellings (A B C & D)
Number
Average Value
Number
Average Value
Number
Average Value
Number
Average Value
Number
Average Value
Number
Average Value
LOANS ORIGINATED
5
$162,624
109
$151,955
534
$119,409
45
$31,099
7
$372,480
25
$117,398
APPLICATIONS APPROVED, NOT ACCEPTED
3
$163,520
20
$123,732
74
$116,692
8
$13,020
0
$0
0
$0
APPLICATIONS DENIED
0
$0
29
$102,190
102
$112,198
10
$31,920
0
$0
0
$0
APPLICATIONS WITHDRAWN
5
$143,808
20
$141,288
124
$120,391
7
$21,840
0
$0
0
$0
FILES CLOSED FOR INCOMPLETENESS
2
$114,240
3
$192,080
10
$130,536
2
$26,880
0
$0
0
$0
Aggregated Statistics For Year 2002 (Based on 2 partial tracts)
A) FHA, FSA/RHS & VA Home Purchase Loans
B) Conventional Home Purchase Loans
C) Refinancings
D) Home Improvement Loans
F) Non-occupant Loans on < 5 Family Dwellings (A B C & D)
Number
Average Value
Number
Average Value
Number
Average Value
Number
Average Value
Number
Average Value
LOANS ORIGINATED
37
$136,125
108
$121,536
299
$110,431
29
$17,727
12
$99,400
APPLICATIONS APPROVED, NOT ACCEPTED
0
$0
10
$72,576
40
$100,128
10
$18,144
0
$0
APPLICATIONS DENIED
3
$178,080
29
$97,092
104
$102,868
12
$16,520
3
$55,440
APPLICATIONS WITHDRAWN
2
$119,280
17
$168,791
99
$106,875
7
$20,400
3
$165,760
FILES CLOSED FOR INCOMPLETENESS
0
$0
2
$96,600
5
$98,448
0
$0
0
$0
Aggregated Statistics For Year 2001 (Based on 2 partial tracts)
A) FHA, FSA/RHS & VA Home Purchase Loans
B) Conventional Home Purchase Loans
C) Refinancings
D) Home Improvement Loans
E) Loans on Dwellings For 5+ Families
F) Non-occupant Loans on < 5 Family Dwellings (A B C & D)
Number
Average Value
Number
Average Value
Number
Average Value
Number
Average Value
Number
Average Value
Number
Average Value
LOANS ORIGINATED
32
$116,812
113
$114,166
183
$98,542
25
$27,619
2
$210,000
8
$112,560
APPLICATIONS APPROVED, NOT ACCEPTED
0
$0
5
$104,496
37
$84,409
13
$21,840
0
$0
0
$0
APPLICATIONS DENIED
0
$0
25
$60,010
69
$82,052
29
$19,175
0
$0
2
$75,600
APPLICATIONS WITHDRAWN
2
$109,200
7
$87,360
47
$107,020
7
$17,040
0
$0
2
$33,600
FILES CLOSED FOR INCOMPLETENESS
0
$0
0
$0
8
$85,680
0
$0
0
$0
0
$0
Aggregated Statistics For Year 2000 (Based on 2 partial tracts)
A) FHA, FSA/RHS & VA Home Purchase Loans
B) Conventional Home Purchase Loans
C) Refinancings
D) Home Improvement Loans
F) Non-occupant Loans on < 5 Family Dwellings (A B C & D)
Number
Average Value
Number
Average Value
Number
Average Value
Number
Average Value
Number
Average Value
LOANS ORIGINATED
29
$103,697
82
$92,461
59
$82,946
35
$17,760
7
$46,320
APPLICATIONS APPROVED, NOT ACCEPTED
3
$124,880
10
$118,440
15
$73,696
20
$22,176
0
$0
APPLICATIONS DENIED
0
$0
27
$53,138
71
$79,386
32
$25,515
8
$85,050
APPLICATIONS WITHDRAWN
2
$35,280
3
$71,680
37
$49,129
7
$27,600
0
$0
FILES CLOSED FOR INCOMPLETENESS
0
$0
2
$162,120
10
$106,344
0
$0
0
$0
Aggregated Statistics For Year 1999 (Based on 1 partial tract)
A) FHA, FSA/RHS & VA Home Purchase Loans
B) Conventional Home Purchase Loans
C) Refinancings
D) Home Improvement Loans
F) Non-occupant Loans on < 5 Family Dwellings (A B C & D)
Detailed PMIC statistics for the following Tracts:0210.00
, 0245.00
2004 - 2018 National Fire Incident Reporting System (NFIRS) incidents
Based on the data from the years 2004 - 2018 the average number of fire incidents per year is 14. The highest number of reported fires - 32 took place in 2010, and the least - 0 in 2011. The data has an increasing trend.
When looking into fire subcategories, the most reports belonged to: Structure Fires (49.3%), and Outside Fires (42.3%).
Fire incident types reported to NFIRS in Zip Code 04042


 Nearest zip codes: 04093, 04030, 04061, 04084, 04085, 04087.
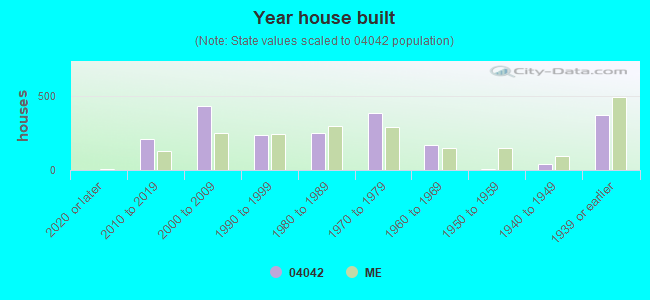


 Based on the data from the years 2004 - 2018 the average number of fire incidents per year is 14. The highest number of reported fires - 32 took place in 2010, and the least - 0 in 2011. The data has an increasing trend.
 When looking into fire subcategories, the most reports belonged to: Structure Fires (49.3%), and Outside Fires (42.3%).