Estimated zip code population in 2022: 5,562 Zip code population in 2010: 5,093 Zip code population in 2000: 4,391
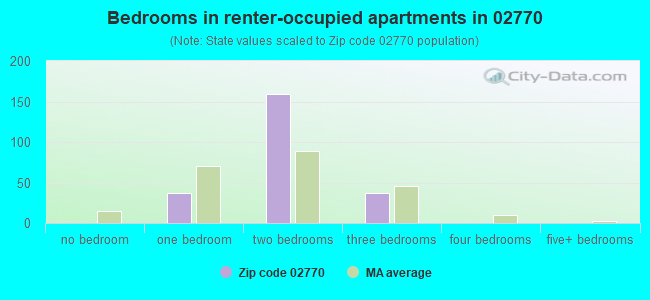
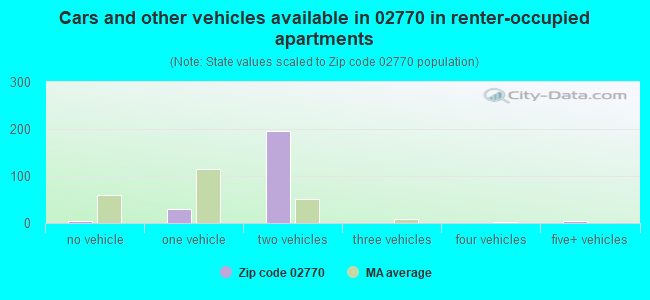
Houses and condos: 2,126 Renter-occupied apartments: 233
% of renters here:
11%
State:
38%
March 2022 cost of living index in zip code 02770: 114.4 (more than average, U.S. average is 100)
Land area: 32.2 sq. mi. Water area: 2.4 sq. mi.
Population density: 173 people per square mile
(very low).
OSM Map
Google Map
MSN Map
OSM Map
General Map
Google Map
MSN Map
OSM Map
Google Map
MSN Map
OSM Map
Google Map
MSN Map
Please wait while loading the map...
Real estate property taxes paid for housing units in 2022:
This zip code:
1.1% ($6,123)
Massachusetts:
1.0% ($5,536)
Median real estate property taxes paid for housing units with mortgages in 2022: $6,228 (1.1%) Median real estate property taxes paid for housing units with no mortgage in 2022: $5,753 (1.1%)
Business Search- 14 Million verified businesses
Males: 2,703
(48.6%)
Females: 2,859
(51.4%)
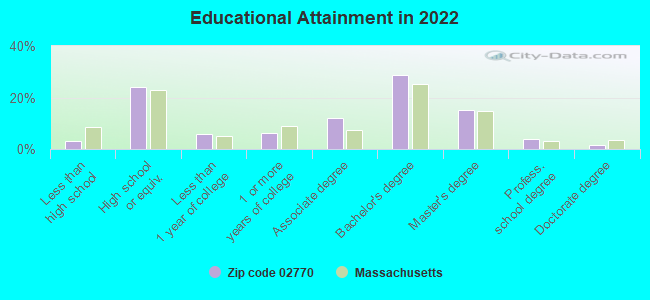
For population 25 years and over in 02770:
High school or higher: 97.0%
Bachelor's degree or higher: 49.1%
Graduate or professional degree: 20.3%
Unemployed: 3.0%
Mean travel time to work (commute): 30.5 minutes
For population 15 years and over in 02770:
Never married: 31.5%
Now married: 55.7%
Separated: 0.7%
Widowed: 5.5%
Divorced: 6.6%
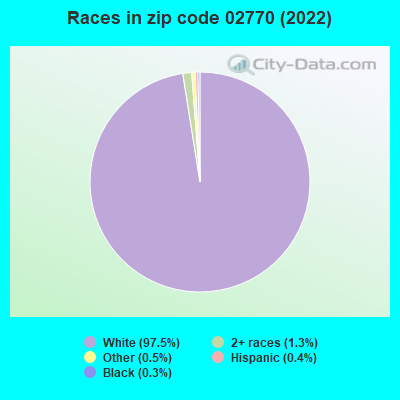
Zip code 02770 compared to state average:
Black race population percentage significantly below state average.
Hispanic race population percentage significantly below state average.
Foreign-born population percentage significantly below state average.
Renting percentage significantly below state average.
Length of stay since moving in significantly above state average.
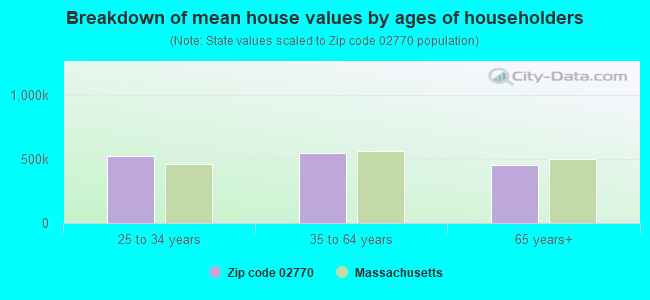
Estimated median house/condo value in 2022: $537,020
02770:
$537,020
Massachusetts:
$534,700
Median resident age:
This zip code:
43.5 years
Massachusetts median age:
40.3 years
Average household size:
This zip code:
2.6 people
Massachusetts:
2.4 people
Averages for the 2020 tax year for zip code 02770, filed in 2021:
Average Adjusted Gross Income (AGI) in 2020: $101,147 (Individual Income Tax Returns)
Here:
$101,147
State:
$105,130
Salary/wage: $86,924 (reported on 80.5% of returns)
Here:
$86,924
State:
$82,951
(% of AGI for various income ranges: 1250.5% for AGIs below $25k, 3368.9% for AGIs $25k-50k, 6532.9% for AGIs $50k-75k, 8247.8% for AGIs $75k-100k, 18096.8% for AGIs $100k-200k, 70003.3% for AGIs over 200k)
Taxable interest for individuals: $1,366 (reported on 44.5% of returns)
This zip code:
$1,366
Massachusetts:
$2,361
(% of AGI for various income ranges: 28.4% for AGIs below $25k, 24.0% for AGIs $25k-50k, 59.6% for AGIs $50k-75k, 109.6% for AGIs $75k-100k, 128.6% for AGIs $100k-200k, 585.0% for AGIs over 200k)
Ordinary dividends: $6,052 (reported on 27.3% of returns)
Here:
$6,052
State:
$10,365
(% of AGI for various income ranges: 54.8% for AGIs below $25k, 66.9% for AGIs $25k-50k, 111.2% for AGIs $50k-75k, 213.0% for AGIs $75k-100k, 312.5% for AGIs $100k-200k, 2064.2% for AGIs over 200k)
Net capital gain/loss in AGI: +$18,675 (reported on 24.7% of returns)
Here:
+$18,675
State:
+$48,178
(% of AGI for various income ranges: 17.3% for AGIs below $25k, 42.9% for AGIs $25k-50k, 77.5% for AGIs $50k-75k, 248.3% for AGIs $75k-100k, 424.3% for AGIs $100k-200k, 9452.5% for AGIs over 200k)
Profit/loss from business: +$26,331 (reported on 17.5% of returns)
Here:
+$26,331
State:
+$20,792
(% of AGI for various income ranges: 137.7% for AGIs below $25k, 174.0% for AGIs $25k-50k, 652.9% for AGIs $50k-75k, 481.3% for AGIs $75k-100k, 673.2% for AGIs $100k-200k, 6140.0% for AGIs over 200k)
Taxable individual retirement arrangement distribution: $20,957 (reported on 11.4% of returns)
02770:
$20,957
Massachusetts:
$22,790
(% of AGI for various income ranges: 81.6% for AGIs below $25k, 170.9% for AGIs $25k-50k, 310.8% for AGIs $50k-75k, 460.0% for AGIs $75k-100k, 550.7% for AGIs $100k-200k, 1792.5% for AGIs over 200k)
Self-employed (Keogh) retirement plans: $25,733 (reported on 1.0% of returns)
02770:
$25,733
Massachusetts:
$26,868
(% of AGI for various income ranges: 175.5% for AGIs $100k-200k)
Total itemized deductions: $28,385 (reported on 14.9% of returns)
Here:
$28,385
State:
$36,722
(% of AGI for various income ranges: 374.9% for AGIs $25k-50k, 612.5% for AGIs $50k-75k, 985.2% for AGIs $75k-100k, 1004.8% for AGIs $100k-200k, 2990.0% for AGIs over 200k)
Charity contributions: $4,786 (reported on 11.4% of returns)
Here:
$4,786
State:
$12,529
(% of AGI for various income ranges: 11.6% for AGIs below $25k, 23.8% for AGIs $50k-75k, 60.9% for AGIs $75k-100k, 109.1% for AGIs $100k-200k, 789.2% for AGIs over 200k)
Taxes paid: $8,713 (reported on 14.9% of returns)
02770:
$8,713
State:
$8,782
(% of AGI for various income ranges: 84.9% for AGIs $25k-50k, 188.3% for AGIs $50k-75k, 282.2% for AGIs $75k-100k, 350.5% for AGIs $100k-200k, 890.0% for AGIs over 200k)
Earned income credit: $1,647 (reported on 5.5% of returns)
Here:
$1,647
State:
$1,909
(% of AGI for various income ranges: 31.4% for AGIs below $25k, 40.6% for AGIs $25k-50k)
Percentage of individuals using paid preparers for their 2020 taxes: 94.5%
Here:
94%
State:
92%
(% for various income ranges: 92.4% for AGIs below $25k, 95.9% for AGIs $25k-50k, 97.4% for AGIs $50k-75k, 93.9% for AGIs $75k-100k, 94.7% for AGIs $100k-200k, 93.9% for AGIs over 200k)
Averages for the 2012 tax year for zip code 02770, filed in 2013:
Average Adjusted Gross Income (AGI) in 2012: $80,269 (Individual Income Tax Returns)
Here:
$80,269
State:
$81,425
Salary/wage: $67,321 (reported on 83.6% of returns)
Here:
$67,321
State:
$64,752
(% of AGI for various income ranges: 72.0% for AGIs below $25k, 69.9% for AGIs $25k-50k, 73.0% for AGIs $50k-75k, 68.4% for AGIs $75k-100k, 77.8% for AGIs $100k-200k, 59.6% for AGIs over 200k)
Taxable interest for individuals: $1,233 (reported on 48.5% of returns)
This zip code:
$1,233
Massachusetts:
$2,136
(% of AGI for various income ranges: 1.3% for AGIs below $25k, 0.9% for AGIs $25k-50k, 0.6% for AGIs $50k-75k, 0.8% for AGIs $75k-100k, 0.6% for AGIs $100k-200k, 0.9% for AGIs over 200k)
Ordinary dividends: $4,318 (reported on 29.8% of returns)
Here:
$4,318
State:
$9,473
(% of AGI for various income ranges: 2.0% for AGIs below $25k, 1.0% for AGIs $25k-50k, 1.4% for AGIs $50k-75k, 1.2% for AGIs $75k-100k, 1.3% for AGIs $100k-200k, 2.3% for AGIs over 200k)
Net capital gain/loss in AGI: +$23,852 (reported on 20.6% of returns)
Here:
+$23,852
State:
+$31,437
(% of AGI for various income ranges: 0.7% for AGIs $75k-100k, 1.3% for AGIs $100k-200k, 20.2% for AGIs over 200k)
Profit/loss from business: +$18,848 (reported on 19.8% of returns)
Here:
+$18,848
State:
+$20,662
(% of AGI for various income ranges: 9.1% for AGIs below $25k, 7.6% for AGIs $25k-50k, 3.8% for AGIs $50k-75k, 5.2% for AGIs $75k-100k, 5.2% for AGIs $100k-200k, 2.5% for AGIs over 200k)
Taxable individual retirement arrangement distribution: $17,736 (reported on 10.7% of returns)
02770:
$17,736
Massachusetts:
$18,892
(% of AGI for various income ranges: 3.5% for AGIs below $25k, 3.8% for AGIs $25k-50k, 2.7% for AGIs $50k-75k, 2.9% for AGIs $75k-100k, 3.4% for AGIs $100k-200k)
Self-employment retirement plans: $16,500 (reported on 1.1% of returns)
02770:
$16,500
Massachusetts:
$20,669
Total itemized deductions: $24,266 (19% of AGI, reported on 51.1% of returns)
Here:
$24,266
State:
$28,907
Here:
19.3% of AGI
State:
18.2% of AGI
(% of AGI for various income ranges: 16.1% for AGIs below $25k, 14.4% for AGIs $25k-50k, 17.1% for AGIs $50k-75k, 16.4% for AGIs $75k-100k, 17.6% for AGIs $100k-200k, 11.8% for AGIs over 200k)
Charity contributions: $2,567 (reported on 42.0% of returns)
Here:
$2,567
State:
$4,208
(% of AGI for various income ranges: 0.7% for AGIs below $25k, 1.0% for AGIs $25k-50k, 0.9% for AGIs $50k-75k, 1.0% for AGIs $75k-100k, 1.4% for AGIs $100k-200k, 1.8% for AGIs over 200k)
Taxes paid: $11,090 (reported on 51.1% of returns)
02770:
$11,090
State:
$13,303
(% of AGI for various income ranges: 4.5% for AGIs below $25k, 5.0% for AGIs $25k-50k, 7.0% for AGIs $50k-75k, 7.4% for AGIs $75k-100k, 8.3% for AGIs $100k-200k, 6.3% for AGIs over 200k)
Earned income credit: $1,653 (reported on 7.3% of returns)
Here:
$1,653
State:
$1,971
(% of AGI for various income ranges: 2.5% for AGIs below $25k, 0.6% for AGIs $25k-50k)
Percentage of individuals using paid preparers for their 2012 taxes: 65.6%
Here:
66%
State:
56%
(% for various income ranges: 58.4% for AGIs below $25k, 63.0% for AGIs $25k-50k, 71.4% for AGIs $50k-75k, 69.7% for AGIs $75k-100k, 69.6% for AGIs $100k-200k, 73.3% for AGIs over 200k)
Averages for the 2004 tax year for zip code 02770, filed in 2005:
Average Adjusted Gross Income (AGI) in 2004: $63,678 (Individual Income Tax Returns)
Here:
$63,678
State:
$62,877
Salary/wage: $56,284 (reported on 86.2% of returns)
Here:
$56,284
State:
$52,969
(% of AGI for various income ranges: 115.7% for AGIs below $10k, 69.6% for AGIs $10k-25k, 78.9% for AGIs $25k-50k, 79.6% for AGIs $50k-75k, 84.2% for AGIs $75k-100k, 71.2% for AGIs over 100k)
Taxable interest for individuals: $1,450 (reported on 66.1% of returns)
This zip code:
$1,450
Massachusetts:
$1,945
(% of AGI for various income ranges: 5.2% for AGIs below $10k, 4.8% for AGIs $10k-25k, 1.1% for AGIs $25k-50k, 1.0% for AGIs $50k-75k, 0.6% for AGIs $75k-100k, 1.7% for AGIs over 100k)
Taxable dividends: $2,337 (reported on 32.7% of returns)
Here:
$2,337
State:
$5,323
(% of AGI for various income ranges: 4.0% for AGIs below $10k, 1.2% for AGIs $10k-25k, 1.0% for AGIs $25k-50k, 0.9% for AGIs $50k-75k, 0.7% for AGIs $75k-100k, 1.5% for AGIs over 100k)
Net capital gain/loss: +$13,080 (reported on 25.0% of returns)
Here:
+$13,080
State:
+$20,377
(% of AGI for various income ranges: -1.6% for AGIs below $10k, -0.5% for AGIs $10k-25k, -0.1% for AGIs $25k-50k, -0.2% for AGIs $50k-75k, 0.5% for AGIs $75k-100k, 10.5% for AGIs over 100k)
Profit/loss from business: +$15,911 (reported on 22.0% of returns)
Here:
+$15,911
State:
+$17,837
(% of AGI for various income ranges: 16.4% for AGIs below $10k, 13.1% for AGIs $10k-25k, 8.4% for AGIs $25k-50k, 7.2% for AGIs $50k-75k, 5.2% for AGIs $75k-100k, 3.5% for AGIs over 100k)
IRA payment deduction: $3,192 (reported on 4.4% of returns)
02770:
$3,192
Massachusetts:
$3,100
(% of AGI for various income ranges: 0.6% for AGIs $10k-25k, 0.5% for AGIs $25k-50k, 0.4% for AGIs $50k-75k, 0.1% for AGIs over 100k)
Self-employed pension: $9,318 (reported on 1.9% of returns)
Here:
$9,318
Massachusetts:
$14,516
Total itemized deductions: $20,078 (21% of AGI, reported on 51.6% of returns)
Here:
$20,078
State:
$22,573
Here:
20.6% of AGI
State:
19.5% of AGI
(% of AGI for various income ranges: 8.4% for AGIs below $10k, 15.8% for AGIs $10k-25k, 15.6% for AGIs $25k-50k, 19.2% for AGIs $50k-75k, 18.8% for AGIs $75k-100k, 14.6% for AGIs over 100k)
Charity contributions deductions: $2,135 (2% of AGI, reported on 48.4% of returns)
Here:
$2,135
State:
$3,295
Here:
2.1% of AGI
State:
2.7% of AGI
(% of AGI for various income ranges: 1.0% for AGIs $10k-25k, 1.3% for AGIs $25k-50k, 1.7% for AGIs $50k-75k, 1.6% for AGIs $75k-100k, 1.8% for AGIs over 100k)
Total tax: $9,507 (reported on 84.9% of returns)
02770:
$9,507
State:
$11,494
(% of AGI for various income ranges: 4.4% for AGIs below $10k, 5.8% for AGIs $10k-25k, 8.0% for AGIs $25k-50k, 8.9% for AGIs $50k-75k, 10.0% for AGIs $75k-100k, 16.7% for AGIs over 100k)
Earned income credit: $1,316 (reported on 5.7% of returns)
Here:
$1,316
State:
$1,518
Percentage of individuals using paid preparers for their 2004 taxes: 63.5%
Here:
64%
State:
58%
(% for various income ranges: 48.4% for AGIs below $10k, 59.3% for AGIs $10k-25k, 64.7% for AGIs $25k-50k, 71.3% for AGIs $50k-75k, 68.2% for AGIs $75k-100k, 69.5% for AGIs over 100k)
Household received Food Stamps/SNAP in the past 12 months: 121 Household did not receive Food Stamps/SNAP in the past 12 months: 1,947
Women who had a birth in the past 12 months: 60 (26 now married, 30 unmarried) Women who did not have a birth in the past 12 months: 1,184 (526 now married, 652 unmarried)
Housing units in zip code 02770 with a mortgage: 1,177 (238 second mortgage, 242 both second mortgage and home equity loan) Houses without a mortgage: 88
Median monthly owner costs for units with a mortgage: $2,312 Median monthly owner costs for units without a mortgage: $930
Residents with income below the poverty level in 2022:
This zip code:
3.2%
Whole state:
10.4%
Residents with income below 50% of the poverty level in 2022:
This zip code:
2.3%
Whole state:
5.1%
Median number of rooms in houses and condos:
Here:
6.9
State:
6.5
Median number of rooms in apartments:
Here:
5.9
State:
4.0
Notable locations in this zip code not listed on our city pages
Notable locations in zip code 02770: Rochester Golf Course (A), Rochester Fire Department Ambulance Service (B), Rochester Fire Department (C), Rochester Town Hall (D), Joseph H Plumb Memorial Library (E). Display/hide their locations on the map
Lakes, reservoirs, and swamps: Giffords Pond (A), Snows Pond (B), Snipatuit Pond (C), Harley Millpond (D), Leonards Pond (E), Mill Pond (F), Marys Pond (G), Long Pond (H). Display/hide their locations on the map
Streams, rivers, and creeks: Black Brook (A), Snipatuit Brook (B), West Branch Sippican River (C), Sherman Brook (D), Doggett Brook (E), Cedar Swamp Brook (F), East Branch Sippican River (G). Display/hide their locations on the map
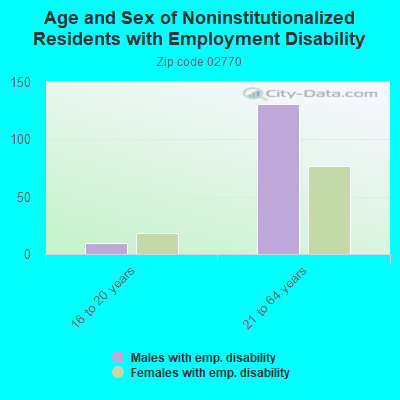
In group quarters: 6 (-1 institutionalized population)
Size of family households: 631 2-persons, 275 3-persons, 324 4-persons, 191 5-persons, 34 6-persons, 7 7-or-more-persons
Size of nonfamily households: 349 1-person, 294 2-persons
735 married couples with children.
269 single-parent households (269 women).
95.6% of residents of 02770 zip code speak English at home.
0.8% of residents speak Spanish at home (100% very well).
3.0% of residents speak other Indo-European language at home (71% very well, 29% well).
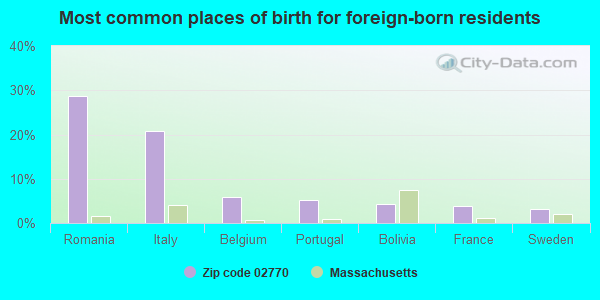
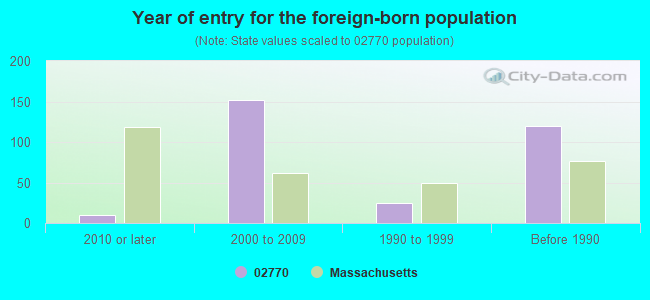
Foreign born population: 287 (5.2%) (90.5% of them are naturalized citizens)
This zip code:
5.2%
Whole state:
18.0%
29%Romania
21%Italy
6%Belgium
5%Portugal
4%Bolivia
4%France
3%Sweden
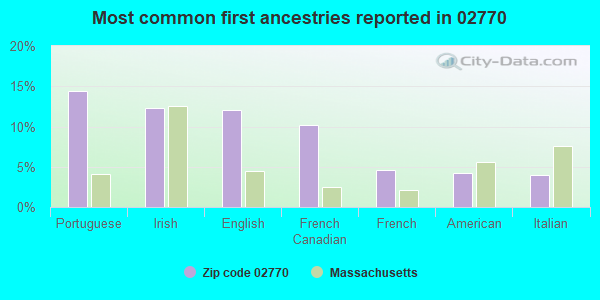
14%Portuguese
12%Irish
12%English
10%French Canadian
5%French
4%American
4%Italian
Year of entry for the foreign-born population
102010 or later
1522000 to 2009
251990 to 1999
120Before 1990
Facilities with environmental interests located in this zip code:
NEW ENGLAND TELE (NORTH AVE in ROCHESTER, MA)
(Resource Conservation and Recovery Act (tracking hazardous waste))
OLD COLONY REG VOC TECH (476 NORTH AVENUE in ROCHESTER, MA)
(National Center for Education Statistics) - STATE ID-855605
OFF CAPE CRANBERRY CORP (666 SPIPATUIT RD in ROCHESTER, MA)
(Integrated Compliance Information System) - ICIS-01-1989-0005, FORMAL ENFORCEMENT ACTION
ALGONQUIN GAS TRANSMISSION CO (RTE 28 in ROCHESTER, MA)
Small Quantity Generators, between 100 kg and 1000 kg of hazardous waste/month (Resource Conservation and Recovery Act (tracking hazardous waste)) - notification Organizations: DUKE ENERGY CORP (CONTACT/OPERATOR)
, ALGONQUIN GAS TRANSMISSION COMPANY (CONTACT/OWNER)
Alternative names: A G T VALVE #G83, AGT VALVE #G83, ALGONQUIN GAS TRANSMISSION CO #G83
ALGONQUIN GAS TRANSMISSION CO (BRALEY HILL RD in ROCHESTER, MA)
Small Quantity Generators, between 100 kg and 1000 kg of hazardous waste/month (Resource Conservation and Recovery Act (tracking hazardous waste)) - notification Organizations: DUKE ENERGY CORP (CONTACT/OPERATOR)
, ALGONQUIN GAS TRANSMISSION COMPANY (CONTACT/OWNER)
Alternative names: A G T VALVE #G82, AGT VALVE #G82, ALGONQUIN GAS TRANSMISSION CO VALVE #G82
E-Z BLEACH CORP (379 CUSHMAN RD in ROCHESTER, MA)
COMPLIANCE ACTIVITY (Tracking inspections of insecticide, fungicide, and rodenticide, and toxic substances)
Housing units lacking complete kitchen facilities: 0.4%
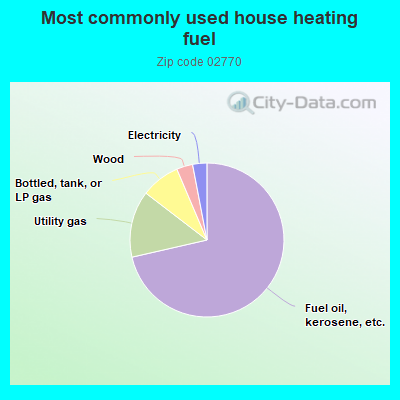
71.5%Fuel oil, kerosene, etc.
14.0%Utility gas
8.2%Bottled, tank, or LP gas
3.4%Wood
3.0%Electricity
Population in 1990: 3,270. Population change in the 1990s: +1,121 (+34.3%).
Place of birth for U.S.-born residents:
This state: 4,199
Northeast: 754
Midwest: 58
South: 121
West: 60
78% of the 02770 zip code residents lived in the same house 5 years ago. Out of people who lived in different houses, 41% lived in this county. Out of people who lived in different counties, 50% lived in Massachusetts.
90% of the 02770 zip code residents lived in the same house 1 year ago. Out of people who lived in different houses, 69% moved from this county. Out of people who lived in different houses, 16% moved from different county within same state. Out of people who lived in different houses, 10% moved from different state.
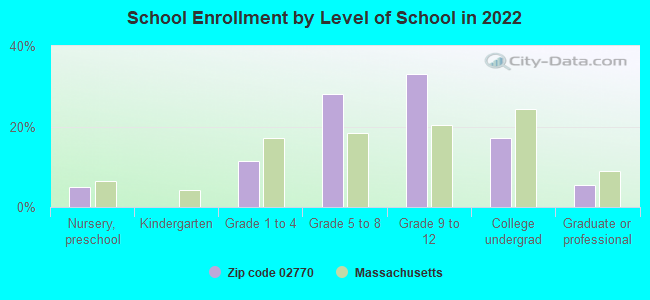
Private vs. public school enrollment:
Students in private schools in grades 1 to 8 (elementary and middle school): 27
Here:
5.3%
Massachusetts:
10.3%
Students in private schools in grades 9 to 12 (high school): 113
Here:
25.5%
Massachusetts:
12.3%
Students in private undergraduate colleges: 67
Here:
29.9%
Massachusetts:
51.2%
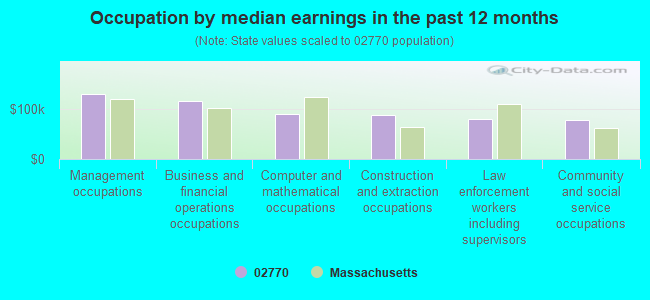
Occupation by median earnings in the past 12 months ($)
129,467Management occupations
115,459Business and financial operations occupations
88,735Computer and mathematical occupations
87,507Construction and extraction occupations
80,064Law enforcement workers including supervisors
77,068Community and social service occupations
Top industries in this zip code by the number of employees in 2005:
Administrative and Support and Waste Management and Remediation Services: Solid Waste Combustors and Incinerators (100-249 employees: 1 establishment)
Administrative and Support and Waste Management and Remediation Services: Landscaping Services (50-99: 1, 1-4: 3)
Administrative and Support and Waste Management and Remediation Services: Solid Waste Collection (20-49: 1)
Construction: Site Preparation Contractors (10-19: 1, 1-4: 5)
Construction: New Single-Family Housing Construction (except Operative Builders) (5-9: 1, 1-4: 4)
Professional, Scientific, and Technical Services: Environmental Consulting Services (10-19: 1)
Construction: Residential Remodelers (1-4: 6)
People in group quarters in 2010:
4 people in residential treatment centers for adults
People in group quarters in 2000:
4 people in homes for the mentally retarded
Home Mortgage Disclosure Act Aggregated Statistics For Year 2009 (Based on 2 partial tracts)
A) FHA, FSA/RHS & VA Home Purchase Loans
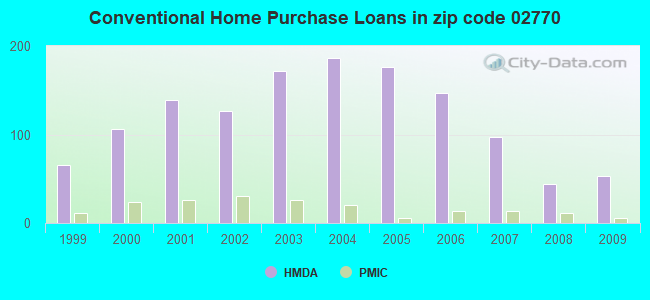
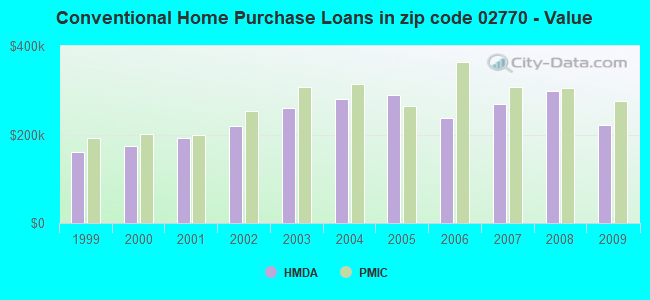
B) Conventional Home Purchase Loans
C) Refinancings
D) Home Improvement Loans
F) Non-occupant Loans on < 5 Family Dwellings (A B C & D)
Number
Average Value
Number
Average Value
Number
Average Value
Number
Average Value
Number
Average Value
LOANS ORIGINATED
13
$281,651
53
$220,682
404
$236,106
26
$130,172
4
$153,630
APPLICATIONS APPROVED, NOT ACCEPTED
0
$0
6
$158,063
28
$258,781
0
$0
2
$66,040
APPLICATIONS DENIED
7
$278,829
11
$209,288
105
$283,860
9
$28,536
4
$148,588
APPLICATIONS WITHDRAWN
2
$220,130
11
$168,265
84
$272,168
7
$217,507
0
$0
FILES CLOSED FOR INCOMPLETENESS
0
$0
2
$94,470
24
$237,555
2
$284,330
2
$229,300
Aggregated Statistics For Year 2008 (Based on 2 partial tracts)
A) FHA, FSA/RHS & VA Home Purchase Loans
B) Conventional Home Purchase Loans
C) Refinancings
D) Home Improvement Loans
F) Non-occupant Loans on < 5 Family Dwellings (A B C & D)
Number
Average Value
Number
Average Value
Number
Average Value
Number
Average Value
Number
Average Value
LOANS ORIGINATED
9
$313,479
44
$298,007
158
$251,928
26
$71,683
11
$228,966
APPLICATIONS APPROVED, NOT ACCEPTED
2
$259,570
9
$252,536
28
$213,642
9
$60,128
0
$0
APPLICATIONS DENIED
4
$261,860
11
$214,291
50
$239,940
20
$119,511
2
$177,935
APPLICATIONS WITHDRAWN
0
$0
2
$221,960
33
$258,206
4
$64,205
0
$0
FILES CLOSED FOR INCOMPLETENESS
0
$0
4
$236,638
7
$314,207
2
$32,100
0
$0
Aggregated Statistics For Year 2007 (Based on 2 partial tracts)
A) FHA, FSA/RHS & VA Home Purchase Loans
B) Conventional Home Purchase Loans
C) Refinancings
D) Home Improvement Loans
F) Non-occupant Loans on < 5 Family Dwellings (A B C & D)
Number
Average Value
Number
Average Value
Number
Average Value
Number
Average Value
Number
Average Value
LOANS ORIGINATED
4
$259,568
97
$268,673
211
$216,477
59
$95,544
22
$260,151
APPLICATIONS APPROVED, NOT ACCEPTED
0
$0
20
$259,018
48
$238,931
4
$41,275
0
$0
APPLICATIONS DENIED
0
$0
24
$255,517
114
$284,203
18
$107,211
9
$211,976
APPLICATIONS WITHDRAWN
0
$0
9
$256,001
68
$263,021
0
$0
2
$119,235
FILES CLOSED FOR INCOMPLETENESS
0
$0
6
$203,618
17
$211,604
2
$185,275
2
$198,115
Aggregated Statistics For Year 2006 (Based on 2 partial tracts)
A) FHA, FSA/RHS & VA Home Purchase Loans
B) Conventional Home Purchase Loans
C) Refinancings
D) Home Improvement Loans
F) Non-occupant Loans on < 5 Family Dwellings (A B C & D)
G) Loans On Manufactured Home Dwelling (A B C & D)
Number
Average Value
Number
Average Value
Number
Average Value
Number
Average Value
Number
Average Value
Number
Average Value
LOANS ORIGINATED
2
$337,530
147
$236,725
295
$220,165
101
$115,549
9
$183,237
0
$0
APPLICATIONS APPROVED, NOT ACCEPTED
0
$0
11
$225,798
50
$231,538
7
$95,651
6
$188,943
2
$22,930
APPLICATIONS DENIED
0
$0
29
$247,201
95
$266,471
20
$151,796
9
$242,549
2
$90,805
APPLICATIONS WITHDRAWN
0
$0
17
$242,033
84
$259,982
9
$249,071
2
$280,665
0
$0
FILES CLOSED FOR INCOMPLETENESS
0
$0
4
$348,995
28
$325,016
0
$0
0
$0
0
$0
Aggregated Statistics For Year 2005 (Based on 2 partial tracts)
A) FHA, FSA/RHS & VA Home Purchase Loans
B) Conventional Home Purchase Loans
C) Refinancings
D) Home Improvement Loans
F) Non-occupant Loans on < 5 Family Dwellings (A B C & D)
G) Loans On Manufactured Home Dwelling (A B C & D)
Number
Average Value
Number
Average Value
Number
Average Value
Number
Average Value
Number
Average Value
Number
Average Value
LOANS ORIGINATED
0
$0
176
$289,272
361
$229,757
62
$97,549
7
$225,893
2
$64,205
APPLICATIONS APPROVED, NOT ACCEPTED
0
$0
9
$195,669
44
$249,020
15
$72,765
0
$0
2
$15,590
APPLICATIONS DENIED
4
$265,070
31
$340,666
123
$275,100
33
$132,577
6
$231,440
4
$9,172
APPLICATIONS WITHDRAWN
0
$0
24
$441,479
152
$262,693
9
$239,288
11
$425,247
0
$0
FILES CLOSED FOR INCOMPLETENESS
0
$0
11
$290,669
24
$293,351
0
$0
0
$0
0
$0
Aggregated Statistics For Year 2004 (Based on 2 partial tracts)
A) FHA, FSA/RHS & VA Home Purchase Loans
B) Conventional Home Purchase Loans
C) Refinancings
D) Home Improvement Loans
F) Non-occupant Loans on < 5 Family Dwellings (A B C & D)
Number
Average Value
Number
Average Value
Number
Average Value
Number
Average Value
Number
Average Value
LOANS ORIGINATED
4
$184,815
187
$279,663
437
$204,651
29
$113,353
9
$162,242
APPLICATIONS APPROVED, NOT ACCEPTED
0
$0
20
$288,460
57
$252,407
6
$11,923
2
$256,815
APPLICATIONS DENIED
2
$243,975
24
$271,950
101
$258,850
9
$155,924
4
$192,612
APPLICATIONS WITHDRAWN
0
$0
17
$220,344
143
$223,001
2
$68,790
0
$0
FILES CLOSED FOR INCOMPLETENESS
2
$243,975
0
$0
20
$230,859
4
$206,370
2
$321,020
Aggregated Statistics For Year 2003 (Based on 2 partial tracts)
A) FHA, FSA/RHS & VA Home Purchase Loans
B) Conventional Home Purchase Loans
C) Refinancings
D) Home Improvement Loans
F) Non-occupant Loans on < 5 Family Dwellings (A B C & D)
Number
Average Value
Number
Average Value
Number
Average Value
Number
Average Value
Number
Average Value
LOANS ORIGINATED
4
$245,350
172
$260,965
954
$174,451
53
$105,392
17
$247,428
APPLICATIONS APPROVED, NOT ACCEPTED
0
$0
33
$225,020
66
$179,160
7
$32,757
4
$184,358
APPLICATIONS DENIED
0
$0
33
$213,568
101
$195,046
6
$30,573
2
$141,250
APPLICATIONS WITHDRAWN
0
$0
6
$235,720
156
$194,176
4
$63,745
0
$0
FILES CLOSED FOR INCOMPLETENESS
0
$0
2
$188,945
15
$168,275
0
$0
0
$0
Aggregated Statistics For Year 2002 (Based on 2 partial tracts)
A) FHA, FSA/RHS & VA Home Purchase Loans
B) Conventional Home Purchase Loans
C) Refinancings
D) Home Improvement Loans
F) Non-occupant Loans on < 5 Family Dwellings (A B C & D)
Number
Average Value
Number
Average Value
Number
Average Value
Number
Average Value
Number
Average Value
LOANS ORIGINATED
6
$184,663
127
$219,478
596
$157,860
51
$44,134
6
$116,178
APPLICATIONS APPROVED, NOT ACCEPTED
2
$148,585
4
$293,962
77
$151,112
6
$28,738
0
$0
APPLICATIONS DENIED
0
$0
7
$288,524
57
$166,576
15
$49,039
2
$113,735
APPLICATIONS WITHDRAWN
0
$0
9
$149,198
77
$173,958
6
$36,077
2
$82,550
FILES CLOSED FOR INCOMPLETENESS
0
$0
0
$0
17
$154,629
0
$0
0
$0
Aggregated Statistics For Year 2001 (Based on 2 partial tracts)
A) FHA, FSA/RHS & VA Home Purchase Loans
B) Conventional Home Purchase Loans
C) Refinancings
D) Home Improvement Loans
F) Non-occupant Loans on < 5 Family Dwellings (A B C & D)
Number
Average Value
Number
Average Value
Number
Average Value
Number
Average Value
Number
Average Value
LOANS ORIGINATED
4
$166,012
139
$192,467
466
$149,641
50
$36,174
7
$105,347
APPLICATIONS APPROVED, NOT ACCEPTED
2
$168,765
17
$161,643
39
$118,625
7
$45,599
2
$152,255
APPLICATIONS DENIED
0
$0
11
$171,433
57
$120,523
28
$43,829
4
$147,210
APPLICATIONS WITHDRAWN
0
$0
2
$84,380
83
$134,066
6
$15,287
7
$124,739
FILES CLOSED FOR INCOMPLETENESS
0
$0
2
$242,140
6
$164,178
0
$0
0
$0
Aggregated Statistics For Year 2000 (Based on 2 partial tracts)
A) FHA, FSA/RHS & VA Home Purchase Loans
B) Conventional Home Purchase Loans
C) Refinancings
D) Home Improvement Loans
F) Non-occupant Loans on < 5 Family Dwellings (A B C & D)
Number
Average Value
Number
Average Value
Number
Average Value
Number
Average Value
Number
Average Value
LOANS ORIGINATED
11
$168,932
106
$174,251
103
$106,342
61
$26,674
6
$129,020
APPLICATIONS APPROVED, NOT ACCEPTED
0
$0
9
$220,332
13
$90,027
7
$8,910
0
$0
APPLICATIONS DENIED
0
$0
6
$165,707
46
$85,978
7
$32,496
4
$96,305
APPLICATIONS WITHDRAWN
0
$0
13
$145,200
33
$100,948
7
$61,321
2
$106,395
FILES CLOSED FOR INCOMPLETENESS
0
$0
2
$148,585
11
$126,907
0
$0
0
$0
Aggregated Statistics For Year 1999 (Based on 1 partial tract)
A) FHA, FSA/RHS & VA Home Purchase Loans
B) Conventional Home Purchase Loans
C) Refinancings
D) Home Improvement Loans
F) Non-occupant Loans on < 5 Family Dwellings (A B C & D)
Detailed PMIC statistics for the following Tracts:5411.00
2002 - 2018 National Fire Incident Reporting System (NFIRS) incidents
According to the data from the years 2002 - 2018 the average number of fire incidents per year is 8. The highest number of reported fire incidents - 13 took place in 2008, and the least - 2 in 2010. The data has a dropping trend.
When looking into fire subcategories, the most reports belonged to: Structure Fires (73.1%), and Mobile Property/Vehicle Fires (15.4%).
Fire incident types reported to NFIRS in Zip Code 02770


 Nearest zip codes: 02743, 02576, 02739, 02738, 02346, 02745.


 According to the data from the years 2002 - 2018 the average number of fire incidents per year is 8. The highest number of reported fire incidents - 13 took place in 2008, and the least - 2 in 2010. The data has a dropping trend.
 When looking into fire subcategories, the most reports belonged to: Structure Fires (73.1%), and Mobile Property/Vehicle Fires (15.4%).