Estimated zip code population in 2022: 7,182 Zip code population in 2010: 6,577 Zip code population in 2000: 6,792
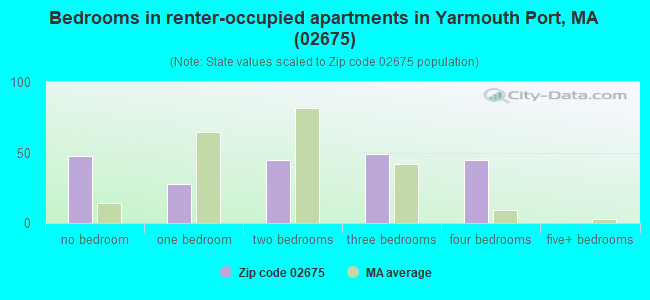
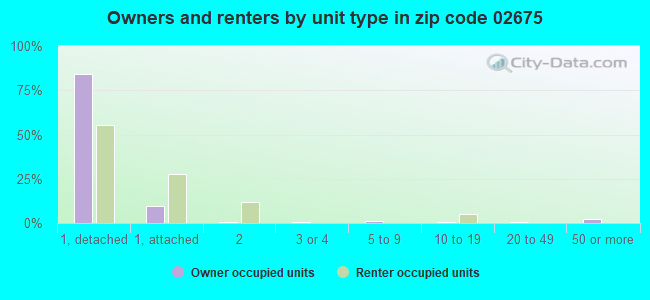
Houses and condos: 4,145 Renter-occupied apartments: 213
% of renters here:
7%
State:
38%
March 2022 cost of living index in zip code 02675: 117.3 (more than average, U.S. average is 100)
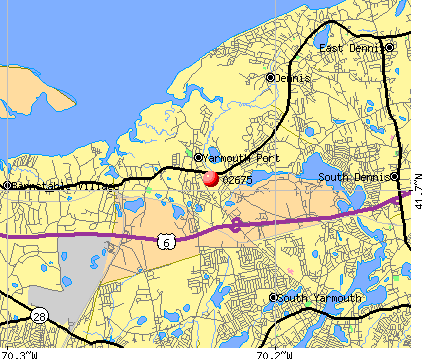
Land area: 9.0 sq. mi. Water area: 0.7 sq. mi.
Population density: 795 people per square mile
(low).
OSM Map
Google Map
MSN Map
OSM Map
General Map
Google Map
MSN Map
OSM Map
Google Map
MSN Map
OSM Map
Google Map
MSN Map
Please wait while loading the map...
Real estate property taxes paid for housing units in 2022:
This zip code:
0.8% ($4,218)
Massachusetts:
1.0% ($5,536)
Median real estate property taxes paid for housing units with mortgages in 2022: $4,190 (0.7%) Median real estate property taxes paid for housing units with no mortgage in 2022: $4,252 (0.8%)
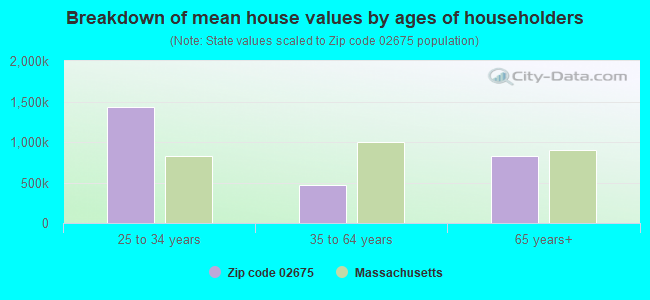
Estimated median house/condo value in 2022: $542,656
02675:
$542,656
Massachusetts:
$534,700
According to our research of Massachusetts and other state lists, there were 3 registered sex offenders living in 02675 zip code as of May 25, 2024. The ratio of all residents to sex offenders in zip code 02675 is 2,158 to 1. The ratio of registered sex offenders to all residents in this zip code is lower than the state average.
Median resident age:
This zip code:
59.9 years
Massachusetts median age:
40.3 years
Average household size:
This zip code:
2.2 people
Massachusetts:
2.4 people
Averages for the 2020 tax year for zip code 02675, filed in 2021:
Average Adjusted Gross Income (AGI) in 2020: $91,959 (Individual Income Tax Returns)
Here:
$91,959
State:
$105,130
Salary/wage: $71,800 (reported on 61.1% of returns)
Here:
$71,800
State:
$82,951
(% of AGI for various income ranges: 955.1% for AGIs below $25k, 3033.3% for AGIs $25k-50k, 5338.1% for AGIs $50k-75k, 7246.4% for AGIs $75k-100k, 13814.1% for AGIs $100k-200k, 88502.9% for AGIs over 200k)
Taxable interest for individuals: $1,754 (reported on 53.5% of returns)
This zip code:
$1,754
Massachusetts:
$2,361
(% of AGI for various income ranges: 64.3% for AGIs below $25k, 69.3% for AGIs $25k-50k, 123.6% for AGIs $50k-75k, 140.8% for AGIs $75k-100k, 254.6% for AGIs $100k-200k, 1792.9% for AGIs over 200k)
Ordinary dividends: $8,865 (reported on 39.1% of returns)
Here:
$8,865
State:
$10,365
(% of AGI for various income ranges: 126.2% for AGIs below $25k, 229.6% for AGIs $25k-50k, 293.9% for AGIs $50k-75k, 498.8% for AGIs $75k-100k, 1039.2% for AGIs $100k-200k, 7938.6% for AGIs over 200k)
Net capital gain/loss in AGI: +$30,294 (reported on 34.3% of returns)
Here:
+$30,294
State:
+$48,178
(% of AGI for various income ranges: 9.1% for AGIs below $25k, 62.6% for AGIs $25k-50k, 248.6% for AGIs $50k-75k, 467.2% for AGIs $75k-100k, 1389.0% for AGIs $100k-200k, 46832.9% for AGIs over 200k)
Profit/loss from business: +$18,164 (reported on 17.9% of returns)
Here:
+$18,164
State:
+$20,792
(% of AGI for various income ranges: 164.9% for AGIs below $25k, 245.4% for AGIs $25k-50k, 367.5% for AGIs $50k-75k, 402.0% for AGIs $75k-100k, 1097.7% for AGIs $100k-200k, 6002.9% for AGIs over 200k)
Taxable individual retirement arrangement distribution: $26,482 (reported on 24.0% of returns)
02675:
$26,482
Massachusetts:
$22,790
(% of AGI for various income ranges: 212.8% for AGIs below $25k, 418.9% for AGIs $25k-50k, 621.9% for AGIs $50k-75k, 1190.0% for AGIs $75k-100k, 2491.0% for AGIs $100k-200k, 10052.9% for AGIs over 200k)
Self-employed (Keogh) retirement plans: $17,233 (reported on 0.8% of returns)
02675:
$17,233
Massachusetts:
$26,868
(% of AGI for various income ranges: 132.6% for AGIs $100k-200k)
Total itemized deductions: $28,242 (reported on 16.9% of returns)
Here:
$28,242
State:
$36,722
(% of AGI for various income ranges: 252.6% for AGIs below $25k, 377.2% for AGIs $25k-50k, 692.8% for AGIs $50k-75k, 959.6% for AGIs $75k-100k, 1357.4% for AGIs $100k-200k, 7901.4% for AGIs over 200k)
Charity contributions: $5,287 (reported on 13.8% of returns)
Here:
$5,287
State:
$12,529
(% of AGI for various income ranges: 11.9% for AGIs below $25k, 41.3% for AGIs $25k-50k, 68.6% for AGIs $50k-75k, 126.4% for AGIs $75k-100k, 213.8% for AGIs $100k-200k, 1731.4% for AGIs over 200k)
Taxes paid: $7,730 (reported on 16.9% of returns)
02675:
$7,730
State:
$8,782
(% of AGI for various income ranges: 57.4% for AGIs below $25k, 73.9% for AGIs $25k-50k, 206.1% for AGIs $50k-75k, 294.0% for AGIs $75k-100k, 433.6% for AGIs $100k-200k, 1891.4% for AGIs over 200k)
Earned income credit: $1,647 (reported on 4.3% of returns)
Here:
$1,647
State:
$1,909
(% of AGI for various income ranges: 35.7% for AGIs below $25k, 24.3% for AGIs $25k-50k)
Percentage of individuals using paid preparers for their 2020 taxes: 92.1%
Here:
92%
State:
92%
(% for various income ranges: 88.3% for AGIs below $25k, 92.0% for AGIs $25k-50k, 91.9% for AGIs $50k-75k, 95.6% for AGIs $75k-100k, 93.9% for AGIs $100k-200k, 93.9% for AGIs over 200k)
Averages for the 2012 tax year for zip code 02675, filed in 2013:
Average Adjusted Gross Income (AGI) in 2012: $67,380 (Individual Income Tax Returns)
Here:
$67,380
State:
$81,425
Salary/wage: $53,786 (reported on 62.7% of returns)
Here:
$53,786
State:
$64,752
(% of AGI for various income ranges: 48.8% for AGIs below $25k, 53.1% for AGIs $25k-50k, 45.1% for AGIs $50k-75k, 47.5% for AGIs $75k-100k, 51.6% for AGIs $100k-200k, 51.7% for AGIs over 200k)
Taxable interest for individuals: $1,760 (reported on 58.1% of returns)
This zip code:
$1,760
Massachusetts:
$2,136
(% of AGI for various income ranges: 3.0% for AGIs below $25k, 1.8% for AGIs $25k-50k, 1.9% for AGIs $50k-75k, 1.2% for AGIs $75k-100k, 1.2% for AGIs $100k-200k, 1.4% for AGIs over 200k)
Ordinary dividends: $7,498 (reported on 40.8% of returns)
Here:
$7,498
State:
$9,473
(% of AGI for various income ranges: 9.3% for AGIs below $25k, 3.8% for AGIs $25k-50k, 5.1% for AGIs $50k-75k, 4.1% for AGIs $75k-100k, 4.1% for AGIs $100k-200k, 4.4% for AGIs over 200k)
Net capital gain/loss in AGI: +$7,586 (reported on 33.7% of returns)
Here:
+$7,586
State:
+$31,437
(% of AGI for various income ranges: 1.3% for AGIs $50k-75k, 0.7% for AGIs $75k-100k, 2.6% for AGIs $100k-200k, 12.1% for AGIs over 200k)
Profit/loss from business: +$16,796 (reported on 18.4% of returns)
Here:
+$16,796
State:
+$20,662
(% of AGI for various income ranges: 10.6% for AGIs below $25k, 5.6% for AGIs $25k-50k, 3.5% for AGIs $50k-75k, 4.8% for AGIs $75k-100k, 3.6% for AGIs $100k-200k, 4.5% for AGIs over 200k)
Taxable individual retirement arrangement distribution: $18,102 (reported on 27.4% of returns)
02675:
$18,102
Massachusetts:
$18,892
(% of AGI for various income ranges: 8.9% for AGIs below $25k, 7.4% for AGIs $25k-50k, 6.6% for AGIs $50k-75k, 7.8% for AGIs $75k-100k, 8.7% for AGIs $100k-200k, 5.5% for AGIs over 200k)
Self-employment retirement plans: $14,320 (reported on 1.4% of returns)
02675:
$14,320
Massachusetts:
$20,669
Total itemized deductions: $23,541 (24% of AGI, reported on 49.6% of returns)
Here:
$23,541
State:
$28,907
Here:
23.6% of AGI
State:
18.2% of AGI
(% of AGI for various income ranges: 31.8% for AGIs below $25k, 18.1% for AGIs $25k-50k, 18.5% for AGIs $50k-75k, 16.0% for AGIs $75k-100k, 16.9% for AGIs $100k-200k, 14.2% for AGIs over 200k)
Charity contributions: $2,746 (reported on 42.5% of returns)
Here:
$2,746
State:
$4,208
(% of AGI for various income ranges: 2.0% for AGIs below $25k, 1.4% for AGIs $25k-50k, 1.6% for AGIs $50k-75k, 1.6% for AGIs $75k-100k, 1.7% for AGIs $100k-200k, 2.0% for AGIs over 200k)
Taxes paid: $8,632 (reported on 49.3% of returns)
02675:
$8,632
State:
$13,303
(% of AGI for various income ranges: 6.2% for AGIs below $25k, 5.0% for AGIs $25k-50k, 5.5% for AGIs $50k-75k, 5.8% for AGIs $75k-100k, 6.9% for AGIs $100k-200k, 7.1% for AGIs over 200k)
Earned income credit: $1,452 (reported on 6.8% of returns)
Here:
$1,452
State:
$1,971
(% of AGI for various income ranges: 1.9% for AGIs below $25k, 0.4% for AGIs $25k-50k)
Percentage of individuals using paid preparers for their 2012 taxes: 61.4%
Here:
61%
State:
56%
(% for various income ranges: 56.2% for AGIs below $25k, 53.8% for AGIs $25k-50k, 63.3% for AGIs $50k-75k, 66.7% for AGIs $75k-100k, 70.9% for AGIs $100k-200k, 81.2% for AGIs over 200k)
Averages for the 2004 tax year for zip code 02675, filed in 2005:
Average Adjusted Gross Income (AGI) in 2004: $60,396 (Individual Income Tax Returns)
Here:
$60,396
State:
$62,877
Salary/wage: $45,589 (reported on 64.0% of returns)
Here:
$45,589
State:
$52,969
(% of AGI for various income ranges: 112.4% for AGIs below $10k, 49.7% for AGIs $10k-25k, 51.0% for AGIs $25k-50k, 47.5% for AGIs $50k-75k, 54.6% for AGIs $75k-100k, 44.3% for AGIs over 100k)
Taxable interest for individuals: $2,633 (reported on 71.0% of returns)
This zip code:
$2,633
Massachusetts:
$1,945
(% of AGI for various income ranges: 11.1% for AGIs below $10k, 7.1% for AGIs $10k-25k, 3.6% for AGIs $25k-50k, 3.7% for AGIs $50k-75k, 2.5% for AGIs $75k-100k, 2.3% for AGIs over 100k)
Taxable dividends: $5,040 (reported on 47.9% of returns)
Here:
$5,040
State:
$5,323
(% of AGI for various income ranges: 18.5% for AGIs below $10k, 6.5% for AGIs $10k-25k, 4.0% for AGIs $25k-50k, 4.5% for AGIs $50k-75k, 3.5% for AGIs $75k-100k, 3.5% for AGIs over 100k)
Net capital gain/loss: +$13,769 (reported on 40.5% of returns)
Here:
+$13,769
State:
+$20,377
(% of AGI for various income ranges: -5.1% for AGIs below $10k, -1.3% for AGIs $10k-25k, 0.6% for AGIs $25k-50k, 2.3% for AGIs $50k-75k, 4.1% for AGIs $75k-100k, 17.5% for AGIs over 100k)
Profit/loss from business: +$17,658 (reported on 18.5% of returns)
Here:
+$17,658
State:
+$17,837
(% of AGI for various income ranges: 7.9% for AGIs below $10k, 7.7% for AGIs $10k-25k, 7.4% for AGIs $25k-50k, 5.2% for AGIs $50k-75k, 4.8% for AGIs $75k-100k, 4.8% for AGIs over 100k)
IRA payment deduction: $3,626 (reported on 3.9% of returns)
02675:
$3,626
Massachusetts:
$3,100
(% of AGI for various income ranges: 0.5% for AGIs $10k-25k, 0.5% for AGIs $25k-50k, 0.3% for AGIs $50k-75k, 0.2% for AGIs $75k-100k, 0.1% for AGIs over 100k)
Self-employed pension: $11,366 (reported on 2.0% of returns)
Here:
$11,366
Massachusetts:
$14,516
(% of AGI for various income ranges: 0.4% for AGIs $25k-50k, 0.2% for AGIs $50k-75k, 0.4% for AGIs $75k-100k, 0.5% for AGIs over 100k)
Total itemized deductions: $21,182 (24% of AGI, reported on 53.5% of returns)
Here:
$21,182
State:
$22,573
Here:
24.1% of AGI
State:
19.5% of AGI
(% of AGI for various income ranges: 54.7% for AGIs below $10k, 30.0% for AGIs $10k-25k, 18.8% for AGIs $25k-50k, 20.7% for AGIs $50k-75k, 18.0% for AGIs $75k-100k, 16.4% for AGIs over 100k)
Charity contributions deductions: $2,491 (3% of AGI, reported on 48.6% of returns)
Here:
$2,491
State:
$3,295
Here:
2.9% of AGI
State:
2.7% of AGI
(% of AGI for various income ranges: 3.3% for AGIs below $10k, 2.4% for AGIs $10k-25k, 1.8% for AGIs $25k-50k, 2.1% for AGIs $50k-75k, 2.0% for AGIs $75k-100k, 2.0% for AGIs over 100k)
Total tax: $9,306 (reported on 83.3% of returns)
02675:
$9,306
State:
$11,494
(% of AGI for various income ranges: 4.2% for AGIs below $10k, 4.4% for AGIs $10k-25k, 7.8% for AGIs $25k-50k, 9.6% for AGIs $50k-75k, 11.0% for AGIs $75k-100k, 17.3% for AGIs over 100k)
Earned income credit: $1,242 (reported on 5.1% of returns)
Here:
$1,242
State:
$1,518
Percentage of individuals using paid preparers for their 2004 taxes: 66.3%
Here:
66%
State:
58%
(% for various income ranges: 54.5% for AGIs below $10k, 64.4% for AGIs $10k-25k, 63.2% for AGIs $25k-50k, 69.8% for AGIs $50k-75k, 71.1% for AGIs $75k-100k, 79.7% for AGIs over 100k)
Likely homosexual households (counted as self-reported same-sex unmarried-partner households)
Lesbian couples: 0.2% of all households
Gay men: 0.0% of all households
Household received Food Stamps/SNAP in the past 12 months: 244 Household did not receive Food Stamps/SNAP in the past 12 months: 2,981
Women who had a birth in the past 12 months: 40 (33 now married, 7 unmarried) Women who did not have a birth in the past 12 months: 1,072 (493 now married, 573 unmarried)
Housing units in zip code 02675 with a mortgage: 1,611 (270 second mortgage, 7 home equity loan, 240 both second mortgage and home equity loan) Houses without a mortgage: 86
Median monthly owner costs for units with a mortgage: $2,183 Median monthly owner costs for units without a mortgage: $903
Residents with income below the poverty level in 2022:
This zip code:
6.7%
Whole state:
10.4%
Residents with income below 50% of the poverty level in 2022:
This zip code:
1.8%
Whole state:
5.1%
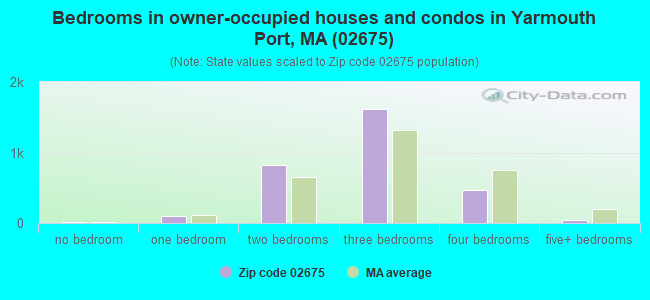
Median number of rooms in houses and condos:
Here:
6.4
State:
6.5
Median number of rooms in apartments:
Here:
5.1
State:
4.0
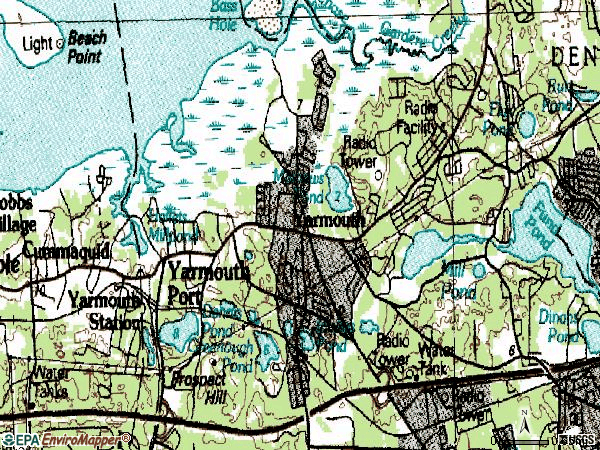
Notable locations in this zip code not listed on our city pages
Notable locations in zip code 02675: Boy Scout Camp (A), Yarmouth Fire Department Station 2 (B), Chandler Gray House (C), Colonel John Thacher House (D), Winslow-Crocker House (E). Display/hide their locations on the map
Lakes and reservoirs: Howes Pond (A), Perch Pond (B), Mill Pond (C), Miller Pond (D), Matthews Pond (E), Greenough Pond (F), Elishas Pond (G), Long Pond (H). Display/hide their locations on the map
Streams, rivers, and creeks: Short Wharf Creek (A), Chase Garden Creek (B), Clays Creek (C), Whites Brook (D), Hamblins Brook (E), Weir Creek (F), Bass Creek (G), Lone Tree Creek (H), Mill Creek (I). Display/hide their locations on the map
In group quarters: 10 (-1 institutionalized population)
Size of family households: 1,462 2-persons, 273 3-persons, 288 4-persons, 23 5-persons, 118 6-persons, 14 7-or-more-persons
Size of nonfamily households: 1,000 1-person, 97 2-persons, 4 3-persons
706 married couples with children.
141 single-parent households (92 men, 49 women).
95.7% of residents of 02675 zip code speak English at home.
1.6% of residents speak Spanish at home (100% very well).
3.6% of residents speak other Indo-European language at home (100% very well).
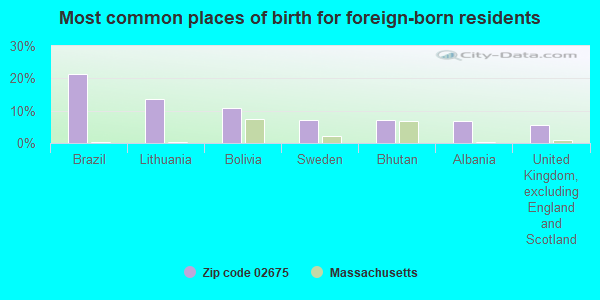
Foreign born population: 278 (3.9%) (88.0% of them are naturalized citizens)
This zip code:
3.9%
Whole state:
18.0%
21%Brazil
14%Lithuania
11%Bolivia
7%Sweden
7%Bhutan
7%Albania
5%United Kingdom, excluding England and Scotland
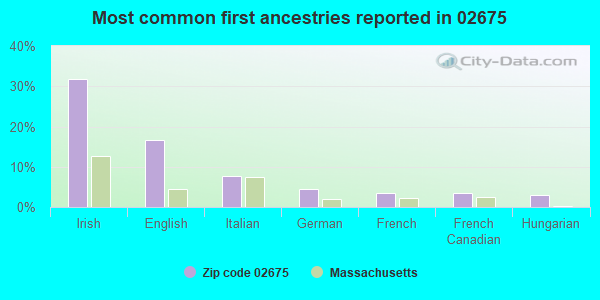
32%Irish
17%English
8%Italian
4%German
4%French
3%French Canadian
3%Hungarian
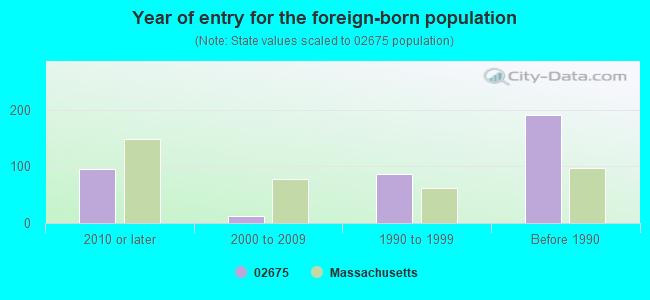
Year of entry for the foreign-born population
952010 or later
132000 to 2009
861990 to 1999
191Before 1990
Facilities with environmental interests located in this zip code:
KINGS WAY GOLF CLUB (64 KINGS CIRCUIT - OFF ROUTE 6A in YARMOUTH, MA)
STATE MASTER (MA-EPICS) - RCRAINFO-MAD985270883, HAZARDOUS WASTE PROGRAM Small Quantity Generators, between 100 kg and 1000 kg of hazardous waste/month (Resource Conservation and Recovery Act (tracking hazardous waste)) - notification (Resource Conservation and Recovery Act (tracking hazardous waste)) Organizations: THE GREEN CO (CONTACT/OWNER)
, GREEN COMPANY THE (CONTACT/OWNER)
CAPE COD READY MIX INC. (357 WHITES PATH in YARMOUTH, MA)
TRI REPORTER (Tracking of toxic chemicals releasing facilities) - ICIS-, ENFORCEMENT/COMPLIANCE ACTIVITY, ICIS-01-2005-9029, Business SIC classification: READY-MIXED CONCRETE
CANNON ENGINEERING (350 MAIN ST in YARMOUTH, MA)
SUPERFUND (Superfund database) (Resource Conservation and Recovery Act (tracking hazardous waste)) Alternative names: CANNON'S ENGINEERING
NEW ENGLAND TELE (STATION AVE in YARMOUTH, MA)
(Resource Conservation and Recovery Act (tracking hazardous waste))
ENTERPRISE AUTO BODY (3 ENTERPRISE ST in YARMOUTH, MA)
Conditionally Exempt Small Quantity Generators, less than 100 kg/month of hazardous waste (Resource Conservation and Recovery Act (tracking hazardous waste)) - notification Organizations: NOTEMEYER JOHN (CONTACT/OWNER)
Housing units lacking complete plumbing facilities: 0.8% Housing units lacking complete kitchen facilities: 0.8%
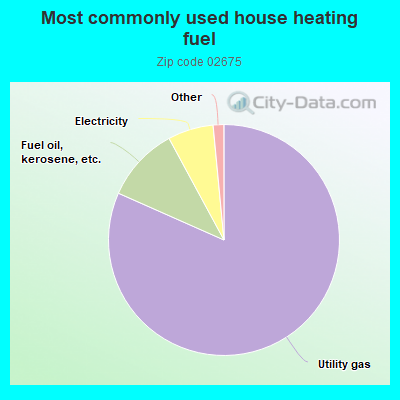
81.8%Utility gas
10.5%Fuel oil, kerosene, etc.
6.4%Electricity
Population in 1990: 5,735. Population change in the 1990s: +1,057 (+18.4%).
Place of birth for U.S.-born residents:
This state: 4,436
Northeast: 1,426
Midwest: 281
South: 297
West: 337
61% of the 02675 zip code residents lived in the same house 5 years ago. Out of people who lived in different houses, 52% lived in this county. Out of people who lived in different counties, 50% lived in Massachusetts.
91% of the 02675 zip code residents lived in the same house 1 year ago. Out of people who lived in different houses, 23% moved from this county. Out of people who lived in different houses, 32% moved from different county within same state. Out of people who lived in different houses, 51% moved from different state.
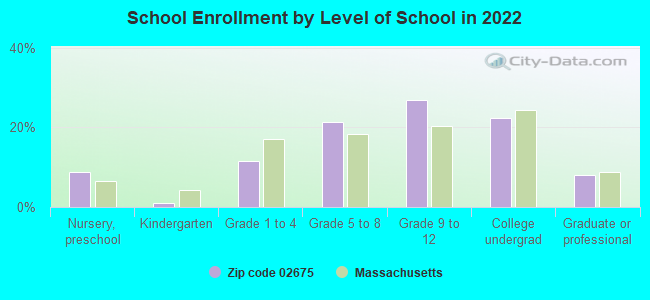
Private vs. public school enrollment:
Students in private schools in grades 1 to 8 (elementary and middle school): 133
Here:
34.0%
Massachusetts:
10.3%
Students in private schools in grades 9 to 12 (high school): 9
Here:
2.9%
Massachusetts:
12.3%
Students in private undergraduate colleges: 36
Here:
14.4%
Massachusetts:
51.2%
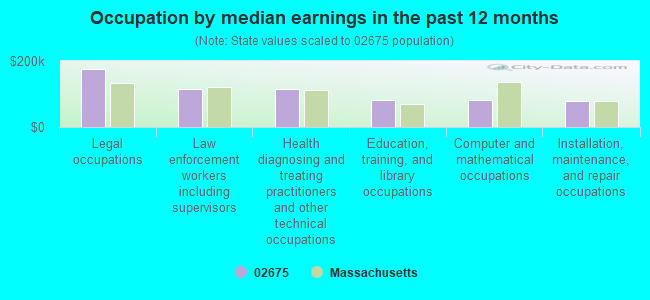
Occupation by median earnings in the past 12 months ($)
176,446Legal occupations
114,876Law enforcement workers including supervisors
114,490Health diagnosing and treating practitioners and other technical occupations
83,092Education, training, and library occupations
80,902Computer and mathematical occupations
79,779Installation, maintenance, and repair occupations
Companies with federal contracts located in this zip code:
BAY STATE REGIONAL CONTRACTORS (73 DESERT SANDS LANE in YARMOUTH PORT, MA; small business) : $530,207 in 7 contractsfrom 2001 to 2004
Contracts for Maintenance, Repair or Alteration of Real Property -- Fuel Supply Facilities by Air Force, United States Coast Guard (disused code: now 7008) Signed by year:2000: $0; 2001: $100,000; 2002: $0; 2003: $216,316; 2004: $213,891; 2005: $0; 2006: $0.
Biggest contracts:
$216,316 with Air Force for Maintenance, Repair or Alteration of Real Property -- Fuel Supply Facilities. Signed on 2003-09-19. Completion date: 2004-07-09.
$204,917, same as above.Signed on 2004-09-02. Completion date: 2004-10-29.
$93,000 with United States Coast Guard (disused code: now 7008) for Maintenance, Repair or Alteration of Real Property -- Fuel Supply Facilities. Signed on 2001-04-15. Completion date: 2001-09-15.
$5,995 with Air Force for Maintenance, Repair or Alteration of Real Property -- Fuel Supply Facilities. Signed on 2004-08-06. Completion date: 2004-09-19.
DURANT, DALE W (78 WEIR RD in YARMOUTH PORT, MA; small business)
$4,800 with Army for Facilities Operations Support Services. Signed on 2006-01-20. Completion date: 2006-10-09.
Top industries in this zip code by the number of employees in 2005:
Administrative and Support and Waste Management and Remediation Services: Temporary Help Services (500-999 employees: 1 establishment)
Other Services (except Public Administration): Environment, Conservation and Wildlife Organizations (100-249: 1)
Utilities: Electric Power Distribution (100-249: 1)
Other Services (except Public Administration): Other Similar Organizations (except Business, Professional, Labor, and Political Organizations) (50-99: 1)
Health Care and Social Assistance: Offices of Physicians (except Mental Health Specialists) (10-19: 3, 5-9: 2, 1-4: 2)
Finance and Insurance: Savings Institutions (20-49: 1, 10-19: 1)
People in group quarters in 2010:
4 people in group homes intended for adults
People in group quarters in 2000:
12 people in homes for the physically handicapped
8 people in homes for the mentally retarded
3 people in other nonhousehold living situations
Fatal accident statistics in 2013:
Fatal accident count: 2
Vehicles involved in fatal accidents: 4
Fatal accidents caused by drunken drivers: 0
Fatalities: 2
Persons involved in fatal accidents: 4
Pedestrians involved in fatal accidents: 1
Fatal accident statistics in 2011:
Fatal accident count: 1
Vehicles involved in fatal accidents: 1
Fatal accidents caused by drunken drivers: 0
Fatalities: 1
Persons involved in fatal accidents: 1
Pedestrians involved in fatal accidents: 0
Home Mortgage Disclosure Act Aggregated Statistics For Year 2009 (Based on 2 partial tracts)
A) FHA, FSA/RHS & VA Home Purchase Loans
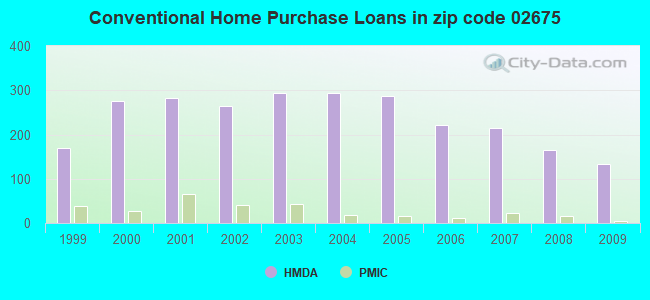
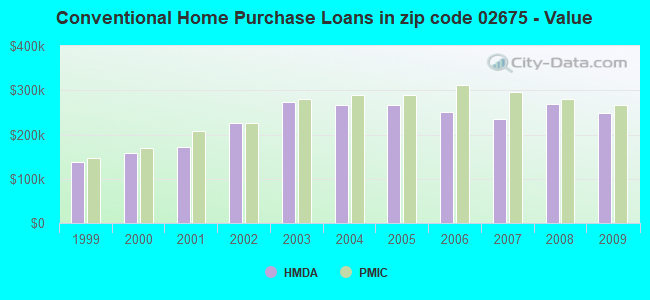
B) Conventional Home Purchase Loans
C) Refinancings
D) Home Improvement Loans
F) Non-occupant Loans on < 5 Family Dwellings (A B C & D)
G) Loans On Manufactured Home Dwelling (A B C & D)
Number
Average Value
Number
Average Value
Number
Average Value
Number
Average Value
Number
Average Value
Number
Average Value
LOANS ORIGINATED
18
$248,569
134
$248,980
488
$234,476
37
$108,945
183
$263,437
0
$0
APPLICATIONS APPROVED, NOT ACCEPTED
0
$0
7
$152,501
30
$236,080
3
$4,427
13
$252,734
0
$0
APPLICATIONS DENIED
2
$183,450
7
$161,751
134
$298,477
3
$29,330
28
$290,239
0
$0
APPLICATIONS WITHDRAWN
3
$241,283
12
$250,552
80
$235,645
3
$234,640
13
$208,036
2
$324,570
FILES CLOSED FOR INCOMPLETENESS
2
$160,210
0
$0
18
$269,413
2
$4,980
2
$205,035
0
$0
Aggregated Statistics For Year 2008 (Based on 2 partial tracts)
A) FHA, FSA/RHS & VA Home Purchase Loans
B) Conventional Home Purchase Loans
C) Refinancings
D) Home Improvement Loans
F) Non-occupant Loans on < 5 Family Dwellings (A B C & D)
Number
Average Value
Number
Average Value
Number
Average Value
Number
Average Value
Number
Average Value
LOANS ORIGINATED
20
$228,360
164
$269,580
214
$248,208
32
$89,703
105
$303,010
APPLICATIONS APPROVED, NOT ACCEPTED
2
$117,875
18
$270,982
35
$332,799
0
$0
10
$298,006
APPLICATIONS DENIED
3
$253,457
3
$298,283
68
$287,312
0
$0
10
$284,392
APPLICATIONS WITHDRAWN
0
$0
17
$220,221
43
$392,309
0
$0
8
$343,661
FILES CLOSED FOR INCOMPLETENESS
0
$0
2
$212,505
15
$549,637
2
$41,505
2
$212,505
Aggregated Statistics For Year 2007 (Based on 2 partial tracts)
A) FHA, FSA/RHS & VA Home Purchase Loans
B) Conventional Home Purchase Loans
C) Refinancings
D) Home Improvement Loans
F) Non-occupant Loans on < 5 Family Dwellings (A B C & D)
Number
Average Value
Number
Average Value
Number
Average Value
Number
Average Value
Number
Average Value
LOANS ORIGINATED
2
$251,520
214
$235,818
281
$265,289
45
$133,074
95
$272,150
APPLICATIONS APPROVED, NOT ACCEPTED
0
$0
23
$240,729
38
$268,166
5
$134,144
10
$234,088
APPLICATIONS DENIED
0
$0
15
$344,104
148
$338,389
18
$123,869
17
$264,069
APPLICATIONS WITHDRAWN
0
$0
17
$240,729
50
$300,961
7
$173,610
10
$285,056
FILES CLOSED FOR INCOMPLETENESS
0
$0
8
$236,371
10
$343,827
0
$0
0
$0
Aggregated Statistics For Year 2006 (Based on 2 partial tracts)
A) FHA, FSA/RHS & VA Home Purchase Loans
B) Conventional Home Purchase Loans
C) Refinancings
D) Home Improvement Loans
E) Loans on Dwellings For 5+ Families
F) Non-occupant Loans on < 5 Family Dwellings (A B C & D)
Number
Average Value
Number
Average Value
Number
Average Value
Number
Average Value
Number
Average Value
Number
Average Value
LOANS ORIGINATED
0
$0
222
$251,244
367
$251,731
88
$146,588
2
$452,405
111
$272,841
APPLICATIONS APPROVED, NOT ACCEPTED
2
$210,845
10
$231,930
58
$255,184
10
$288,377
0
$0
3
$260,097
APPLICATIONS DENIED
0
$0
27
$203,897
106
$300,465
27
$106,314
0
$0
17
$296,102
APPLICATIONS WITHDRAWN
0
$0
18
$335,637
91
$303,379
3
$116,767
0
$0
10
$408,907
FILES CLOSED FOR INCOMPLETENESS
0
$0
0
$0
20
$296,346
2
$355,285
0
$0
0
$0
Aggregated Statistics For Year 2005 (Based on 2 partial tracts)
A) FHA, FSA/RHS & VA Home Purchase Loans
B) Conventional Home Purchase Loans
C) Refinancings
D) Home Improvement Loans
E) Loans on Dwellings For 5+ Families
F) Non-occupant Loans on < 5 Family Dwellings (A B C & D)
Number
Average Value
Number
Average Value
Number
Average Value
Number
Average Value
Number
Average Value
Number
Average Value
LOANS ORIGINATED
2
$136,135
286
$266,787
420
$268,186
73
$156,241
0
$0
151
$284,103
APPLICATIONS APPROVED, NOT ACCEPTED
0
$0
13
$290,279
40
$206,155
7
$148,233
0
$0
3
$607,633
APPLICATIONS DENIED
3
$278,913
17
$265,729
141
$270,789
23
$90,228
0
$0
13
$285,682
APPLICATIONS WITHDRAWN
0
$0
27
$221,299
116
$252,966
17
$452,454
3
$696,177
10
$314,608
FILES CLOSED FOR INCOMPLETENESS
0
$0
8
$234,711
15
$324,957
3
$49,807
0
$0
3
$286,107
Aggregated Statistics For Year 2004 (Based on 2 partial tracts)
A) FHA, FSA/RHS & VA Home Purchase Loans
B) Conventional Home Purchase Loans
C) Refinancings
D) Home Improvement Loans
F) Non-occupant Loans on < 5 Family Dwellings (A B C & D)
Number
Average Value
Number
Average Value
Number
Average Value
Number
Average Value
Number
Average Value
LOANS ORIGINATED
7
$251,164
294
$267,462
448
$238,550
56
$160,269
161
$252,949
APPLICATIONS APPROVED, NOT ACCEPTED
2
$168,510
35
$263,213
45
$225,308
8
$61,635
13
$304,711
APPLICATIONS DENIED
0
$0
50
$328,919
98
$236,240
32
$76,473
12
$203,098
APPLICATIONS WITHDRAWN
0
$0
40
$277,420
153
$223,107
10
$108,411
18
$205,681
FILES CLOSED FOR INCOMPLETENESS
0
$0
2
$31,545
18
$261,389
0
$0
2
$207,525
Aggregated Statistics For Year 2003 (Based on 2 partial tracts)
A) FHA, FSA/RHS & VA Home Purchase Loans
B) Conventional Home Purchase Loans
C) Refinancings
D) Home Improvement Loans
F) Non-occupant Loans on < 5 Family Dwellings (A B C & D)
Number
Average Value
Number
Average Value
Number
Average Value
Number
Average Value
Number
Average Value
LOANS ORIGINATED
3
$146,650
294
$272,442
1,386
$184,692
18
$50,544
244
$230,530
APPLICATIONS APPROVED, NOT ACCEPTED
0
$0
13
$243,283
128
$160,975
10
$116,214
20
$181,460
APPLICATIONS DENIED
0
$0
17
$249,714
148
$236,220
12
$70,282
13
$200,884
APPLICATIONS WITHDRAWN
0
$0
12
$272,688
156
$193,584
8
$42,128
7
$213,929
FILES CLOSED FOR INCOMPLETENESS
0
$0
7
$246,659
23
$202,400
0
$0
2
$473,155
Aggregated Statistics For Year 2002 (Based on 2 partial tracts)
A) FHA, FSA/RHS & VA Home Purchase Loans
B) Conventional Home Purchase Loans
C) Refinancings
D) Home Improvement Loans
F) Non-occupant Loans on < 5 Family Dwellings (A B C & D)
Number
Average Value
Number
Average Value
Number
Average Value
Number
Average Value
Number
Average Value
LOANS ORIGINATED
7
$141,117
264
$225,152
852
$159,763
35
$51,419
183
$205,992
APPLICATIONS APPROVED, NOT ACCEPTED
0
$0
18
$224,035
80
$158,072
8
$62,880
8
$162,285
APPLICATIONS DENIED
0
$0
17
$241,217
120
$168,662
22
$40,826
7
$84,907
APPLICATIONS WITHDRAWN
0
$0
15
$225,123
101
$167,467
7
$35,576
8
$238,031
FILES CLOSED FOR INCOMPLETENESS
0
$0
0
$0
10
$180,464
0
$0
0
$0
Aggregated Statistics For Year 2001 (Based on 2 partial tracts)
A) FHA, FSA/RHS & VA Home Purchase Loans
B) Conventional Home Purchase Loans
C) Refinancings
D) Home Improvement Loans
F) Non-occupant Loans on < 5 Family Dwellings (A B C & D)
Number
Average Value
Number
Average Value
Number
Average Value
Number
Average Value
Number
Average Value
LOANS ORIGINATED
7
$164,597
282
$171,107
656
$155,074
32
$41,505
129
$163,897
APPLICATIONS APPROVED, NOT ACCEPTED
0
$0
30
$198,228
60
$128,500
5
$41,172
12
$176,812
APPLICATIONS DENIED
2
$141,945
12
$83,148
70
$131,274
22
$30,865
7
$122,617
APPLICATIONS WITHDRAWN
0
$0
18
$238,239
75
$138,018
12
$40,813
10
$196,734
FILES CLOSED FOR INCOMPLETENESS
0
$0
7
$126,650
13
$185,815
2
$24,905
0
$0
Aggregated Statistics For Year 2000 (Based on 2 partial tracts)
A) FHA, FSA/RHS & VA Home Purchase Loans
B) Conventional Home Purchase Loans
C) Refinancings
D) Home Improvement Loans
F) Non-occupant Loans on < 5 Family Dwellings (A B C & D)
Number
Average Value
Number
Average Value
Number
Average Value
Number
Average Value
Number
Average Value
LOANS ORIGINATED
8
$89,651
276
$157,226
178
$143,533
56
$40,942
100
$170,187
APPLICATIONS APPROVED, NOT ACCEPTED
2
$136,965
17
$160,844
38
$101,534
12
$54,095
7
$109,336
APPLICATIONS DENIED
2
$107,915
37
$133,803
55
$119,957
17
$38,185
10
$98,782
APPLICATIONS WITHDRAWN
0
$0
13
$144,438
46
$109,645
10
$47,648
2
$83,010
FILES CLOSED FOR INCOMPLETENESS
0
$0
8
$135,514
15
$171,554
2
$49,805
2
$127,835
Aggregated Statistics For Year 1999 (Based on 1 partial tract)
A) FHA, FSA/RHS & VA Home Purchase Loans
B) Conventional Home Purchase Loans
C) Refinancings
D) Home Improvement Loans
F) Non-occupant Loans on < 5 Family Dwellings (A B C & D)
Detailed PMIC statistics for the following Tracts:0118.00
2002 - 2018 National Fire Incident Reporting System (NFIRS) incidents
According to the data from the years 2002 - 2018 the average number of fire incidents per year is 15. The highest number of reported fires - 28 took place in 2003, and the least - 4 in 2002. The data has a rising trend.
When looking into fire subcategories, the most reports belonged to: Structure Fires (42.3%), and Outside Fires (35.6%).
Fire incident types reported to NFIRS in Zip Code 02675


 Nearest zip codes: 02637, 02638, 02664, 02673, 02630, 02660.


 According to the data from the years 2002 - 2018 the average number of fire incidents per year is 15. The highest number of reported fires - 28 took place in 2003, and the least - 4 in 2002. The data has a rising trend.
 When looking into fire subcategories, the most reports belonged to: Structure Fires (42.3%), and Outside Fires (35.6%).