Estimated zip code population in 2022: 2,268 Zip code population in 2010: 1,177 Zip code population in 2000: 1,205
Houses and condos: 2,202 Renter-occupied apartments: 98
% of renters here:
12%
State:
38%
March 2022 cost of living index in zip code 02535: 108.6 (more than average, U.S. average is 100)
Land area: 24.4 sq. mi. Water area: 25.4 sq. mi.
Population density: 93 people per square mile
(very low).
OSM Map
Google Map
MSN Map
OSM Map
General Map
Google Map
MSN Map
OSM Map
Google Map
MSN Map
OSM Map
Google Map
MSN Map
Please wait while loading the map...
Real estate property taxes paid for housing units in 2022:
This zip code:
0.3% ($5,504)
Massachusetts:
1.0% ($5,536)
Median real estate property taxes paid for housing units with mortgages in 2022: $5,211 (0.3%) Median real estate property taxes paid for housing units with no mortgage in 2022: $6,015 (0.4%)
Business Search- 14 Million verified businesses
Males: 1,159
(51.1%)
Females: 1,109
(48.9%)
For population 25 years and over in 02535:
High school or higher: 97.2%
Bachelor's degree or higher: 60.8%
Graduate or professional degree: 27.1%
Unemployed: 7.2%
Mean travel time to work (commute): 20.3 minutes
For population 15 years and over in 02535:
Never married: 32.2%
Now married: 52.8%
Separated: 0.5%
Widowed: 3.2%
Divorced: 11.3%
Zip code 02535 compared to state average:
Median house value significantly above state average.
Unemployed percentage above state average.
Black race population percentage significantly below state average.
Hispanic race population percentage below state average.
Median age significantly above state average.
Foreign-born population percentage below state average.
Renting percentage significantly below state average.
Length of stay since moving in significantly above state average.
Estimated median house/condo value in 2022: $1,733,272
02535:
$1,733,272
Massachusetts:
$534,700
Median resident age:
This zip code:
54.5 years
Massachusetts median age:
40.3 years
Average household size:
This zip code:
2.8 people
Massachusetts:
2.4 people
Averages for the 2020 tax year for zip code 02535, filed in 2021:
Average Adjusted Gross Income (AGI) in 2020: $208,542 (Individual Income Tax Returns)
Here:
$208,542
State:
$105,130
Salary/wage: $79,438 (reported on 62.5% of returns)
Here:
$79,438
State:
$82,951
(% of AGI for various income ranges: 1060.0% for AGIs below $25k, 3795.0% for AGIs $25k-50k, 8865.0% for AGIs $50k-75k, 10490.0% for AGIs $75k-100k, 19702.5% for AGIs $100k-200k, 105245.0% for AGIs over 200k)
Taxable interest for individuals: $6,314 (reported on 55.0% of returns)
This zip code:
$6,314
Massachusetts:
$2,361
(% of AGI for various income ranges: 67.0% for AGIs below $25k, 81.2% for AGIs $25k-50k, 137.5% for AGIs $50k-75k, 273.3% for AGIs $75k-100k, 412.5% for AGIs $100k-200k, 11720.0% for AGIs over 200k)
Ordinary dividends: $28,732 (reported on 46.2% of returns)
Here:
$28,732
State:
$10,365
(% of AGI for various income ranges: 214.0% for AGIs below $25k, 318.8% for AGIs $25k-50k, 800.0% for AGIs $50k-75k, 733.3% for AGIs $75k-100k, 4810.0% for AGIs $100k-200k, 38490.0% for AGIs over 200k)
Net capital gain/loss in AGI: +$81,253 (reported on 42.5% of returns)
Here:
+$81,253
State:
+$48,178
(% of AGI for various income ranges: 48.0% for AGIs below $25k, 181.2% for AGIs $25k-50k, 1610.0% for AGIs $50k-75k, 496.7% for AGIs $75k-100k, 4627.5% for AGIs $100k-200k, 123945.0% for AGIs over 200k)
Profit/loss from business: +$28,784 (reported on 40.0% of returns)
Here:
+$28,784
State:
+$20,792
(% of AGI for various income ranges: 597.0% for AGIs below $25k, 906.2% for AGIs $25k-50k, 1655.0% for AGIs $50k-75k, 990.0% for AGIs $75k-100k, 5317.5% for AGIs $100k-200k, 24015.0% for AGIs over 200k)
Taxable individual retirement arrangement distribution: $43,510 (reported on 12.5% of returns)
02535:
$43,510
Massachusetts:
$22,790
(% of AGI for various income ranges: 317.0% for AGIs below $25k, 1192.5% for AGIs $50k-75k, 1745.0% for AGIs $100k-200k, 14295.0% for AGIs over 200k)
Self-employed (Keogh) retirement plans: $28,733 (reported on 3.8% of returns)
02535:
$28,733
Massachusetts:
$26,868
(% of AGI for various income ranges: 2155.0% for AGIs $100k-200k)
Total itemized deductions: $69,000 (reported on 22.5% of returns)
Here:
$69,000
State:
$36,722
(% of AGI for various income ranges: 628.0% for AGIs below $25k, 2185.0% for AGIs $50k-75k, 5240.0% for AGIs $100k-200k, 44110.0% for AGIs over 200k)
Charity contributions: $39,453 (reported on 18.8% of returns)
Here:
$39,453
State:
$12,529
(% of AGI for various income ranges: 50.0% for AGIs $25k-50k, 545.0% for AGIs $100k-200k, 28300.0% for AGIs over 200k)
Taxes paid: $9,283 (reported on 22.5% of returns)
02535:
$9,283
State:
$8,782
(% of AGI for various income ranges: 176.0% for AGIs below $25k, 487.5% for AGIs $50k-75k, 985.0% for AGIs $100k-200k, 4530.0% for AGIs over 200k)
Earned income credit: $1,586 (reported on 8.8% of returns)
Here:
$1,586
State:
$1,909
(% of AGI for various income ranges: 111.0% for AGIs below $25k)
Percentage of individuals using paid preparers for their 2020 taxes: 95.0%
Here:
95%
State:
92%
(% for various income ranges: 91.3% for AGIs below $25k, 93.3% for AGIs $25k-50k, 100.0% for AGIs $50k-75k, 100.0% for AGIs $75k-100k, 91.7% for AGIs $100k-200k, 100.0% for AGIs over 200k)
Averages for the 2012 tax year for zip code 02535, filed in 2013:
Average Adjusted Gross Income (AGI) in 2012: $101,853 (Individual Income Tax Returns)
Here:
$101,853
State:
$81,425
Salary/wage: $47,191 (reported on 69.4% of returns)
Here:
$47,191
State:
$64,752
(% of AGI for various income ranges: 51.2% for AGIs below $25k, 56.8% for AGIs $25k-50k, 58.1% for AGIs $50k-75k, 46.1% for AGIs $75k-100k, 42.3% for AGIs $100k-200k, 20.0% for AGIs over 200k)
Taxable interest for individuals: $3,332 (reported on 54.8% of returns)
This zip code:
$3,332
Massachusetts:
$2,136
(% of AGI for various income ranges: 4.6% for AGIs below $25k, 0.9% for AGIs $25k-50k, 0.6% for AGIs $50k-75k, 1.6% for AGIs $75k-100k, 0.9% for AGIs $100k-200k, 2.1% for AGIs over 200k)
Ordinary dividends: $18,988 (reported on 41.9% of returns)
Here:
$18,988
State:
$9,473
(% of AGI for various income ranges: 6.0% for AGIs below $25k, 7.7% for AGIs $25k-50k, 3.6% for AGIs $50k-75k, 6.7% for AGIs $75k-100k, 8.4% for AGIs $100k-200k, 8.5% for AGIs over 200k)
Net capital gain/loss in AGI: +$90,414 (reported on 33.9% of returns)
Here:
+$90,414
State:
+$31,437
(% of AGI for various income ranges: 0.1% for AGIs $25k-50k, 3.9% for AGIs $75k-100k, 5.0% for AGIs $100k-200k, 49.6% for AGIs over 200k)
Profit/loss from business: +$26,408 (reported on 40.3% of returns)
Here:
+$26,408
State:
+$20,662
(% of AGI for various income ranges: 35.2% for AGIs below $25k, 19.2% for AGIs $25k-50k, 12.7% for AGIs $50k-75k, 17.9% for AGIs $75k-100k, 17.8% for AGIs $100k-200k, 4.5% for AGIs over 200k)
Taxable individual retirement arrangement distribution: $35,938 (reported on 12.9% of returns)
02535:
$35,938
Massachusetts:
$18,892
(% of AGI for various income ranges: 9.5% for AGIs $25k-50k, 17.7% for AGIs $75k-100k, 4.6% for AGIs over 200k)
Total itemized deductions: $36,611 (20% of AGI, reported on 45.2% of returns)
Here:
$36,611
State:
$28,907
Here:
19.8% of AGI
State:
18.2% of AGI
(% of AGI for various income ranges: 41.7% for AGIs below $25k, 19.1% for AGIs $25k-50k, 18.8% for AGIs $50k-75k, 23.3% for AGIs $75k-100k, 19.5% for AGIs $100k-200k, 12.1% for AGIs over 200k)
Charity contributions: $6,630 (reported on 37.1% of returns)
Here:
$6,630
State:
$4,208
(% of AGI for various income ranges: 1.9% for AGIs below $25k, 0.8% for AGIs $25k-50k, 1.5% for AGIs $50k-75k, 0.3% for AGIs $75k-100k, 1.5% for AGIs $100k-200k, 3.3% for AGIs over 200k)
Taxes paid: $12,593 (reported on 43.5% of returns)
02535:
$12,593
State:
$13,303
(% of AGI for various income ranges: 7.6% for AGIs below $25k, 3.8% for AGIs $25k-50k, 5.6% for AGIs $50k-75k, 4.9% for AGIs $75k-100k, 6.5% for AGIs $100k-200k, 5.2% for AGIs over 200k)
Earned income credit: $1,450 (reported on 12.9% of returns)
Here:
$1,450
State:
$1,971
(% of AGI for various income ranges: 4.5% for AGIs below $25k)
Percentage of individuals using paid preparers for their 2012 taxes: 77.4%
Here:
77%
State:
56%
(% for various income ranges: 70.8% for AGIs below $25k, 75.0% for AGIs $25k-50k, 75.0% for AGIs $50k-75k, 80.0% for AGIs $75k-100k, 85.7% for AGIs $100k-200k, 100.0% for AGIs over 200k)
Averages for the 2004 tax year for zip code 02535, filed in 2005:
Average Adjusted Gross Income (AGI) in 2004: $85,105 (Individual Income Tax Returns)
Here:
$85,105
State:
$62,877
Salary/wage: $54,195 (reported on 64.8% of returns)
Here:
$54,195
State:
$52,969
(% of AGI for various income ranges: 103.2% for AGIs below $10k, 50.8% for AGIs $10k-25k, 56.1% for AGIs $25k-50k, 53.1% for AGIs $50k-75k, 44.5% for AGIs $75k-100k, 36.3% for AGIs over 100k)
Taxable interest for individuals: $3,481 (reported on 71.9% of returns)
This zip code:
$3,481
Massachusetts:
$1,945
(% of AGI for various income ranges: 15.3% for AGIs below $10k, 3.8% for AGIs $10k-25k, 3.7% for AGIs $25k-50k, 3.3% for AGIs $50k-75k, 1.8% for AGIs $75k-100k, 2.8% for AGIs over 100k)
Taxable dividends: $11,632 (reported on 46.0% of returns)
Here:
$11,632
State:
$5,323
(% of AGI for various income ranges: 21.3% for AGIs below $10k, 5.1% for AGIs $10k-25k, 5.7% for AGIs $25k-50k, 6.6% for AGIs $50k-75k, 6.5% for AGIs $75k-100k, 6.3% for AGIs over 100k)
Net capital gain/loss: +$47,125 (reported on 40.1% of returns)
Here:
+$47,125
State:
+$20,377
(% of AGI for various income ranges: -15.6% for AGIs below $10k, -1.4% for AGIs $10k-25k, 0.8% for AGIs $25k-50k, 3.9% for AGIs $50k-75k, 1.4% for AGIs $75k-100k, 31.5% for AGIs over 100k)
Profit/loss from business: +$25,344 (reported on 39.4% of returns)
Here:
+$25,344
State:
+$17,837
(% of AGI for various income ranges: 71.0% for AGIs below $10k, 36.8% for AGIs $10k-25k, 16.8% for AGIs $25k-50k, 13.2% for AGIs $50k-75k, 24.0% for AGIs $75k-100k, 7.5% for AGIs over 100k)
IRA payment deduction: $4,111 (reported on 4.4% of returns)
02535:
$4,111
Massachusetts:
$3,100
Self-employed pension: $19,765 (reported on 2.7% of returns)
Here:
$19,765
Massachusetts:
$14,516
Total itemized deductions: $34,085 (21% of AGI, reported on 43.8% of returns)
Here:
$34,085
State:
$22,573
Here:
21.2% of AGI
State:
19.5% of AGI
(% of AGI for various income ranges: 62.4% for AGIs below $10k, 18.0% for AGIs $10k-25k, 22.5% for AGIs $25k-50k, 23.4% for AGIs $50k-75k, 17.8% for AGIs $75k-100k, 15.7% for AGIs over 100k)
Charity contributions deductions: $5,509 (4% of AGI, reported on 37.2% of returns)
Here:
$5,509
State:
$3,295
Here:
3.5% of AGI
State:
2.7% of AGI
(% of AGI for various income ranges: 1.4% for AGIs $10k-25k, 2.4% for AGIs $25k-50k, 2.0% for AGIs $50k-75k, 2.1% for AGIs $75k-100k, 2.6% for AGIs over 100k)
Total tax: $16,199 (reported on 84.5% of returns)
02535:
$16,199
State:
$11,494
(% of AGI for various income ranges: 15.9% for AGIs below $10k, 9.1% for AGIs $10k-25k, 8.8% for AGIs $25k-50k, 9.6% for AGIs $50k-75k, 12.8% for AGIs $75k-100k, 18.7% for AGIs over 100k)
Earned income credit: $1,245 (reported on 7.9% of returns)
Here:
$1,245
State:
$1,518
Percentage of individuals using paid preparers for their 2004 taxes: 75.0%
Here:
75%
State:
58%
(% for various income ranges: 66.7% for AGIs below $10k, 68.0% for AGIs $10k-25k, 71.5% for AGIs $25k-50k, 78.5% for AGIs $50k-75k, 89.8% for AGIs $75k-100k, 89.7% for AGIs over 100k)
Likely homosexual households (counted as self-reported same-sex unmarried-partner households)
Lesbian couples: 0.0% of all households
Gay men: 0.5% of all households
Household received Food Stamps/SNAP in the past 12 months: 9 Household did not receive Food Stamps/SNAP in the past 12 months: 768
Women who had a birth in the past 12 months: 14 (9 now married, 5 unmarried) Women who did not have a birth in the past 12 months: 380 (98 now married, 284 unmarried)
Housing units in zip code 02535 with a mortgage: 321 (62 second mortgage, 44 both second mortgage and home equity loan) Houses without a mortgage: 7
Median monthly owner costs for units with a mortgage: $3,900 Median monthly owner costs for units without a mortgage: $1,249
Residents with income below the poverty level in 2022:
This zip code:
5.6%
Whole state:
10.4%
Residents with income below 50% of the poverty level in 2022:
This zip code:
1.9%
Whole state:
5.1%
Median number of rooms in houses and condos:
Here:
6.6
State:
6.5
Median number of rooms in apartments:
Here:
4.7
State:
4.0
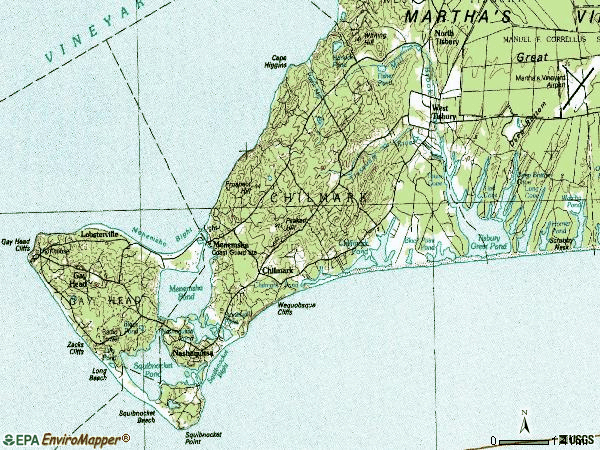
Notable locations in this zip code not listed on our city pages
Notable locations in zip code 02535: Gay Head Light (A), Menamsha Creek Entrance Jetty Light (B), Dutcher Dock (C), Beetlebung Corner (D), Tri - Town Ambulance (E), Aquinnah Fire Department (F), Gay Head Coast Guard Station (G), Chilmark Fire Department Station 1 Headquarters (H), Chilmark Fire Department Station 2 (I), Chilmark Community Center (J), Chilmark Public Library (K), Chilmark Town Hall (L). Display/hide their locations on the map
Lakes, reservoirs, and swamps: Occooch Pond (A), Nashaquitsa Pond (B), Menemsha Pond (C), Lily Pond (D), Harlock Pond (E), Black Point Pond (F), Quenames Cove (G), Chilmark Pond (H). Display/hide their locations on the map
Streams, rivers, and creeks: Tiasquam River (A), Black Brook (B), Menemsha Creek (C), Mill Brook (D), Squibnocket Herring Run (E). Display/hide their locations on the map
In group quarters: 23 (-1 institutionalized population)
Size of family households: 386 2-persons, 122 3-persons, 70 4-persons, 3 5-persons, 7 6-persons
Size of nonfamily households: 176 1-person, 32 2-persons
182 married couples with children.
64 single-parent households (10 men, 54 women).
92.9% of residents of 02535 zip code speak English at home.
0.7% of residents speak Spanish at home (13% very well, 87% well).
3.7% of residents speak other Indo-European language at home (64% very well, 19% well, 17% not well).
1.4% of residents speak Asian or Pacific Island language at home (100% very well).
1.6% of residents speak other language at home (94% very well, 6% well).
Foreign born population: 187 (8.3%) (84.9% of them are naturalized citizens)
This zip code:
8.3%
Whole state:
18.0%
25%Thailand
20%Bolivia
9%France
8%Czechoslovakia (includes Czech Republic and Slovakia)
5%Sweden
5%United Kingdom, excluding England and Scotland
5%Liberia
19%English
9%European
5%German
5%Irish
3%Polish
3%Portuguese
2%Russian
Year of entry for the foreign-born population
622010 or later
392000 to 2009
301990 to 1999
86Before 1990
Facilities with environmental interests located in this zip code:
CHILMARK ELEMENTARY (BOX 60 in CHILMARK, MA)
(National Center for Education Statistics) - STATE ID-774010 Organizations: UP-ISLAND REGIONAL (SCHOOL DISTRICT)
MARTHAS VINEYARD REFUSE DISTRICT (CHILMARK LANDFILL in CHILMARK, MA)
(Resource Conservation and Recovery Act (tracking hazardous waste)) Organizations: TOWN OF CHILMARK (CONTACT/OPERATOR)
NEW ENGLAND TELE (STATE RD in CHILMARK, MA)
(Resource Conservation and Recovery Act (tracking hazardous waste))
CHILMARK (TOWN OF CHILMARK in CHILMARK, MA)
AIR MINOR (AIRS/AFS) Business SIC classification: GENERAL GOVERNMENT
CHILMARK LANDFILL (TABOR HOUSE RD in CHILMARK, MA)
CRITERIA AND HAZARDOUS AIR POLLUTANT INVENTORY (Inventory of air pollution sources) Business SIC classification: REFUSE SYSTEMS Business NAICS classification: SOLID WASTE LANDFILL.
Housing units lacking complete plumbing facilities: 0.7% Housing units lacking complete kitchen facilities: 2.5%
44.7%Bottled, tank, or LP gas
23.3%Electricity
20.0%Fuel oil, kerosene, etc.
6.8%Wood
3.6%Utility gas
0.9%Solar energy
0.5%Other fuel
0.5%No fuel used
Population in 1990: 952. Population change in the 1990s: +253 (+26.6%).
Place of birth for U.S.-born residents:
This state: 1,020
Northeast: 610
Midwest: 187
South: 91
West: 143
62% of the 02535 zip code residents lived in the same house 5 years ago. Out of people who lived in different houses, 39% lived in this county. Out of people who lived in different counties, 50% lived in Massachusetts.
91% of the 02535 zip code residents lived in the same house 1 year ago. Out of people who lived in different houses, 15% moved from this county. Out of people who lived in different houses, 24% moved from different county within same state. Out of people who lived in different houses, 69% moved from different state.
Private vs. public school enrollment:
Students in private schools in grades 1 to 8 (elementary and middle school): 7
Here:
4.1%
Massachusetts:
10.3%
Students in private schools in grades 9 to 12 (high school): 6
Here:
9.0%
Massachusetts:
12.3%
Students in private undergraduate colleges: 49
Here:
79.5%
Massachusetts:
51.2%
Occupation by median earnings in the past 12 months ($)
231,811Legal occupations
124,120Business and financial operations occupations
94,875Management occupations
69,507Construction and extraction occupations
62,800Law enforcement workers including supervisors
58,735Architecture and engineering occupations
Companies with federal contracts located in this zip code:
WAMPANOAG TRIBE OF GAY HEAD (A (20 BLACK BROOK ROAD in AQUINNAH, MA; small business) : $1,687,251 in 3 contractsfrom 2000 to 2001
$1,638,000 with Public Health Service for General Health Care Services. Taking place in RI. Signed on 2000-01-15. Completion date: 2000-12-15.
$28,000, same as above.Signed on 2000-03-15. Completion date: 2000-12-15.
$21,251 with U.S. Army Corps of Engineers - civil program financing only for Archeological/Paleontological Studies. Signed on 2001-08-07. Completion date: 2001-12-31.
MICHAEL W STUTZ (1 NOMANS WATCH RD in CHILMARK, MA; small business)
-$16,000 with Navy for Other Professional Services. Taking place in RI. Signed on 2005-07-05. Completion date: 2005-07-05.
Top industries in this zip code by the number of employees in 2005:
Other Services (except Public Administration): Religious Organizations (20-49 employees: 1 establishment)
Administrative and Support and Waste Management and Remediation Services: Landscaping Services (10-19: 1, 1-4: 3)
Accommodation and Food Services: Limited-Service Restaurants (5-9: 1, 1-4: 5)
Accommodation and Food Services: Full-Service Restaurants (10-19: 1, 1-4: 1)
Construction: Site Preparation Contractors (10-19: 1)
Arts, Entertainment, and Recreation: Independent Artists, Writers, and Performers (5-9: 1, 1-4: 1)
Professional, Scientific, and Technical Services: Veterinary Services (5-9: 1)
Construction: Masonry Contractors (5-9: 1)
People in group quarters in 2010:
5 people in military barracks and dormitories (nondisciplinary)
Fatal accident statistics in 2014:
Fatal accident count: 1
Vehicles involved in fatal accidents: 2
Fatal accidents caused by drunken drivers: 0
Fatalities: 1
Persons involved in fatal accidents: 4
Pedestrians involved in fatal accidents: 0
Most common first names in zip code 02535 among deceased individuals
Name
Count
Lived (average)
Mary
9
85.3 years
Helen
6
84.2 years
William
5
79.0 years
Joseph
5
76.4 years
Ruth
5
85.0 years
Louise
4
87.0 years
Elizabeth
3
86.0 years
James
3
85.0 years
John
3
84.7 years
Anna
3
79.3 years
Most common last names in zip code 02535 among deceased individuals


 Nearest zip codes: 02575, 02543, 02713, 02568, 02557, 02539.