Estimated zip code population in 2022: 7,609 Zip code population in 2010: 7,764 Zip code population in 2000: 8,315
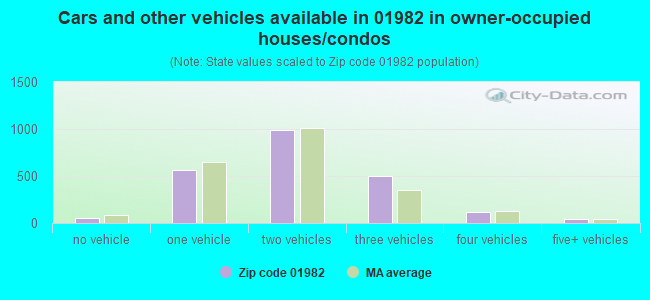
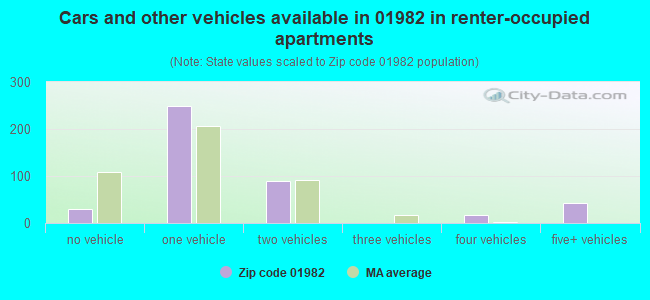
Houses and condos: 2,862 Renter-occupied apartments: 424
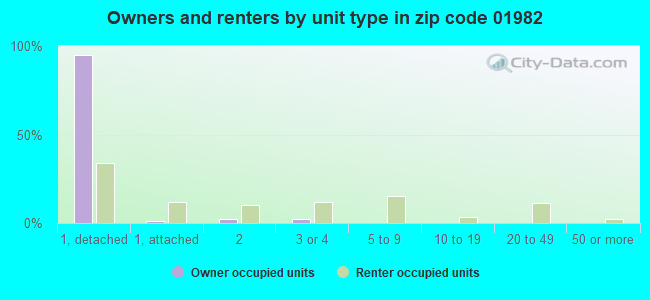
% of renters here:
16%
State:
38%
March 2022 cost of living index in zip code 01982: 132.9 (high, U.S. average is 100)
Land area: 14.2 sq. mi. Water area: 0.7 sq. mi.
Population density: 536 people per square mile
(low).
OSM Map
Google Map
MSN Map
OSM Map
General Map
Google Map
MSN Map
OSM Map
Google Map
MSN Map
OSM Map
Google Map
MSN Map
Please wait while loading the map...
Real estate property taxes paid for housing units in 2022:
This zip code:
1.4% ($9,747)
Massachusetts:
1.0% ($5,536)
Median real estate property taxes paid for housing units with mortgages in 2022: $9,356 (1.3%) Median real estate property taxes paid for housing units with no mortgage in 2022: $9,925 (1.4%)
Business Search- 14 Million verified businesses
Males: 3,714
(48.8%)
Females: 3,895
(51.2%)
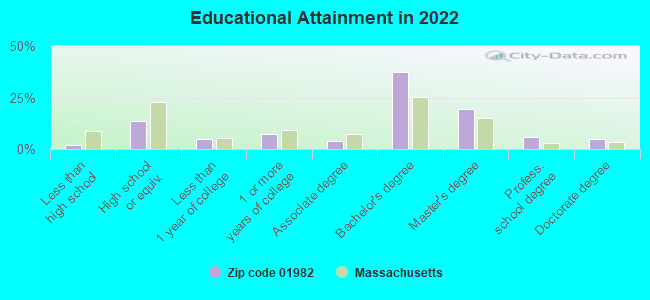
For population 25 years and over in 01982:
High school or higher: 98.9%
Bachelor's degree or higher: 68.3%
Graduate or professional degree: 30.9%
Unemployed: 0.8%
Mean travel time to work (commute): 33.3 minutes
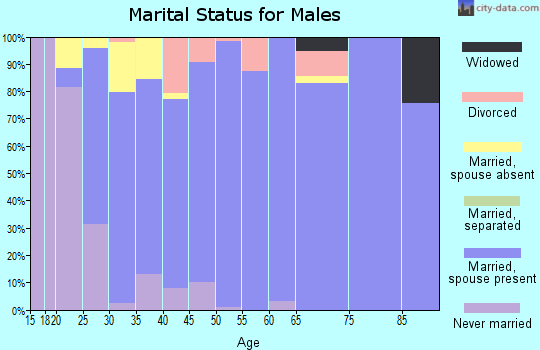
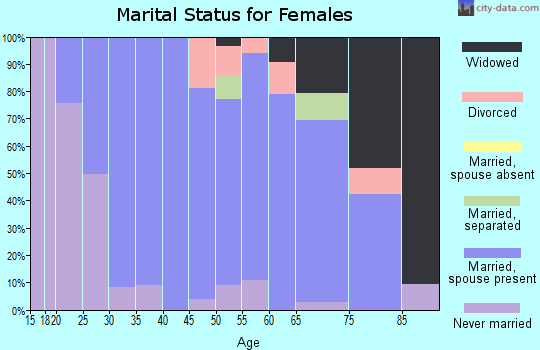
For population 15 years and over in 01982:
Never married: 25.2%
Now married: 63.0%
Separated: 0.3%
Widowed: 4.3%
Divorced: 7.1%
Zip code 01982 compared to state average:
Unemployed percentage significantly below state average.
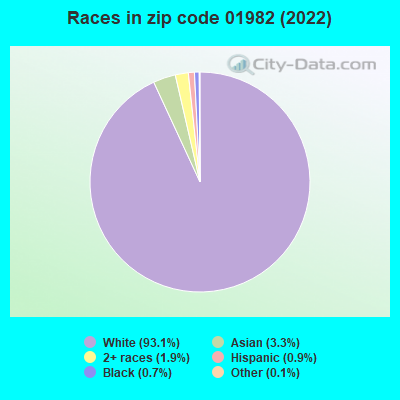
Black race population percentage significantly below state average.
Hispanic race population percentage significantly below state average.
Foreign-born population percentage significantly below state average.
Renting percentage significantly below state average.
Length of stay since moving in significantly above state average.
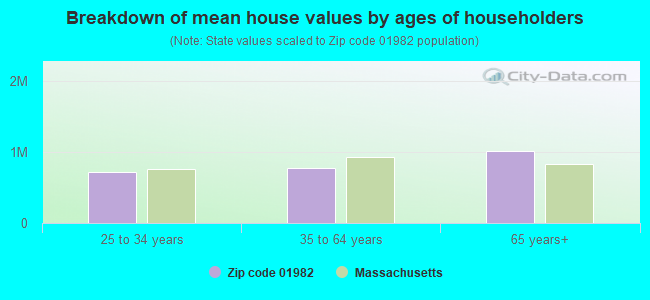
Estimated median house/condo value in 2022: $718,790
01982:
$718,790
Massachusetts:
$534,700
Median resident age:
This zip code:
43.6 years
Massachusetts median age:
40.3 years
Average household size:
This zip code:
2.7 people
Massachusetts:
2.4 people
Averages for the 2020 tax year for zip code 01982, filed in 2021:
Average Adjusted Gross Income (AGI) in 2020: $199,365 (Individual Income Tax Returns)
Here:
$199,365
State:
$105,130
Salary/wage: $140,377 (reported on 80.1% of returns)
Here:
$140,377
State:
$82,951
(% of AGI for various income ranges: 1112.6% for AGIs below $25k, 3547.4% for AGIs $25k-50k, 6327.7% for AGIs $50k-75k, 10443.6% for AGIs $75k-100k, 21240.8% for AGIs $100k-200k, 107530.8% for AGIs over 200k)
Taxable interest for individuals: $2,685 (reported on 53.3% of returns)
This zip code:
$2,685
Massachusetts:
$2,361
(% of AGI for various income ranges: 42.6% for AGIs below $25k, 50.4% for AGIs $25k-50k, 80.9% for AGIs $50k-75k, 194.3% for AGIs $75k-100k, 220.8% for AGIs $100k-200k, 1358.0% for AGIs over 200k)
Ordinary dividends: $15,379 (reported on 45.3% of returns)
Here:
$15,379
State:
$10,365
(% of AGI for various income ranges: 126.0% for AGIs below $25k, 284.1% for AGIs $25k-50k, 352.3% for AGIs $50k-75k, 529.3% for AGIs $75k-100k, 844.4% for AGIs $100k-200k, 7338.8% for AGIs over 200k)
Net capital gain/loss in AGI: +$61,335 (reported on 40.5% of returns)
Here:
+$61,335
State:
+$48,178
(% of AGI for various income ranges: 30.0% for AGIs below $25k, 187.4% for AGIs $25k-50k, 228.2% for AGIs $50k-75k, 543.6% for AGIs $75k-100k, 1031.8% for AGIs $100k-200k, 32470.4% for AGIs over 200k)
Profit/loss from business: +$30,039 (reported on 20.5% of returns)
Here:
+$30,039
State:
+$20,792
(% of AGI for various income ranges: 136.4% for AGIs below $25k, 458.9% for AGIs $25k-50k, 635.9% for AGIs $50k-75k, 776.4% for AGIs $75k-100k, 1110.3% for AGIs $100k-200k, 5200.0% for AGIs over 200k)
Taxable individual retirement arrangement distribution: $29,017 (reported on 13.4% of returns)
01982:
$29,017
Massachusetts:
$22,790
(% of AGI for various income ranges: 110.5% for AGIs below $25k, 292.6% for AGIs $25k-50k, 377.7% for AGIs $50k-75k, 737.1% for AGIs $75k-100k, 1159.7% for AGIs $100k-200k, 2399.2% for AGIs over 200k)
Self-employed (Keogh) retirement plans: $24,675 (reported on 3.4% of returns)
01982:
$24,675
Massachusetts:
$26,868
(% of AGI for various income ranges: 146.4% for AGIs $100k-200k, 956.0% for AGIs over 200k)
Total itemized deductions: $38,300 (reported on 25.4% of returns)
Here:
$38,300
State:
$36,722
(% of AGI for various income ranges: 142.6% for AGIs below $25k, 515.6% for AGIs $25k-50k, 850.9% for AGIs $50k-75k, 1406.4% for AGIs $75k-100k, 1801.0% for AGIs $100k-200k, 8492.4% for AGIs over 200k)
Charity contributions: $12,965 (reported on 21.4% of returns)
Here:
$12,965
State:
$12,529
(% of AGI for various income ranges: 7.9% for AGIs below $25k, 41.5% for AGIs $25k-50k, 91.4% for AGIs $50k-75k, 64.3% for AGIs $75k-100k, 353.3% for AGIs $100k-200k, 3164.0% for AGIs over 200k)
Taxes paid: $9,412 (reported on 25.1% of returns)
01982:
$9,412
State:
$8,782
(% of AGI for various income ranges: 56.9% for AGIs below $25k, 145.6% for AGIs $25k-50k, 325.5% for AGIs $50k-75k, 432.9% for AGIs $75k-100k, 559.5% for AGIs $100k-200k, 1658.8% for AGIs over 200k)
Earned income credit: $1,306 (reported on 4.6% of returns)
Here:
$1,306
State:
$1,909
(% of AGI for various income ranges: 29.3% for AGIs below $25k, 31.9% for AGIs $25k-50k)
Percentage of individuals using paid preparers for their 2020 taxes: 91.5%
Here:
91%
State:
92%
(% for various income ranges: 87.7% for AGIs below $25k, 88.9% for AGIs $25k-50k, 91.9% for AGIs $50k-75k, 92.3% for AGIs $75k-100k, 92.5% for AGIs $100k-200k, 95.1% for AGIs over 200k)
Averages for the 2012 tax year for zip code 01982, filed in 2013:
Average Adjusted Gross Income (AGI) in 2012: $142,556 (Individual Income Tax Returns)
Here:
$142,556
State:
$81,425
Salary/wage: $109,482 (reported on 82.6% of returns)
Here:
$109,482
State:
$64,752
(% of AGI for various income ranges: 70.5% for AGIs below $25k, 68.1% for AGIs $25k-50k, 66.8% for AGIs $50k-75k, 70.2% for AGIs $75k-100k, 75.5% for AGIs $100k-200k, 58.4% for AGIs over 200k)
Taxable interest for individuals: $3,327 (reported on 54.6% of returns)
This zip code:
$3,327
Massachusetts:
$2,136
(% of AGI for various income ranges: 1.9% for AGIs below $25k, 1.2% for AGIs $25k-50k, 0.6% for AGIs $50k-75k, 0.9% for AGIs $75k-100k, 0.7% for AGIs $100k-200k, 1.5% for AGIs over 200k)
Ordinary dividends: $11,543 (reported on 43.1% of returns)
Here:
$11,543
State:
$9,473
(% of AGI for various income ranges: 7.3% for AGIs below $25k, 3.0% for AGIs $25k-50k, 2.9% for AGIs $50k-75k, 2.9% for AGIs $75k-100k, 2.6% for AGIs $100k-200k, 3.8% for AGIs over 200k)
Net capital gain/loss in AGI: +$50,655 (reported on 33.4% of returns)
Here:
+$50,655
State:
+$31,437
(% of AGI for various income ranges: 1.5% for AGIs below $25k, 0.5% for AGIs $25k-50k, 1.1% for AGIs $50k-75k, 1.1% for AGIs $75k-100k, 1.7% for AGIs $100k-200k, 17.7% for AGIs over 200k)
Profit/loss from business: +$30,231 (reported on 21.1% of returns)
Here:
+$30,231
State:
+$20,662
(% of AGI for various income ranges: 8.8% for AGIs below $25k, 7.5% for AGIs $25k-50k, 7.6% for AGIs $50k-75k, 6.3% for AGIs $75k-100k, 5.4% for AGIs $100k-200k, 3.5% for AGIs over 200k)
Taxable individual retirement arrangement distribution: $23,136 (reported on 13.4% of returns)
01982:
$23,136
Massachusetts:
$18,892
(% of AGI for various income ranges: 4.2% for AGIs below $25k, 4.5% for AGIs $25k-50k, 4.9% for AGIs $50k-75k, 4.4% for AGIs $75k-100k, 3.6% for AGIs $100k-200k, 1.1% for AGIs over 200k)
Self-employment retirement plans: $21,273 (reported on 3.1% of returns)
01982:
$21,273
Massachusetts:
$20,669
(% of AGI for various income ranges: 1.2% for AGIs $25k-50k, 0.3% for AGIs $100k-200k, 0.6% for AGIs over 200k)
Total itemized deductions: $38,633 (17% of AGI, reported on 55.7% of returns)
Here:
$38,633
State:
$28,907
Here:
16.6% of AGI
State:
18.2% of AGI
(% of AGI for various income ranges: 26.7% for AGIs below $25k, 17.0% for AGIs $25k-50k, 19.1% for AGIs $50k-75k, 19.3% for AGIs $75k-100k, 19.7% for AGIs $100k-200k, 12.6% for AGIs over 200k)
Charity contributions: $4,849 (reported on 48.3% of returns)
Here:
$4,849
State:
$4,208
(% of AGI for various income ranges: 1.3% for AGIs below $25k, 1.3% for AGIs $25k-50k, 1.7% for AGIs $50k-75k, 1.9% for AGIs $75k-100k, 1.9% for AGIs $100k-200k, 1.6% for AGIs over 200k)
Taxes paid: $20,537 (reported on 55.7% of returns)
01982:
$20,537
State:
$13,303
(% of AGI for various income ranges: 8.8% for AGIs below $25k, 6.1% for AGIs $25k-50k, 8.4% for AGIs $50k-75k, 9.1% for AGIs $75k-100k, 9.8% for AGIs $100k-200k, 7.5% for AGIs over 200k)
Earned income credit: $1,578 (reported on 6.6% of returns)
Here:
$1,578
State:
$1,971
(% of AGI for various income ranges: 2.6% for AGIs below $25k, 0.6% for AGIs $25k-50k)
Percentage of individuals using paid preparers for their 2012 taxes: 58.3%
Here:
58%
State:
56%
(% for various income ranges: 50.0% for AGIs below $25k, 54.0% for AGIs $25k-50k, 57.9% for AGIs $50k-75k, 60.0% for AGIs $75k-100k, 59.4% for AGIs $100k-200k, 76.9% for AGIs over 200k)
Averages for the 2004 tax year for zip code 01982, filed in 2005:
Average Adjusted Gross Income (AGI) in 2004: $90,767 (Individual Income Tax Returns)
Here:
$90,767
State:
$62,877
Salary/wage: $79,879 (reported on 81.9% of returns)
Here:
$79,879
State:
$52,969
(% of AGI for various income ranges: 378.2% for AGIs below $10k, 65.5% for AGIs $10k-25k, 73.3% for AGIs $25k-50k, 74.8% for AGIs $50k-75k, 80.9% for AGIs $75k-100k, 69.6% for AGIs over 100k)
Taxable interest for individuals: $2,230 (reported on 67.8% of returns)
This zip code:
$2,230
Massachusetts:
$1,945
(% of AGI for various income ranges: 23.6% for AGIs below $10k, 2.8% for AGIs $10k-25k, 1.8% for AGIs $25k-50k, 1.6% for AGIs $50k-75k, 1.0% for AGIs $75k-100k, 1.6% for AGIs over 100k)
Taxable dividends: $7,375 (reported on 48.1% of returns)
Here:
$7,375
State:
$5,323
(% of AGI for various income ranges: 44.3% for AGIs below $10k, 3.6% for AGIs $10k-25k, 2.0% for AGIs $25k-50k, 3.1% for AGIs $50k-75k, 2.4% for AGIs $75k-100k, 4.2% for AGIs over 100k)
Net capital gain/loss: +$20,045 (reported on 38.9% of returns)
Here:
+$20,045
State:
+$20,377
(% of AGI for various income ranges: -6.7% for AGIs below $10k, 2.4% for AGIs $10k-25k, 0.9% for AGIs $25k-50k, 1.7% for AGIs $50k-75k, 0.3% for AGIs $75k-100k, 11.5% for AGIs over 100k)
Profit/loss from business: +$21,475 (reported on 20.3% of returns)
Here:
+$21,475
State:
+$17,837
(% of AGI for various income ranges: 46.4% for AGIs below $10k, 6.7% for AGIs $10k-25k, 9.6% for AGIs $25k-50k, 4.9% for AGIs $50k-75k, 5.7% for AGIs $75k-100k, 4.0% for AGIs over 100k)
IRA payment deduction: $3,237 (reported on 3.3% of returns)
01982:
$3,237
Massachusetts:
$3,100
(% of AGI for various income ranges: 4.0% for AGIs below $10k, 0.3% for AGIs $25k-50k, 0.3% for AGIs $50k-75k, 0.2% for AGIs $75k-100k, 0.1% for AGIs over 100k)
Self-employed pension: $14,423 (reported on 3.2% of returns)
Here:
$14,423
Massachusetts:
$14,516
Total itemized deductions: $29,171 (19% of AGI, reported on 52.9% of returns)
Here:
$29,171
State:
$22,573
Here:
19.1% of AGI
State:
19.5% of AGI
(% of AGI for various income ranges: 45.0% for AGIs below $10k, 18.7% for AGIs $10k-25k, 18.3% for AGIs $25k-50k, 22.2% for AGIs $50k-75k, 22.1% for AGIs $75k-100k, 15.4% for AGIs over 100k)
Charity contributions deductions: $4,483 (3% of AGI, reported on 49.7% of returns)
Here:
$4,483
State:
$3,295
Here:
2.8% of AGI
State:
2.7% of AGI
(% of AGI for various income ranges: 1.9% for AGIs below $10k, 1.9% for AGIs $10k-25k, 1.9% for AGIs $25k-50k, 2.3% for AGIs $50k-75k, 2.4% for AGIs $75k-100k, 2.6% for AGIs over 100k)
Total tax: $19,163 (reported on 80.6% of returns)
01982:
$19,163
State:
$11,494
(% of AGI for various income ranges: 13.0% for AGIs below $10k, 4.4% for AGIs $10k-25k, 7.9% for AGIs $25k-50k, 8.5% for AGIs $50k-75k, 9.8% for AGIs $75k-100k, 20.3% for AGIs over 100k)
Earned income credit: $1,353 (reported on 5.4% of returns)
Here:
$1,353
State:
$1,518
Percentage of individuals using paid preparers for their 2004 taxes: 57.1%
Here:
57%
State:
58%
(% for various income ranges: 50.3% for AGIs below $10k, 51.0% for AGIs $10k-25k, 51.0% for AGIs $25k-50k, 57.7% for AGIs $50k-75k, 55.9% for AGIs $75k-100k, 70.4% for AGIs over 100k)
Household received Food Stamps/SNAP in the past 12 months: 126 Household did not receive Food Stamps/SNAP in the past 12 months: 2,525
Women who had a birth in the past 12 months: 96 (101 now married, 0 unmarried) Women who did not have a birth in the past 12 months: 1,289 (570 now married, 712 unmarried)
Housing units in zip code 01982 with a mortgage: 1,467 (220 second mortgage, 201 both second mortgage and home equity loan) Houses without a mortgage: 32
Median monthly owner costs for units with a mortgage: $3,362 Median monthly owner costs for units without a mortgage: $1,346
Residents with income below the poverty level in 2022:
This zip code:
5.1%
Whole state:
10.4%
Residents with income below 50% of the poverty level in 2022:
This zip code:
2.4%
Whole state:
5.1%
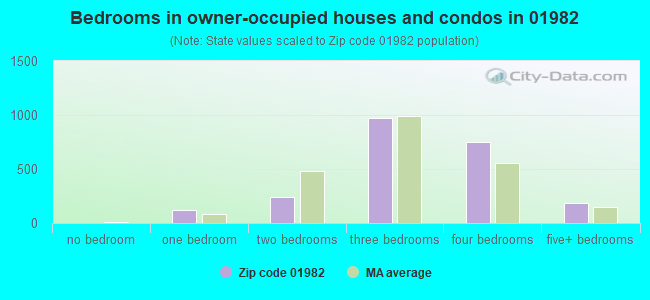
Median number of rooms in houses and condos:
Here:
7.3
State:
6.5
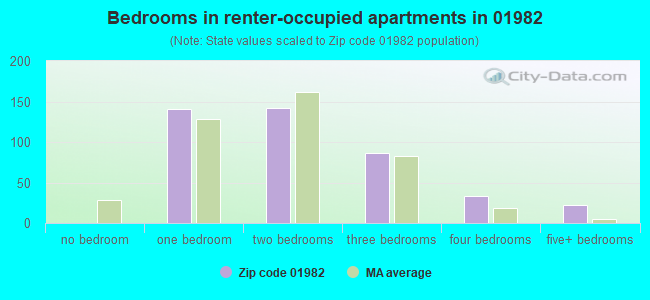
Median number of rooms in apartments:
Here:
4.6
State:
4.0
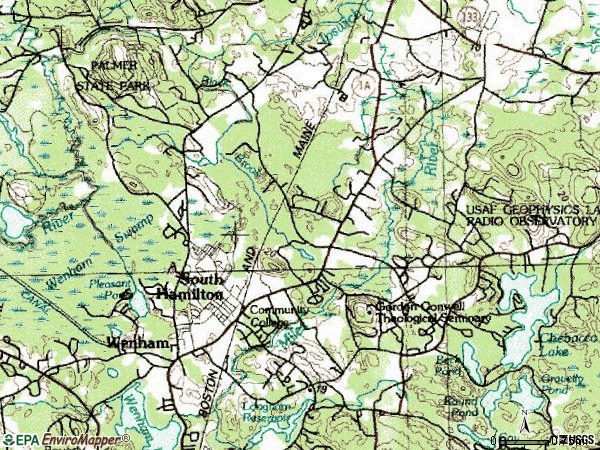
Notable locations in this zip code not listed on our city pages
Notable locations in zip code 01982: Hamilton-Wenham Station (A), Hamilton Fire Department (B), Hamilton-Wenham Public Library (C), Pingree School Library (D). Display/hide their locations on the map
Parks in zip code 01982 include: B W Palmer State Park (1), Hamilton Historic District (2), Patton Park (3), Ipswich Wildlife Sanctuary (4). Display/hide their locations on the map
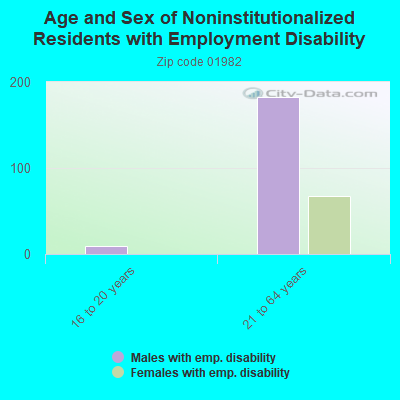
In group quarters: 186 (-1 institutionalized population)
Size of family households: 876 2-persons, 428 3-persons, 449 4-persons, 226 5-persons, 54 6-persons, 32 7-or-more-persons
Size of nonfamily households: 489 1-person, 119 2-persons, 12 3-persons
1,436 married couples with children.
50 single-parent households (6 men, 44 women).
93.2% of residents of 01982 zip code speak English at home.
0.8% of residents speak Spanish at home (96% very well, 4% not well).
1.2% of residents speak other Indo-European language at home (100% very well).
4.4% of residents speak Asian or Pacific Island language at home (84% very well, 13% well, 3% not well).
0.1% of residents speak other language at home (100% well).
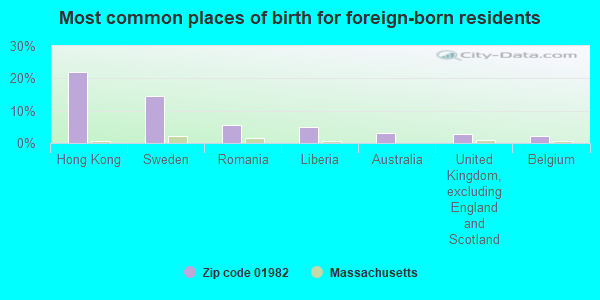
Foreign born population: 548 (7.2%) (68.2% of them are naturalized citizens)
This zip code:
7.2%
Whole state:
18.0%
22%Hong Kong
14%Sweden
6%Romania
5%Liberia
3%Australia
3%United Kingdom, excluding England and Scotland
2%Belgium
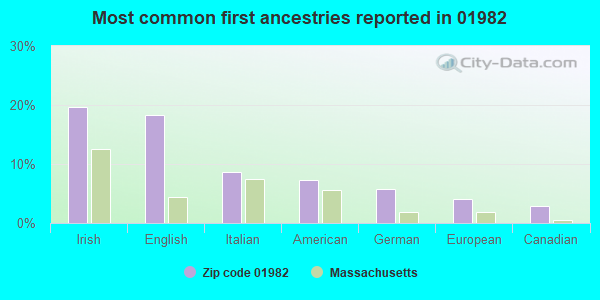
20%Irish
18%English
9%Italian
7%American
6%German
4%European
3%Canadian
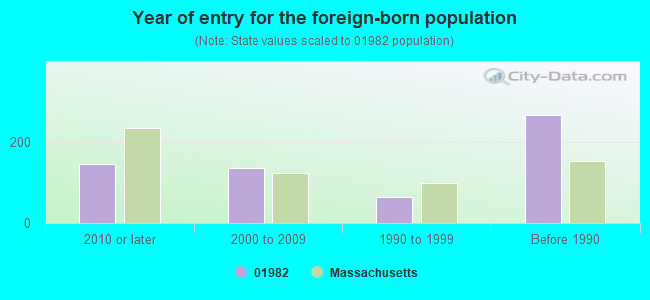
Year of entry for the foreign-born population
1462010 or later
1362000 to 2009
631990 to 1999
266Before 1990
Facilities with environmental interests located in this zip code:
MILES RIVER MIDDLE (787 BAY RD in HAMILTON, MA)
(National Center for Education Statistics) - STATE ID-675310 Organizations: HAMILTON-WENHAM (SCHOOL DISTRICT)
PATTON PARK AUTO BODY (325 WILLOW ST in HAMILTON, MA)
(Resource Conservation and Recovery Act (tracking hazardous waste)) Organizations: JOHN PASTERNAK (CONTACT/OWNER)
Housing units lacking complete plumbing facilities: 1.4%
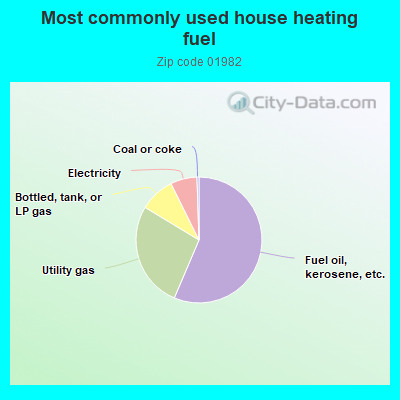
56.3%Fuel oil, kerosene, etc.
27.2%Utility gas
9.0%Bottled, tank, or LP gas
6.8%Electricity
0.5%Coal or coke
Population in 1990: 7,288. Population change in the 1990s: +1,027 (+14.1%).
Place of birth for U.S.-born residents:
This state: 4,928
Northeast: 1,259
Midwest: 389
South: 203
West: 174
64% of the 01982 zip code residents lived in the same house 5 years ago. Out of people who lived in different houses, 49% lived in this county. Out of people who lived in different counties, 50% lived in Massachusetts.
93% of the 01982 zip code residents lived in the same house 1 year ago. Out of people who lived in different houses, 54% moved from this county. Out of people who lived in different houses, 29% moved from different county within same state. Out of people who lived in different houses, 16% moved from different state.
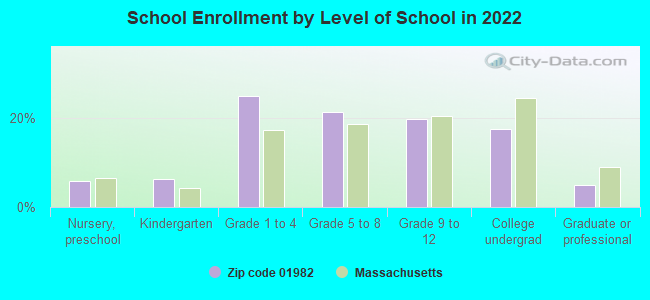
Private vs. public school enrollment:
Students in private schools in grades 1 to 8 (elementary and middle school): 202
Here:
24.3%
Massachusetts:
10.3%
Students in private schools in grades 9 to 12 (high school): 71
Here:
20.2%
Massachusetts:
12.3%
Students in private undergraduate colleges: 179
Here:
56.9%
Massachusetts:
51.2%
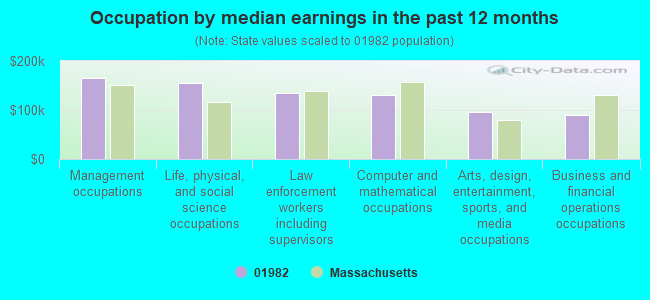
Occupation by median earnings in the past 12 months ($)
166,004Management occupations
154,379Life, physical, and social science occupations
134,606Law enforcement workers including supervisors
131,615Computer and mathematical occupations
95,314Arts, design, entertainment, sports, and media occupations
89,799Business and financial operations occupations
Companies with federal contracts located in this zip code (SOUTH HAMILTON, MA):
CLASSIC RESTORATION AND SALES (BOX 2354; small business) : $4,310,047 in 131 contractsfrom 2000 to 2006
Contracts for Packing and Gasket Materials, Bearings, Plain, Unmounted, Headsets, Handsets, Microphones and Speakers, Gas Turbines and Jet Engines, Non-Aircraft; and Components, and moreby Defense Logistics Agency Signed by year:2000: $103,223; 2001: $39,350; 2002: $0; 2003: $64,219; 2004: $983,549; 2005: $3,061,950; 2006: $57,756.
Biggest contracts:
$499,123 with Defense Logistics Agency for Packing and Gasket Materials. Signed on 2005-07-09. Completion date: 2005-10-08.
$477,967, same as above.Signed on 2005-08-05. Completion date: 2005-11-04.
$443,004, same as above.Signed on 2005-03-10. Completion date: 2005-06-08.
$442,000, same as above.Signed on 2005-01-21. Completion date: 2005-03-15.
JASMIN DEFENSE INDUSTRIAL DEPO (TWO LINCOLN AVENUE; small business) : $838,507 in 57 contractsfrom 2001 to 2006
Contracts for Semiconductor Devices and Associated Hardware, Packing and Gasket Materials, Electrical and Electronic Properties Measuring and Testing Instruments, Coils and Transformers, and moreby Defense Logistics Agency, Army Signed by year:2000: $0; 2001: $186,123; 2002: $237,972; 2003: $0; 2004: $153,015; 2005: $240,388; 2006: $21,009.
Biggest contracts:
$95,924 with Defense Logistics Agency for Semiconductor Devices and Associated Hardware. Signed on 2002-01-28. Completion date: 2002-08-17.
$73,797 with Defense Logistics Agency for Packing and Gasket Materials. Signed on 2001-09-20. Completion date: 2002-03-12.
$56,107, same as above.Signed on 2004-11-28. Completion date: 2005-01-18.
$45,448 with Defense Logistics Agency for Electrical and Electronic Properties Measuring and Testing Instruments. Signed on 2002-06-17. Completion date: 2002-09-15.
PATEL, RAJNIKANT C DR (10 FARRINGTON LN; small business)
$193,722 with Army for Anesthesiology Services. Taking place in TX. Signed on 1999-10-26. Completion date: 1997-09-30.
JASMIN DEFENSE INDUSTRIAL DEPO (TWO LINCOLN AVE; small business) : $115,022 in 13 contractsin 2006
Contracts for Packing and Gasket Materials, Electrical and Electronic Properties Measuring and Testing Instruments, Valves, Nonpowered, Liquid and Gas Flow, Liquid Level, and Mechanical Motion Measuring Instruments, and moreby Defense Logistics Agency Signed by year:2000: $0; 2001: $0; 2002: $0; 2003: $0; 2004: $0; 2005: $0; 2006: $115,022.
Biggest contracts:
$15,705 with Defense Logistics Agency for Packing and Gasket Materials. Signed on 2006-02-04. Completion date: 2006-05-06.
$11,568, same as above.Signed on 2006-01-11. Completion date: 2006-03-14.
$11,010 with Defense Logistics Agency for Electrical and Electronic Properties Measuring and Testing Instruments. Signed on 2006-05-01. Completion date: 2006-08-14.
$10,773 with Defense Logistics Agency for Valves, Nonpowered. Signed on 2006-04-28. Completion date: 2006-06-18.
SUMCO ECO-CONTRACTING, LLC (14 PARK ST; small business)
$7,200 with Army for Landscaping/Groundskeeping Services. Taking place in NH. Signed on 2006-06-20. Completion date: 2006-06-30.
Top industries in this zip code by the number of employees in 2005:
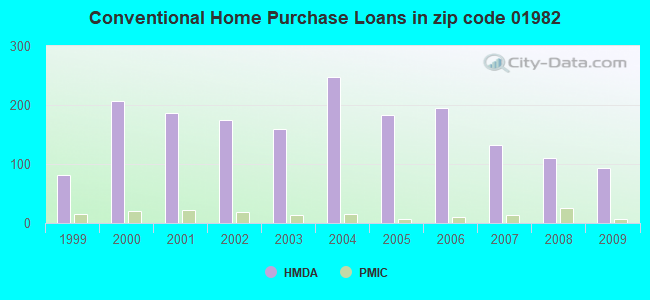
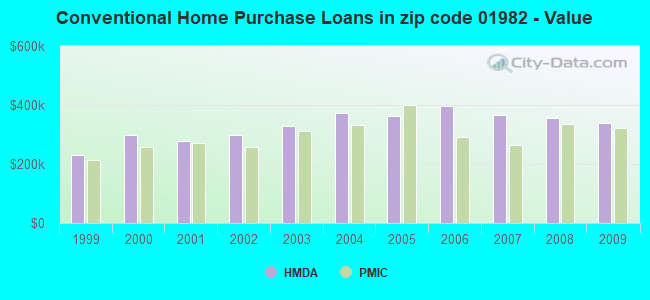
Detailed PMIC statistics for the following Tracts:2151.00
2002 - 2018 National Fire Incident Reporting System (NFIRS) incidents
According to the data from the years 2002 - 2018 the average number of fires per year is 35. The highest number of reported fires - 62 took place in 2006, and the least - 13 in 2017. The data has a decreasing trend.
When looking into fire subcategories, the most incidents belonged to: Structure Fires (63.4%), and Outside Fires (28.7%).
Fire incident types reported to NFIRS in Zip Code 01982


 Nearest zip codes: 01984, 01915, 01938, 01929, 01983, 01969.


 According to the data from the years 2002 - 2018 the average number of fires per year is 35. The highest number of reported fires - 62 took place in 2006, and the least - 13 in 2017. The data has a decreasing trend.
 When looking into fire subcategories, the most incidents belonged to: Structure Fires (63.4%), and Outside Fires (28.7%).